Option A- Freshwater
1/18
Earn XP
Description and Tags
Name | Mastery | Learn | Test | Matching | Spaced | Call with Kai |
|---|
No analytics yet
Send a link to your students to track their progress
19 Terms
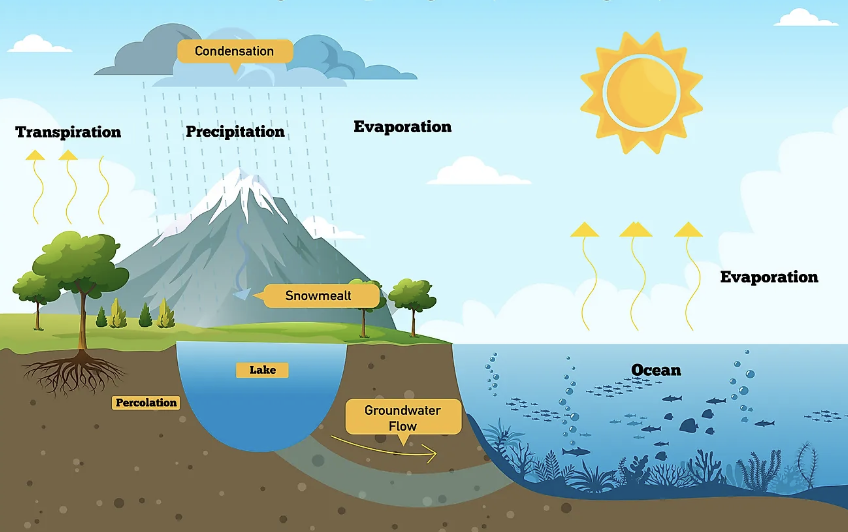
Hydrological Cycle
evapotranspiration
evaporation of water into vapour
water vapour escaping plants
water condenses in clouds
precipitation = rainfall
infiltration- water runs underground
runoff- water travels along surface to reservoirs
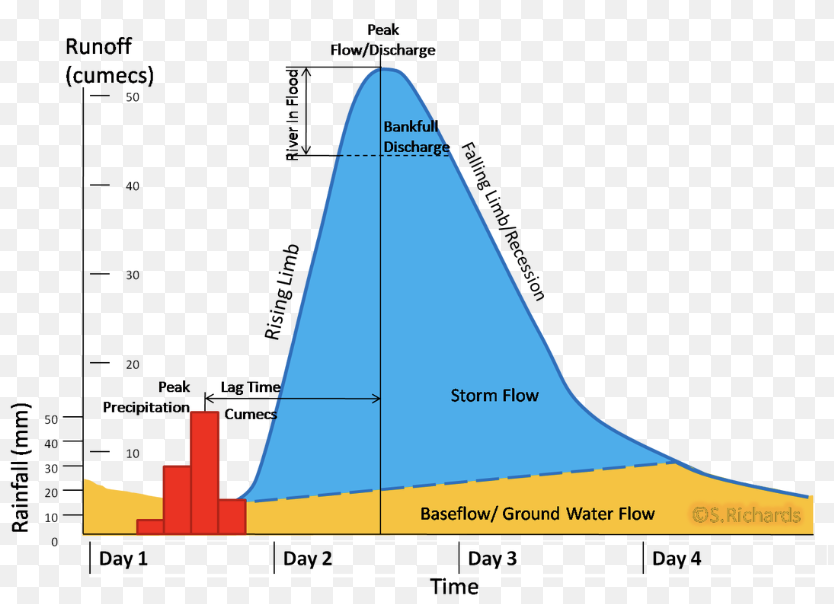
Flood hydrographs
rising limb- rising discharge after a storm
falling limb- falling discharge after peak
peak discharge- max river flow after event
lag time- time between peak rainfall and peak discharge
peak rainfall- max rainfall during storm
drainage density- total length of all streams and rivers divided by total area of drainage basin
bankful capacity- how much water the river can hold
if discharge exceeds bankful, the river floods
flatter curves with a longer lag time are well managed areas, such as gentle slopes, permeable soil, forest, rural area.
Sharp curves with a shorter lag time indicate poorly managed areas with nowhere for the water to go, eg concrete, saturated ground, heavy + quick storm, rock.
Flood prediction
riverine flooding- river systems flood due to heavy water flow
flash flooding- quick and dangerous, caused by lack of drainage
storm surge- low pressure systems raise sea levels, swamp coast
snow melt- rapid snow melt enters river systems in mountains
Flood mitigation- dams
larger than 15m, 2 completed each day
hold water until less risky times
reservoirs- store excess rainwater in upstream drainage basins
Example: Aswan High Dam on Nile, Egypt- agriculture, tourism, recreation, navigation, hydroelectricity. yet, causes water loss downstream.
Flood mitigation- afforestation
flood abatement- decreases runoff to mitigate flood’s peak
includes: revegetation, contour ploughing slopes, sediment clearance, preservation of water reserves
increases interception
Flood mitigation- channel modification
includes: raising banks, straightening river, creating new channels, steel and concrete fortifications
artificial levees- raising banks such as on Mississippi River, USA
Flood mitigation- Planning
personal insurance/preparation
sandbags, flood safe home
loss sharing
disaster aid, insurance
Riperian Zone
vegetated area around a river system
Water scarcity
physical- water consumption > 60% of useable supply
economic- physically enough water, requires more storage and transport options
Drought
dry weather, environment
absolute- 15 consecutive days of less than 0.2mm of rainfall
partial- 29 consecutive days of average daily rainfall less than 0.2mm
impacts- reduced yield, mortality and morbidity, fire and water bans
Water quantity
amount = rate of rainfall, evapotranspiration, river/groundwater
<1% of freshwater is available for human use
~6600 m3 per person per year used → increasing to 4800 by 2025
¾ of rainfall falls on 1/3 of the population
Water use and stress
water stress = <1700 m3 per capita per year in an area
in 2016, 2.3 billion people experienced water stress
since 1922 world population has tripled and water use increased six fold
rivers no longer reach sea, 1/3 of wetlands gone, 20% freshwater species endangered, aquifers and water tables falling
Water Quality
WHO- 4 million deaths per year from water related disease
poorer people who must buy water from vendors end up paying more than richer households who are connected to town water
areas in Asia, Latin America, Carribbean, Africa
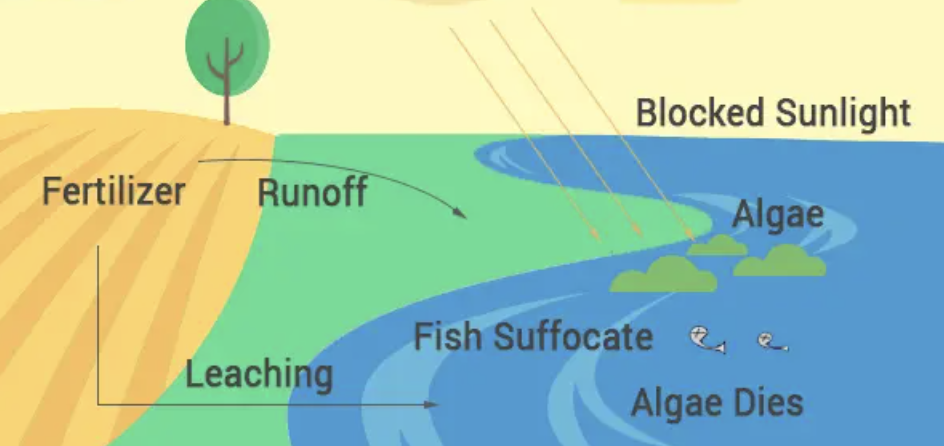
Eutrophication → Pollution
too many nutrients run off into water, providing food for algae to grow
algae block out sunlight, killing plants
algae run out of food and die
bacteria eat dead algae, use up oxygen in water
anoxic water cannot support life
Salinisation → Irrigation
salty groundwater seeps into river
clearing native vegetation decreases water absorption → increases water going into groundwater → more salty water exists
worse crops, low water quality, eroded equipment
human pressures on water systems
bigger population needs more water
water use exceeds 3,700 km3 annually
agriculture consumes 2/3 of water drawn from resources, industry uses 20% of water, municipal 10%
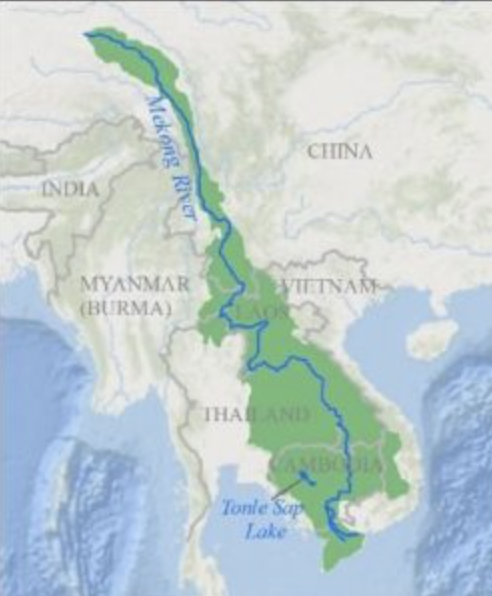
Case Study: Drainage Basin Management
Mekong River System Facts
runs through China, Cambodia, Laos PDR, Thailand, Vietnam, Tibet
7th longest river in Asia, 12th in world
Drains more than 810,000 km2 of land from Plateau of Tibet to South China Sea
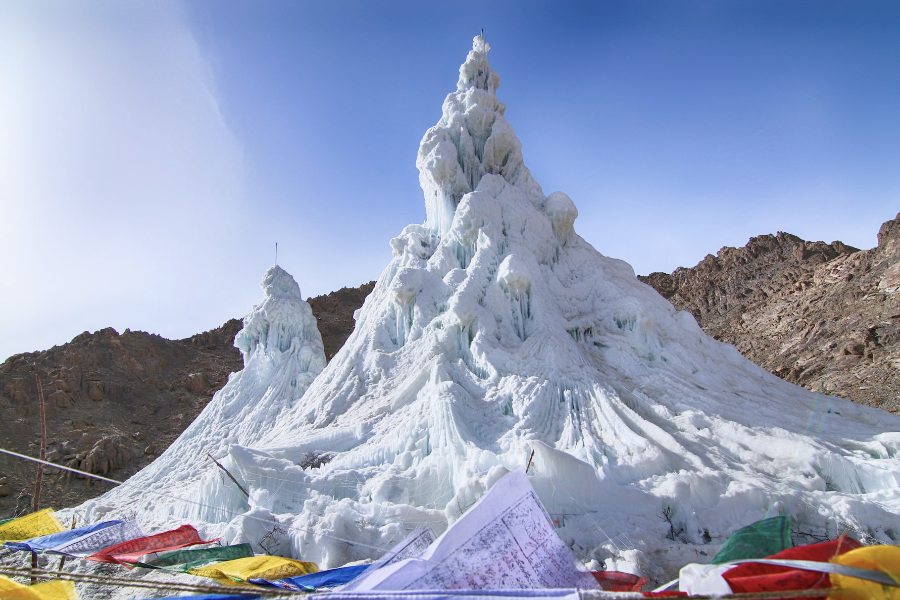
Case Study: Water Security in Remote Areas
Ladakh’s Ice Stupa Project
to cope with water pressure in the Himalayas (eg glaciers melting due to climate change)
freezing abundant water in the off season in pyramid shapes made of buckthorn branches to melt in the spring
provides off season access to fresh water
Integrated Water Resources Management Project
GOAL: to reduce social conflicts from competing countries’ water needs
Mekong River Commission adapted IWRM through 1995 Mekong Agreement Principles