Water Cycle
 Call Kai
 Learn
Learn Practice Test
 Spaced Repetition
 Match
Match Flashcards
 Knowt Play
1/47

There's no tags or description
Looks like no tags are added yet.
Name | Mastery | Learn | Test | Matching | Spaced | Call with Kai | Chat |
|---|
No analytics yet
Send a link to your students to track their progress
48 Terms
Water Facts
•65-70% of human body is water
•80-95% of fresh weight of non-woody plants is water
•Most organisms are 60-65% water by weight
•Typical adult diet requires about 1 kg of food and 2.5 kg of water
•Under ideal conditions, humans could not survive more than 7-10 days without water
Water Facts (cont.)
•71% of earth’s surface is covered with water
•97% of earth’s water is salty
•3% is freshwater
–70% of Earth’s freshwater is in ice sheets and glaciers
–29 % is in groundwater
–0.55% in lakes and reservoirs
–0.004% in river waters
–0.05% in atmosphere
–0.3% in soil
Water distribution
Assume that all water on Earth is represented by 100 liters (26 gallons):
–less than one gallon (3 L) would represent all freshwater.
–less than one teaspoonful would be readily available freshwater (1 ml).
–Large portions of readily available freshwater are polluted.
Water usage
Groundwater makes up about 40% of the water we use (nationwide).
NC about 50% of water usage is from groundwater sources
Surface water use requires expensive filtration (not as potable as groundwater and requires expensive treatment) - often times groundwater is the more cost-effective source of water and less easily polluted.
The hydrologic cycle is powered by _______.
energy from the sun and gravity.
–Solar energy evaporates water and forms water vapor.
–Winds and air movement transport the water vapor.
–Changing temperatures cause condensation and precipitation.
Water cycle components
•Precipitation
•Interception
•Evapotranspiration
•Infiltration
•Groundwater
•Runoff
Precipitation occurs when _______.
3 conditions are met
1) Atmosphere becomes saturated
2) Small particles are present in atmosphere (dust, ocean salt, etc) upon which condensation can take place
3) Water or ice particles grow large enough to reach earth against updrafts
Precipitation factors
Atmospheric saturation results when air mass is cooled until saturation vapor pressure is reached or moisture is added to air mass
Most of the time, precipitation occurs when an air mass is lifted, becomes cooled, and reaches saturation vapor pressure
Frontal systems
two air masses of different temperature and moisture come together, air is lifted at the frontal surface
ex: warm and cold front
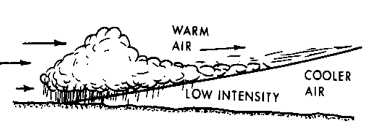
Warm Front
warm air rides up and over a cold air mass- widespread, gentle rainfall that rains steadily
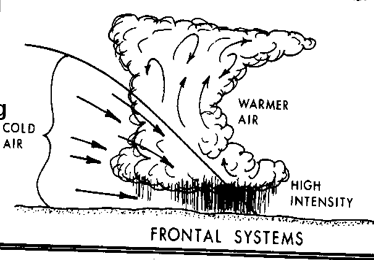
Cold Front
cold air mass replacing and lifting a warm air mass- high intensity, more localized, short duration rainfall; generates strong intense storms
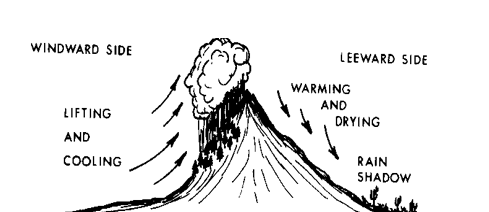
Orographic
when general circulation forces an air mass up and over a mountain range- air mass reaches saturation vapor pressure, resulting in more precipitation on windward side- rain shadow on other side
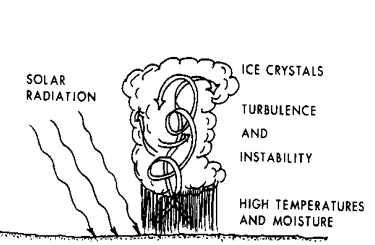
Convective
excessive heating of earth’s surface and layer of moist air adjacent to surface- Air mass rises, condensation occurs, latent heat of vaporization adds more energy, more lifting- rapid uplift results in frozen water droplets, hail, and severe thunderstorms
common near equator
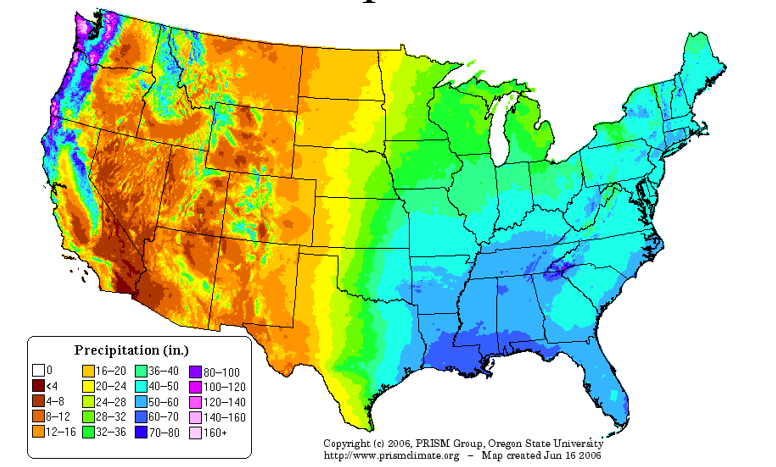
US precipitation
Rainfall distribution is uneven
East of Mississippi 40-45”/yr
Pacific Northwest 80”/yr
Midwest much lower 10-20”/yr
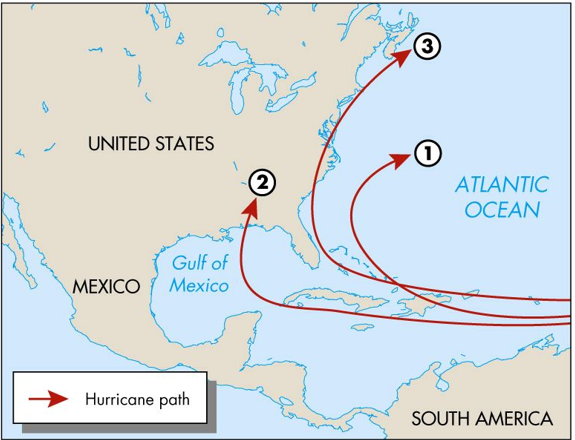
3 common hurricane paths in the Atlantic
Drought
a period of abnormally dry weather sufficiently prolonged for the lack of water to cause serious hydrologic imbalance in the affected area
3 types: meteorological, agricultural, and hydrologic
You can have one type of drought but not the other
Ex: You get a lot of snow for a couple of months, but then no rain → meteorological (not hydrologic because the snow melted and became groundwater)
Meteorological
based on precipitation
Agricultural
based on soil moisture
is the topsoil wet enough to grow crops?
Hydrologic
based on streamflow, groundwater
NC Drought maps
Moderate- Beige
Severe- orange
Extreme- Red
Exceptional- Brown

Tools to measure/estimate precipitation
•Weather Stations - tell you everything on climate
•Rain gauges
–Manual
–Automated - don’t need to manually read → for research purposes
•Satellite and radar
•State Climate Office - historical and long-term data
•NOAA Weather Stations
•Volunteer reporters - report how much rain they received → helps calibrate radars and satellites
Interception
prevention of precipitation from reaching soil surface
Types of interception
Ic = canopy interception loss
Pg = gross precipitation → total amount of rainfall measured above the canopy, usually by a standard rain gauge placed in an open area; full precipitation input to an ecosystem before any interception or partitioning occurs
Th = throughfall → portion of incident precipitation, such as rainfall or snowfall, that reaches the ground surface beneath a vegetated canopy by passing directly through gaps in the foliage or by dripping and splashing from intercepted water on leaves, branches, and stems
Sf = stemflow → captured by the above-ground structure of vegetation, such as tree stems and branches, and subsequently channeled down along the stem to the base of the plant. Transports water, solutes, and sometimes nutrients directly to the soil around the root zone.
Pn = net precipitation → actual rainfall that reaches the soil surface
Ii = litter interception → hits debris on forest floor

Controls on Interception and Throughfall
•Storm size and frequency- small and infrequent storms may have higher interception rates. Larger, more intense storms less interception.
•Hardwood vs conifer- variable, but mature conifers typically have higher interception rates than mature hardwoods
•Growing vs dormant season- growing season more leaf area
•Snow vs rain- typically more interception in rainstorms relative to snowstorms
•Stand density- more trees, more potential for interception
•Energy availability- influences evaporation
•Location under canopy- sheltered, drip line, etc.,
Evaporation
–Net loss of water from a surface resulting from a change in state of water from liquid to vapor
Transpiration
–Net loss of water from plant leaves by evaporation through leaf stomata.
Evapotranspiration
Evaporation + transpiration
The Evapotranspiration Process
•Requires:
1.A flow of energy to the evaporating or transpiring surface
2.A flow of liquid water to these surfaces
3.A flow of vapor away from these surfaces
Effects of vegetative cover on evapotranspiration
Forested soil → most evapotranspiration
bare soil → least evapotranspiration

Potential evapotranspiration estimates
•Thornthwaite method (requires air temperature data)
•Hamon method (requires air temperature data)
•Penman method (requires radiation, vapor pressure, wind speed data)
–Most physically based but requires expensive data.
Components of the Water Balance
P = ET + Q + DS + Dl
where: P = precipitation ET = evapotranspiration
Q = runoff (River discharge)
DS = change in storage
Dl = change in seepage
Simple water budget
•(no storage/seepage considered)
•Suitable when conducted over a period when changes in storage would be small
•Typically conducted from October-October (1 water year)
•ET for a watershed can be estimated from P-Q = ET
Infiltration
–The process by which water enters the soil surface
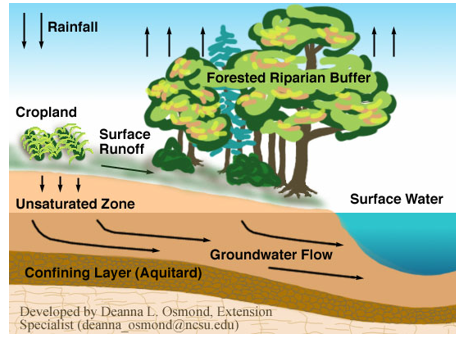
Infiltration rate
–Rate of water passing into the soil (inch/hr, ft/day, cm/hr, etc)
what it is actively doing right now
Infiltration capacity
– Maximum rate of water infiltration for given soil conditions
Infiltration rate depends on _______.
soil properties and the soil surface conditions
Soil surface conditions:
–Plant material or litter Protects soil from raindrop impact (compacts soil); Stores water, retards flow
•Overall, conditions that reduce vegetative cover and compact the soil surface cause infiltration to diminish
(Causes runoff to increase)
Controls on infiltration
•Soil water content- soils already saturated will be more likely to produce runoff & less infiltration
•Soil porosity- soils with more connected void spaces can transmit water more readily than soils with less voids
•Soil biological activity- worm holes, animal burrows can increase porosity and infiltration
•Soil litter layer- protects soil surface from crusting/compaction and increases infiltration
•Soil frost- can reduce infiltration
•Clay type- some clays expand when wet, close pores and reduce infiltration
•Quality of infiltrating water- “clean” water will infiltrate quicker than water with sediment, organics
Land use affects water cycle dynamics →infiltration impact on surface runoff
surface runoff rate = how much h2o is moving across
Because rainfall rate is greater than infiltration capacity → surface runoff

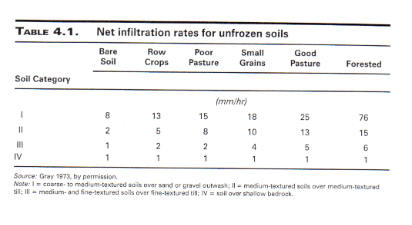
Forested soils have the _______.
Greatest infiltration rates
Organic litter at surface
Root cavities
Burrowing animals
Earthworms
Overland flow and flooding is least likely
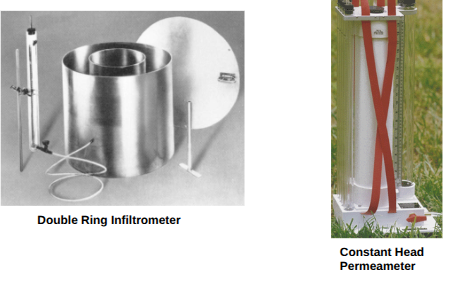
Measuring Infiltration Rates
Double Ring Infiltrometer = Two metal cylinders (usually 12-inch inner and 24-inch outer rings) are driven into the ground. Both rings are filled with water. Water level is kept steady using a constant head setup or measured with a dip float. The water drop speed in the inner ring shows the soil infiltration rate.
Constant Head Permeameter = used for deeper depths → tubes fill hole with water → as water seeps out of bore hole into the soil → water drop is observed in ruler tube
Even in forested areas clay can ______.
reduce infiltration rates
sandy soils and high vegetation cover → greater infiltration rates
Recharge to groundwater systems
Varies seasonally
More common during periods when plants are dormant and rainfall is high
during the winter, water is more likely to reach the water table → restores groundwater supply
groundwater levels are lowest in the summer → more evaporation & transpiration
Varies spatially
Usually occurs in uplands
Also depends on vegetation water uptake
Water table
Varies seasonally and annually
Is drawn down by pumping of wells
Where it intersects the land surface wetlands, streams, and springs occur
Often may have multiple water levels below the land surface due to aquifers and aquitards and different pressure
Confining bed
largely impermeable layers that hinder water’s movement (ex. clay)
water doesn’t move quickly → low hydrologic conductivity
Aquifers
permeable rock or sediments that transmit water easily (ex. sand or gravel)
high hydrologic conductivity
Runoff generation
When rainfall rate > infiltration capacity
Surface runoff or ponding occurs (overland flow)
The water cycle is much different in _______.
urban settings as compared to natural settings.
In urban settings, there is much more impervious surfaces like parking lots, rooftops, and roads.
more hard surfaces → more runoff → less infiltration
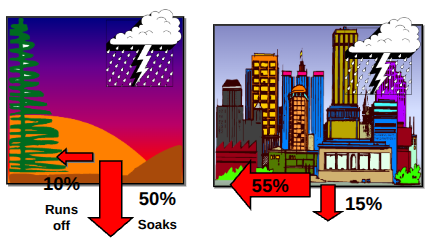
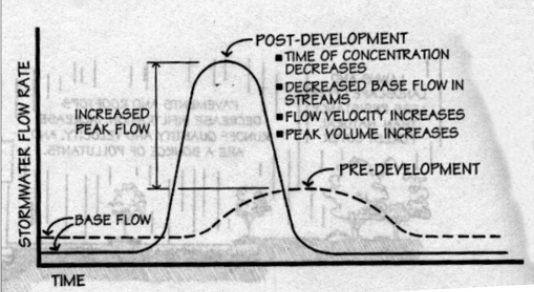
Urban water cycle
natural = takes a while for creek/stream water to rise → runs down vegetation and infiltration → moves through the groundwater system → gradual
parking lot →funnels waters at the same time to creek →large spikes & then low → flash floods