STATS
 Call Kai
 Learn
Learn Practice Test
 Spaced Repetition
 Match
Match Flashcards
 Knowt Play
1/55

There's no tags or description
Looks like no tags are added yet.
Name | Mastery | Learn | Test | Matching | Spaced | Call with Kai | Chat |
|---|
No analytics yet
Send a link to your students to track their progress
56 Terms
main stat words?
populations, samples, parameters, statistics
Definition of Statistics?
Statistics is the science of collecting, classifying, organizing, summarizing, analyzing, and interpreting data to make informed decisions.
data—> extract useful info
Descriptive Statistics?
organizing data (collecting data)
summarizing data
presenting data in an informative way
Inferential statistics?
Determining something about a population based on a sample.
Or methods for making decisions/predictions and drawing conclusions about populations.
Making inferences
population
sample group
inference?
intelligent guess
Sample group to population
Population?
group you are interested in researching
all individual who matter
sampling?
population to sample group
created through randomenss
will face loss of information
Sample group?
represent population
not enough resources to research total population
created through random draw
z tests
for population means
t tests
for comparing one, two, and paired samples
chi square test
for independece and fitness
f tests
for comparing variances
simple linear regression
for modeling relationships between somehting
infernce
uncertainty
can’t be 100% certain conlusion is right
confidence interval quantifies certiantiy
relationship between uncertainty and sample size
bigger the sample size —→ the less uncertainty
inverse relaitonship
Data
refer to any collection of numbers, characters, images, or other items that provide information about something.
Population
A collection or set of all units (usually people, individuals, objects, or events) that we are interested in studying. Populations can be classified into two types: finite and infinite.
Sample
A representative subset of the population's units.
Census
A data collection from every member of the population.
no loss of data 100% certain
Parameter
A numerical value that summarizes a characteristic of an entire population.
unknown but fixed
population
The proportion of all
can only know the true value if there is a census
acts a guideline, something to be based on
Statistic
A numerical value that summarizes the data from a sample
known but vary
sample
The proportion of in our sample
Unit / Subject
The entity from which data is collected or observed in a statistical study.The term "unit" is often used interchangeably with "individual" or "subject" in statistical contexts. Units can be people, animals, objects, or any other entities that are the focus of study and data collection.
Variable
A characteristic of each individual element of a population or sample.
(yes/no)
blank or blank
binary variable
two choices
yes or no
left or right
data matrix
Variable, Case, and Observation
row=case
column=variabe
types of populations
finite
infinite
your turn
pop: us adults
sample: 1000
Types of Variables (or Data)
Qualitative (Categorical)
Quantitative (Numerical)
Qualitative (Categorical)
A variable that describes attributes, labels, or nonnumerical entries.
simple description
1. Car model
2. Days of the week
3. Type of cell phone
4. Zip code
5. Which club you have joined
Qualitative (Categorical): Nominal
No rank or order
• Gender
• Nationalities
• Colors
• Blood Types
jersey numbers
Qualitative (Categorical): Ordinal
Natural order
rime and reason
• Course letter grades: A, B, C, D, or F
• Educational level
• Socioeconomic status
Quantitative (Numerical)
A variable that consists of numerical measurements or counts.
amount, calculated
1. GPAs
2. Student heights
3. Parents’ income
4. Number of text messages per day
5. Weight of textbooks
Quantitative (Numerical): Discrete
counted items
• Number of students in a class
• Number of books on a shelf
• Number of languages a person speaks
list
whole numbers
Quantitative (Numerical): Continuous
Measured items
• Age of preschool children
• Height college students
• Weights of supermodels
• Temperature (oC or oF)
decimal points
can be changed into ordinal if grouped in order
Measurment scales
nominal
ordinal
interval
ration
Nominal level of measurement
categorizes data into mutually exclusive, non-overlapping groups, with no inherent order or ranking among the categories.
Zip code
Gender (male, female)
Major field (Statistics,
Biology, etc.)
Eye color (blue, brown,
green, hazel)
Ordinal level of measurement
organizes data into categories that can be ranked or ordered, but the precise differences between the ranks are not defined.
Grade letter (A, B, C, etc.)
Rating scale (poor, good, excellent)
Judging (first place, second place, etc.)
Interval level of measurement
orders data and allows for meaningful comparisons of differences between values; however, it lacks a true zero point.
Temperature,
IQ score,
SAT score
GPA
true zero=absence of measurement
can’t have no temperature, no IQ
can’t use ratio to compare, something can’t be 2x more than something
always greater than zero
Ratio level of measurement
includes all the properties of the interval level, while also possessing a true zero point. Moreover, meaningful ratios can be formed when comparing measurements of the same variable across different individuals or objects.
Height
Weight
Time
Salary
Age
Can have zero height, wieght, salary
Can use ratios like something being 2x more than something else
Why Do We Use Samples in Statistics?
Difficult to access the entire population: length of all fish
Limited resources: time and money
Destructive measurements: safety car tests
Sampling can be conducted in two ways:
With replacement:
Without replacement
Sampling can be conducted in two ways: With replacement:
perfect randomness
random
a population member may be selected more than once (e.g., Rolling a die, recording the outcome, and then rolling it again—each number can appear multiple times.)
Sampling can be conducted in two ways: Without replacement
non-random
a population member may be selected only once (e.g., drawing a lottery ticket).
population much be large enough
Methods of Sampling
random sampling methods
non-random sampling method
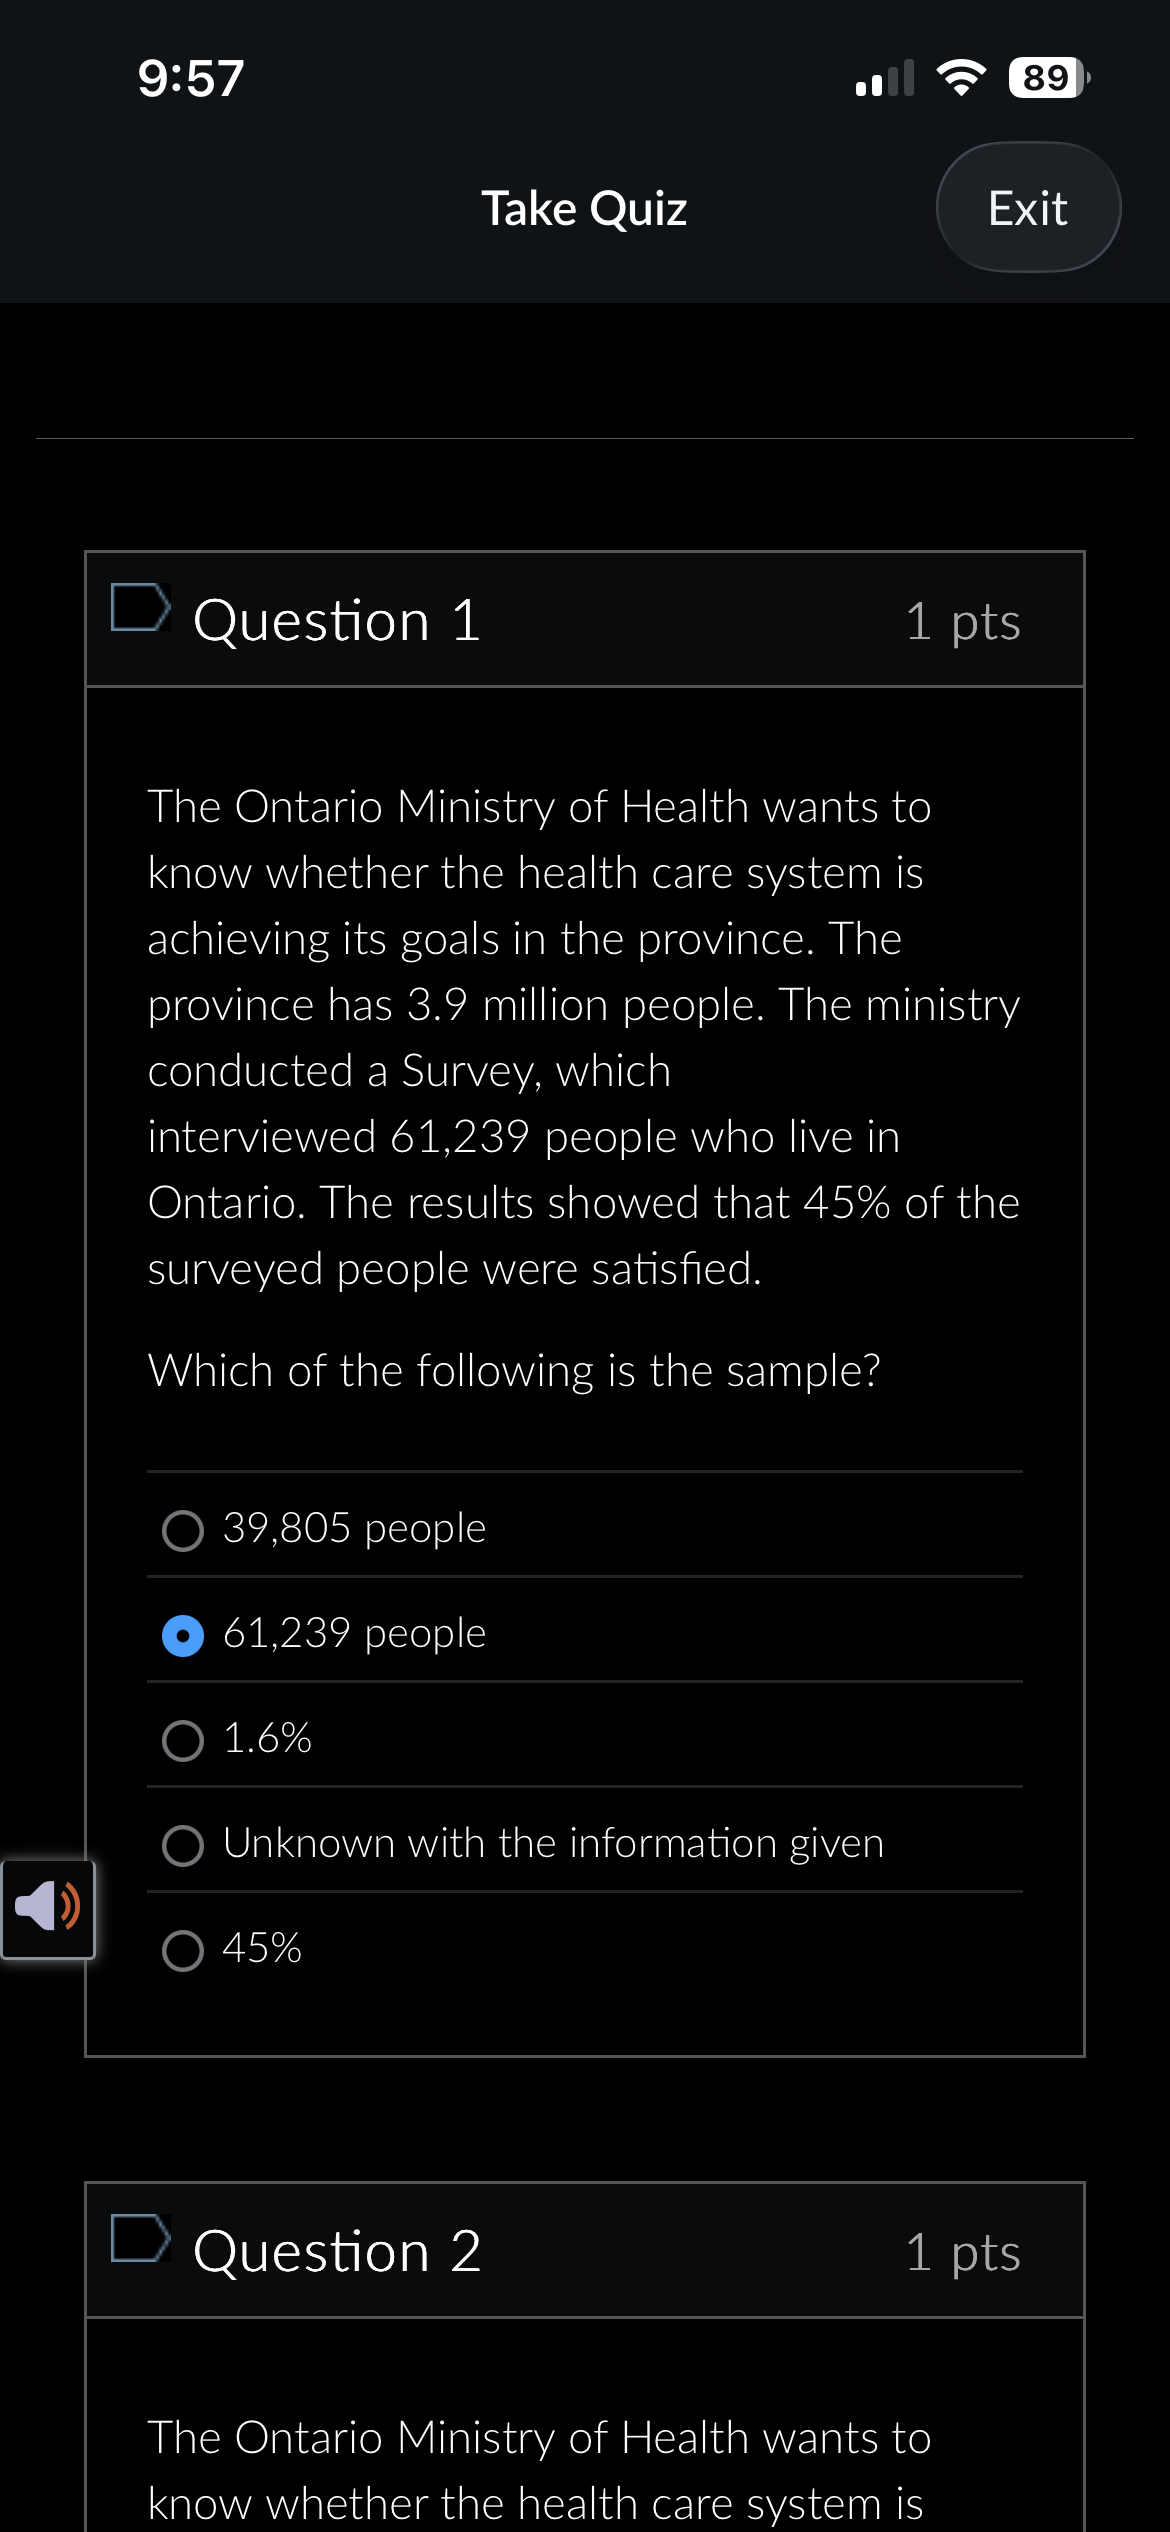
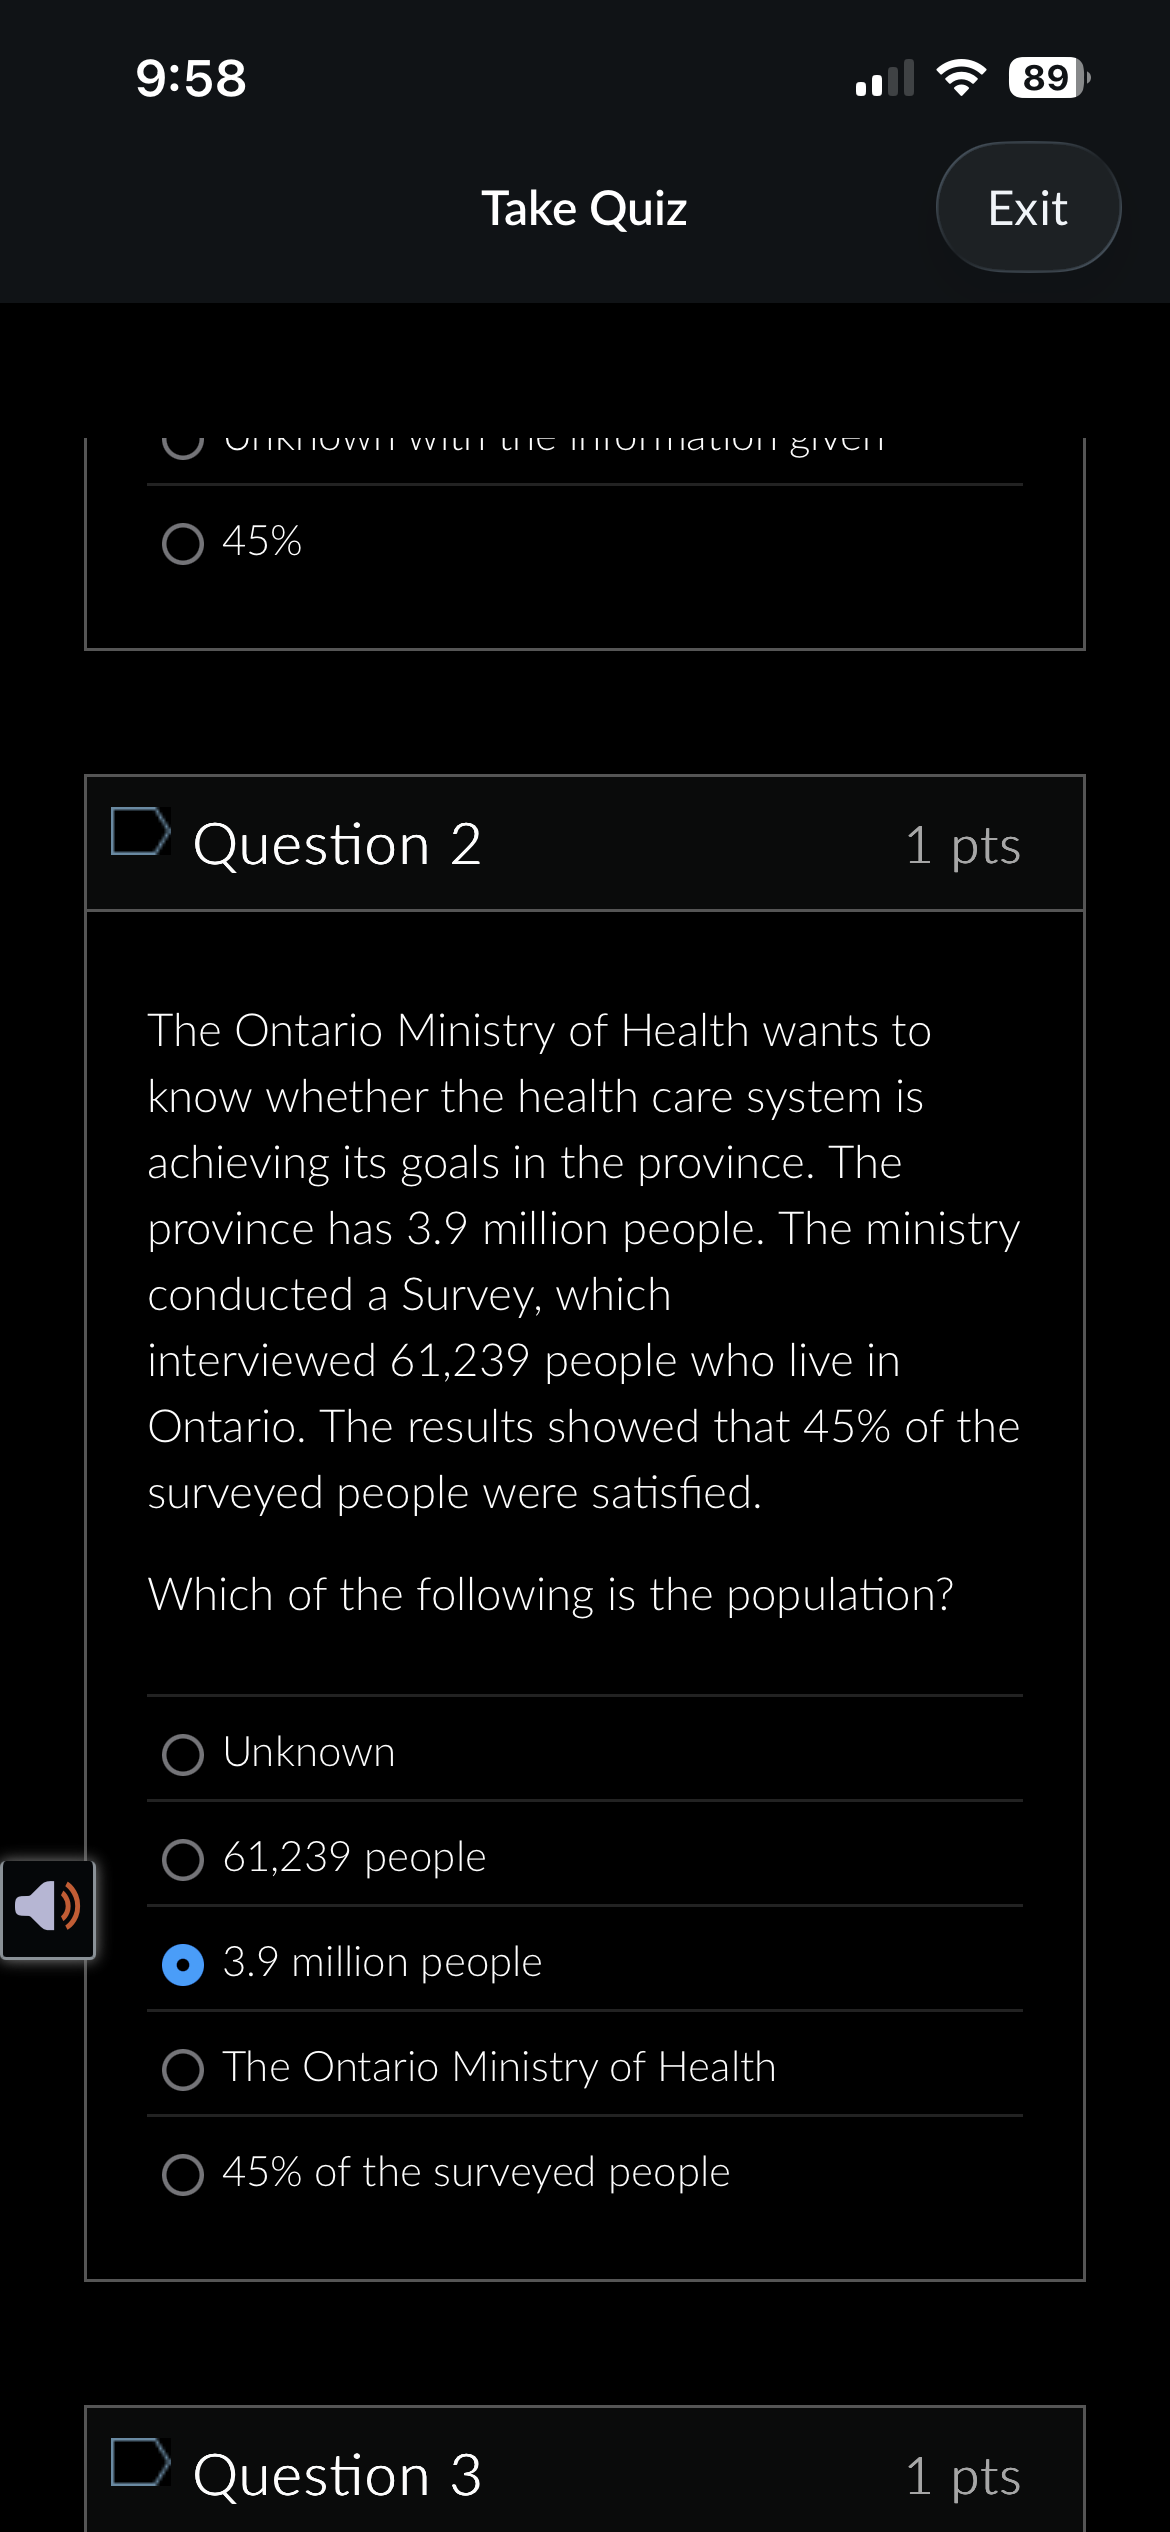
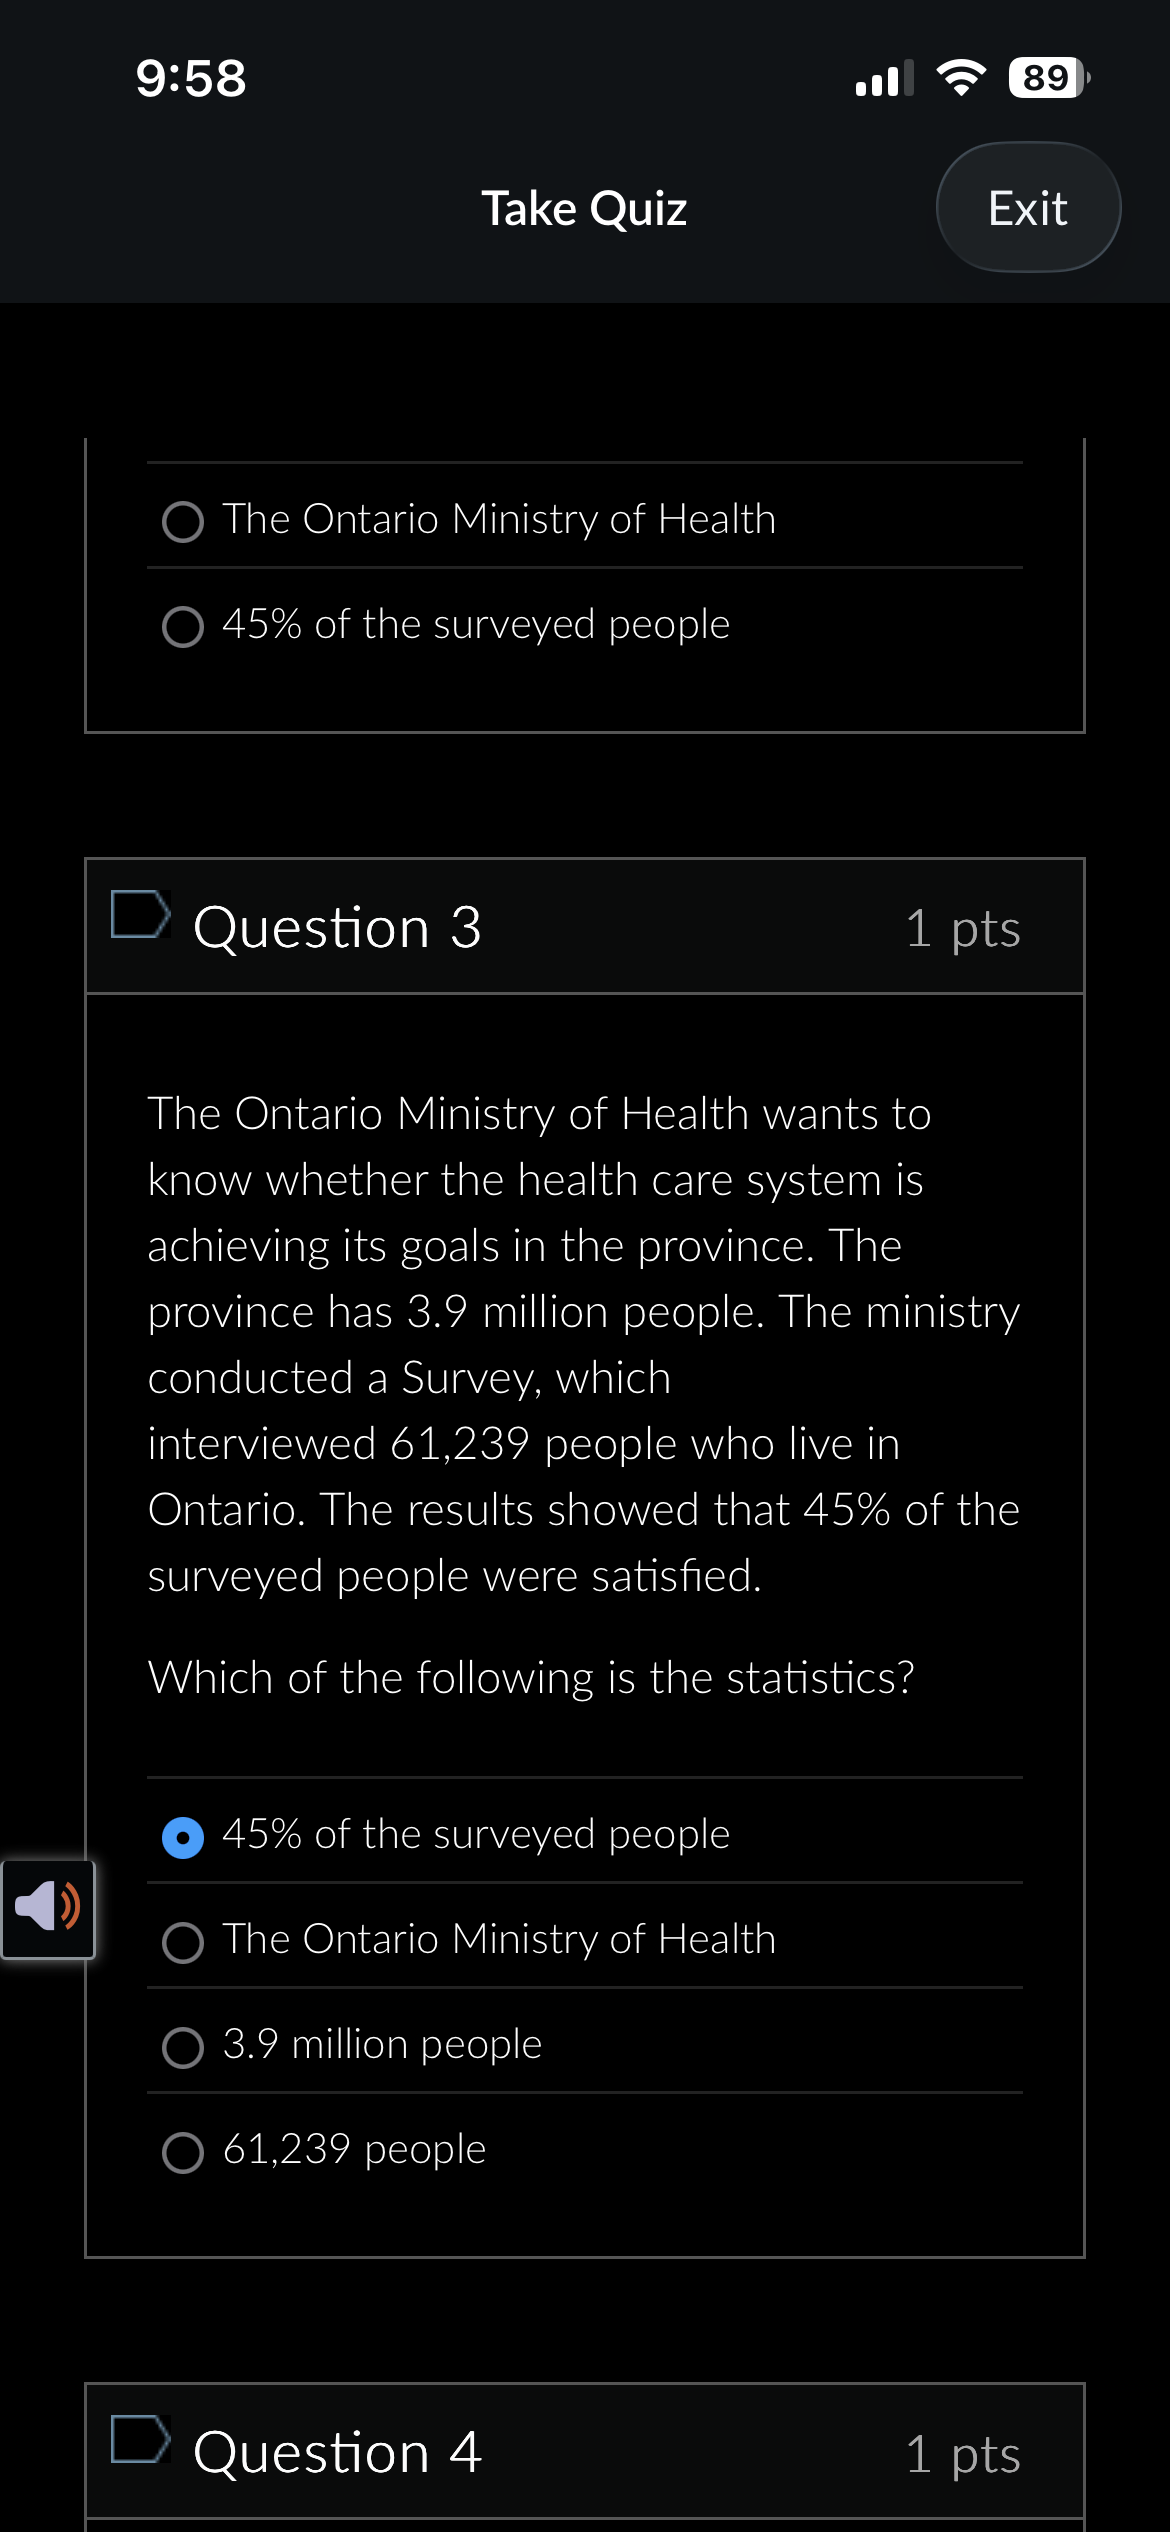
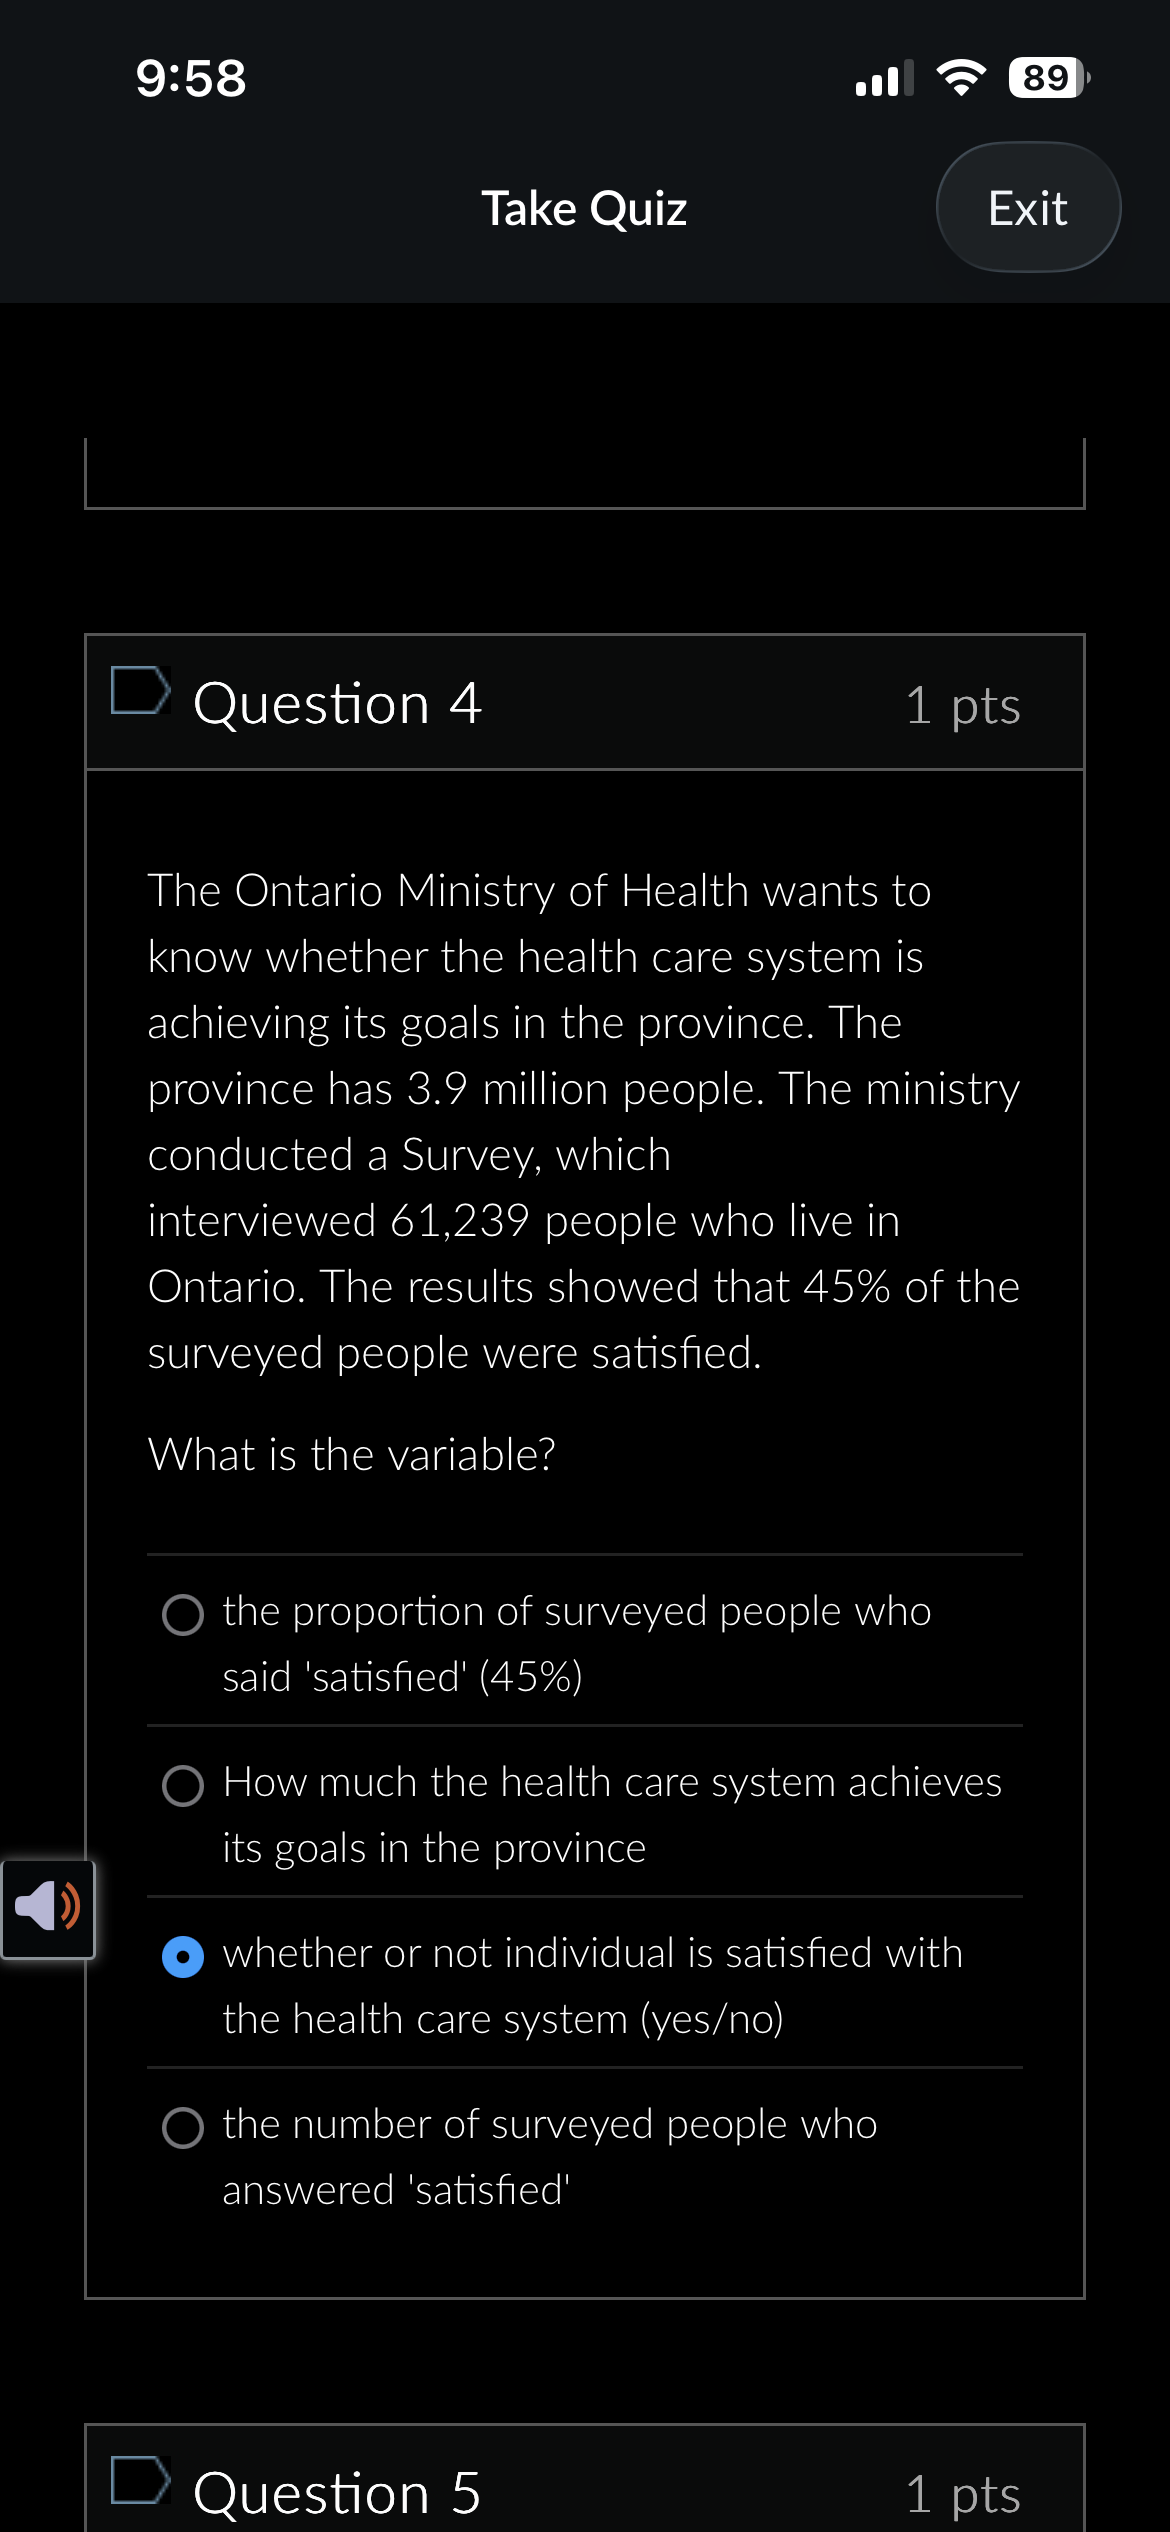
parameter acts as a original guideline, what its based on
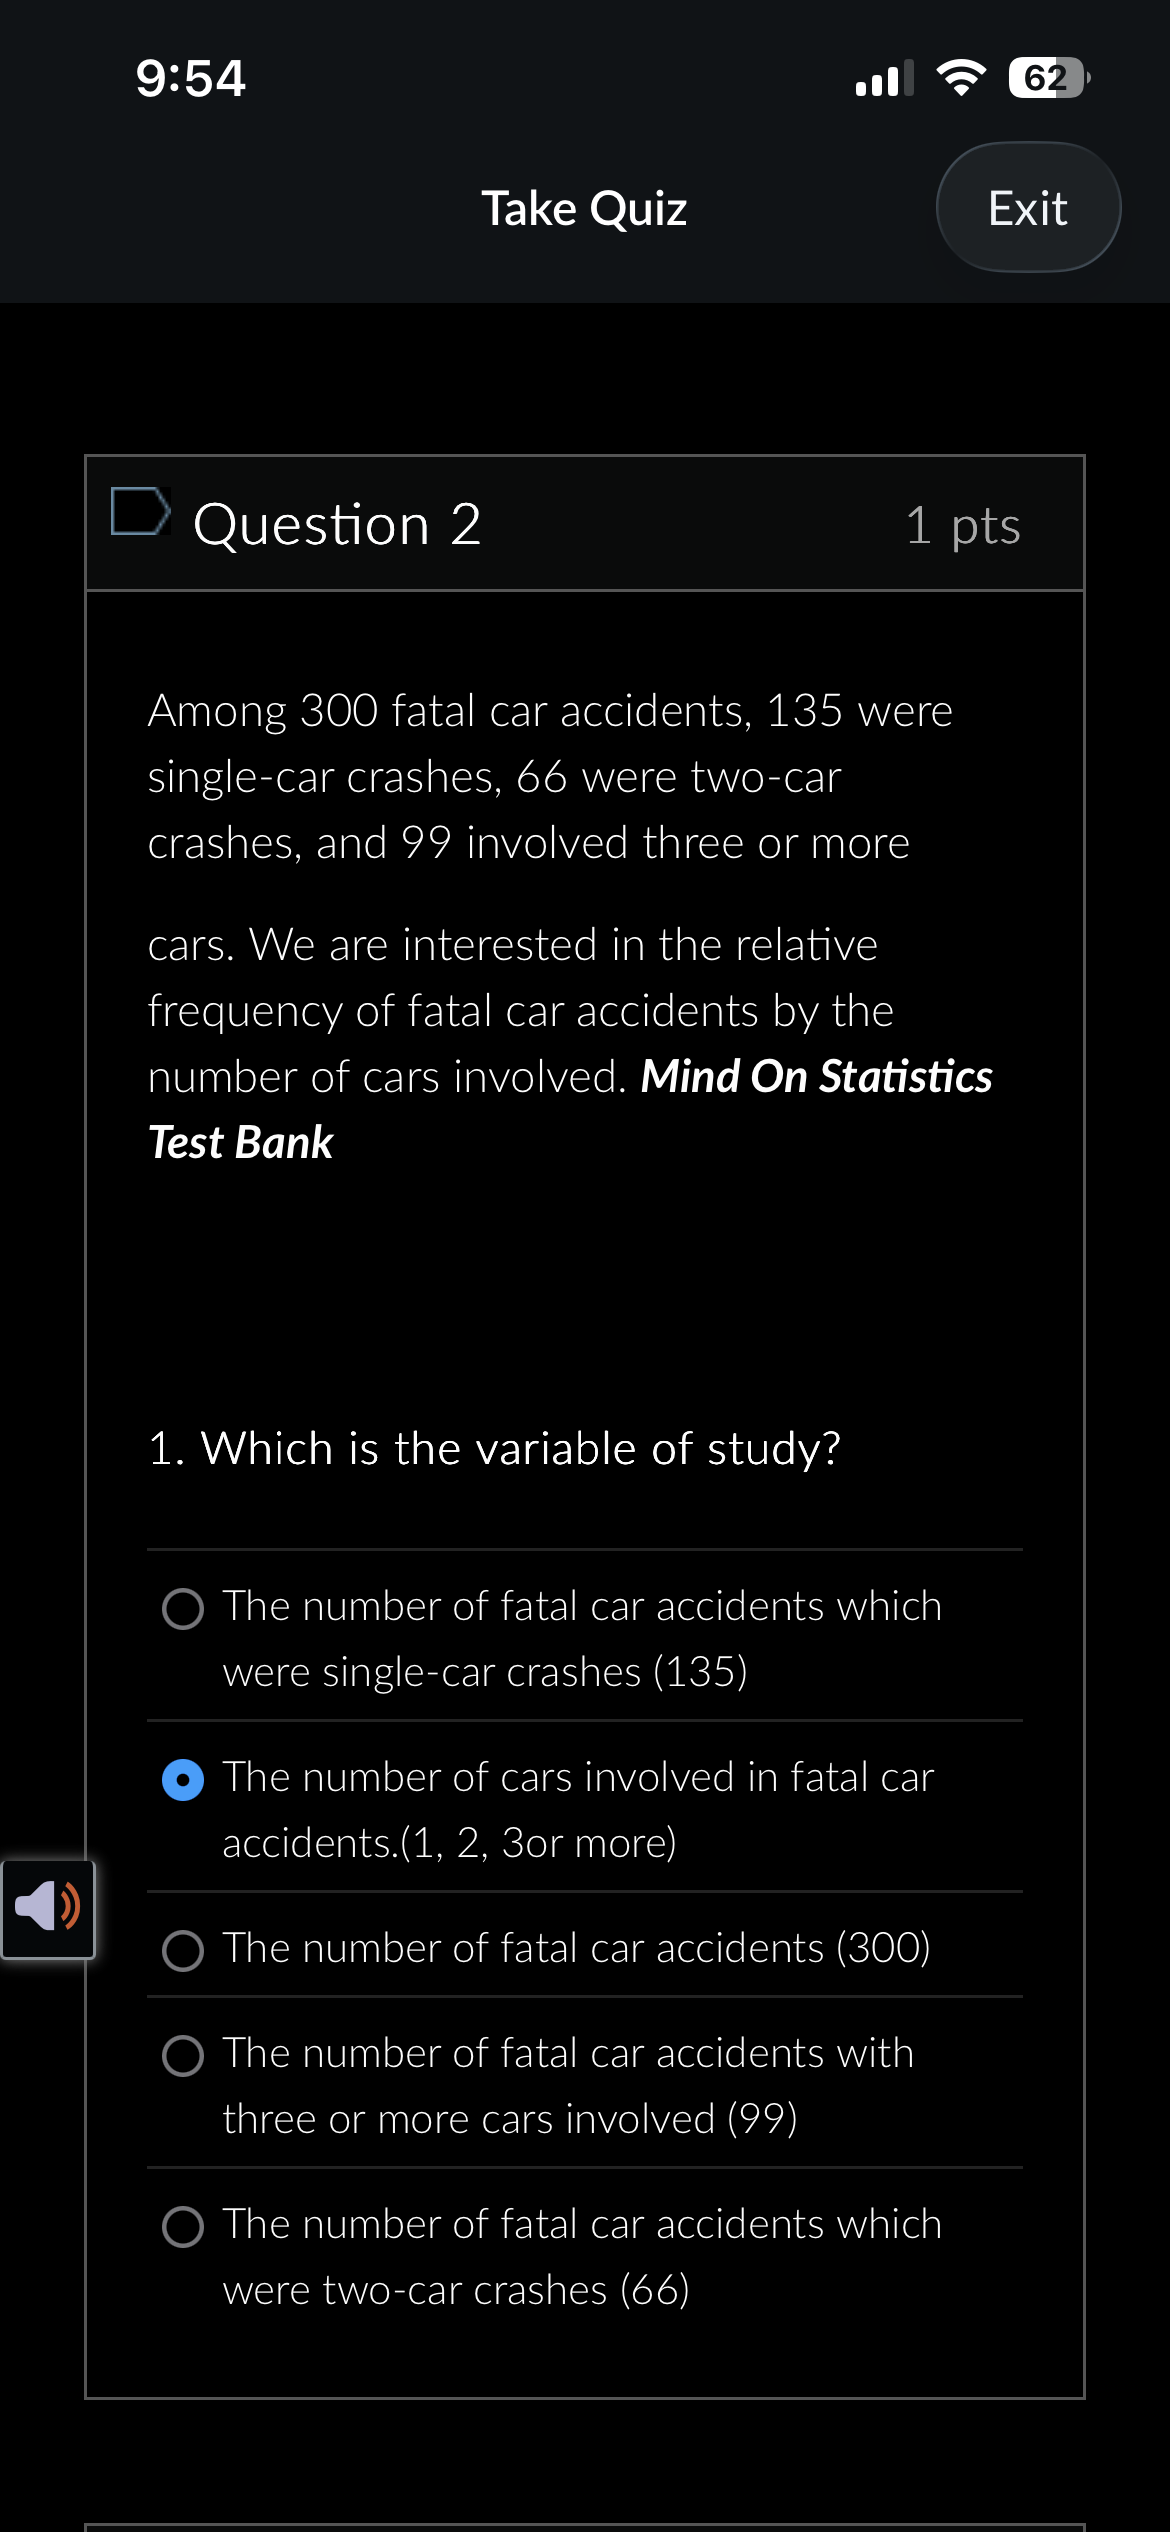
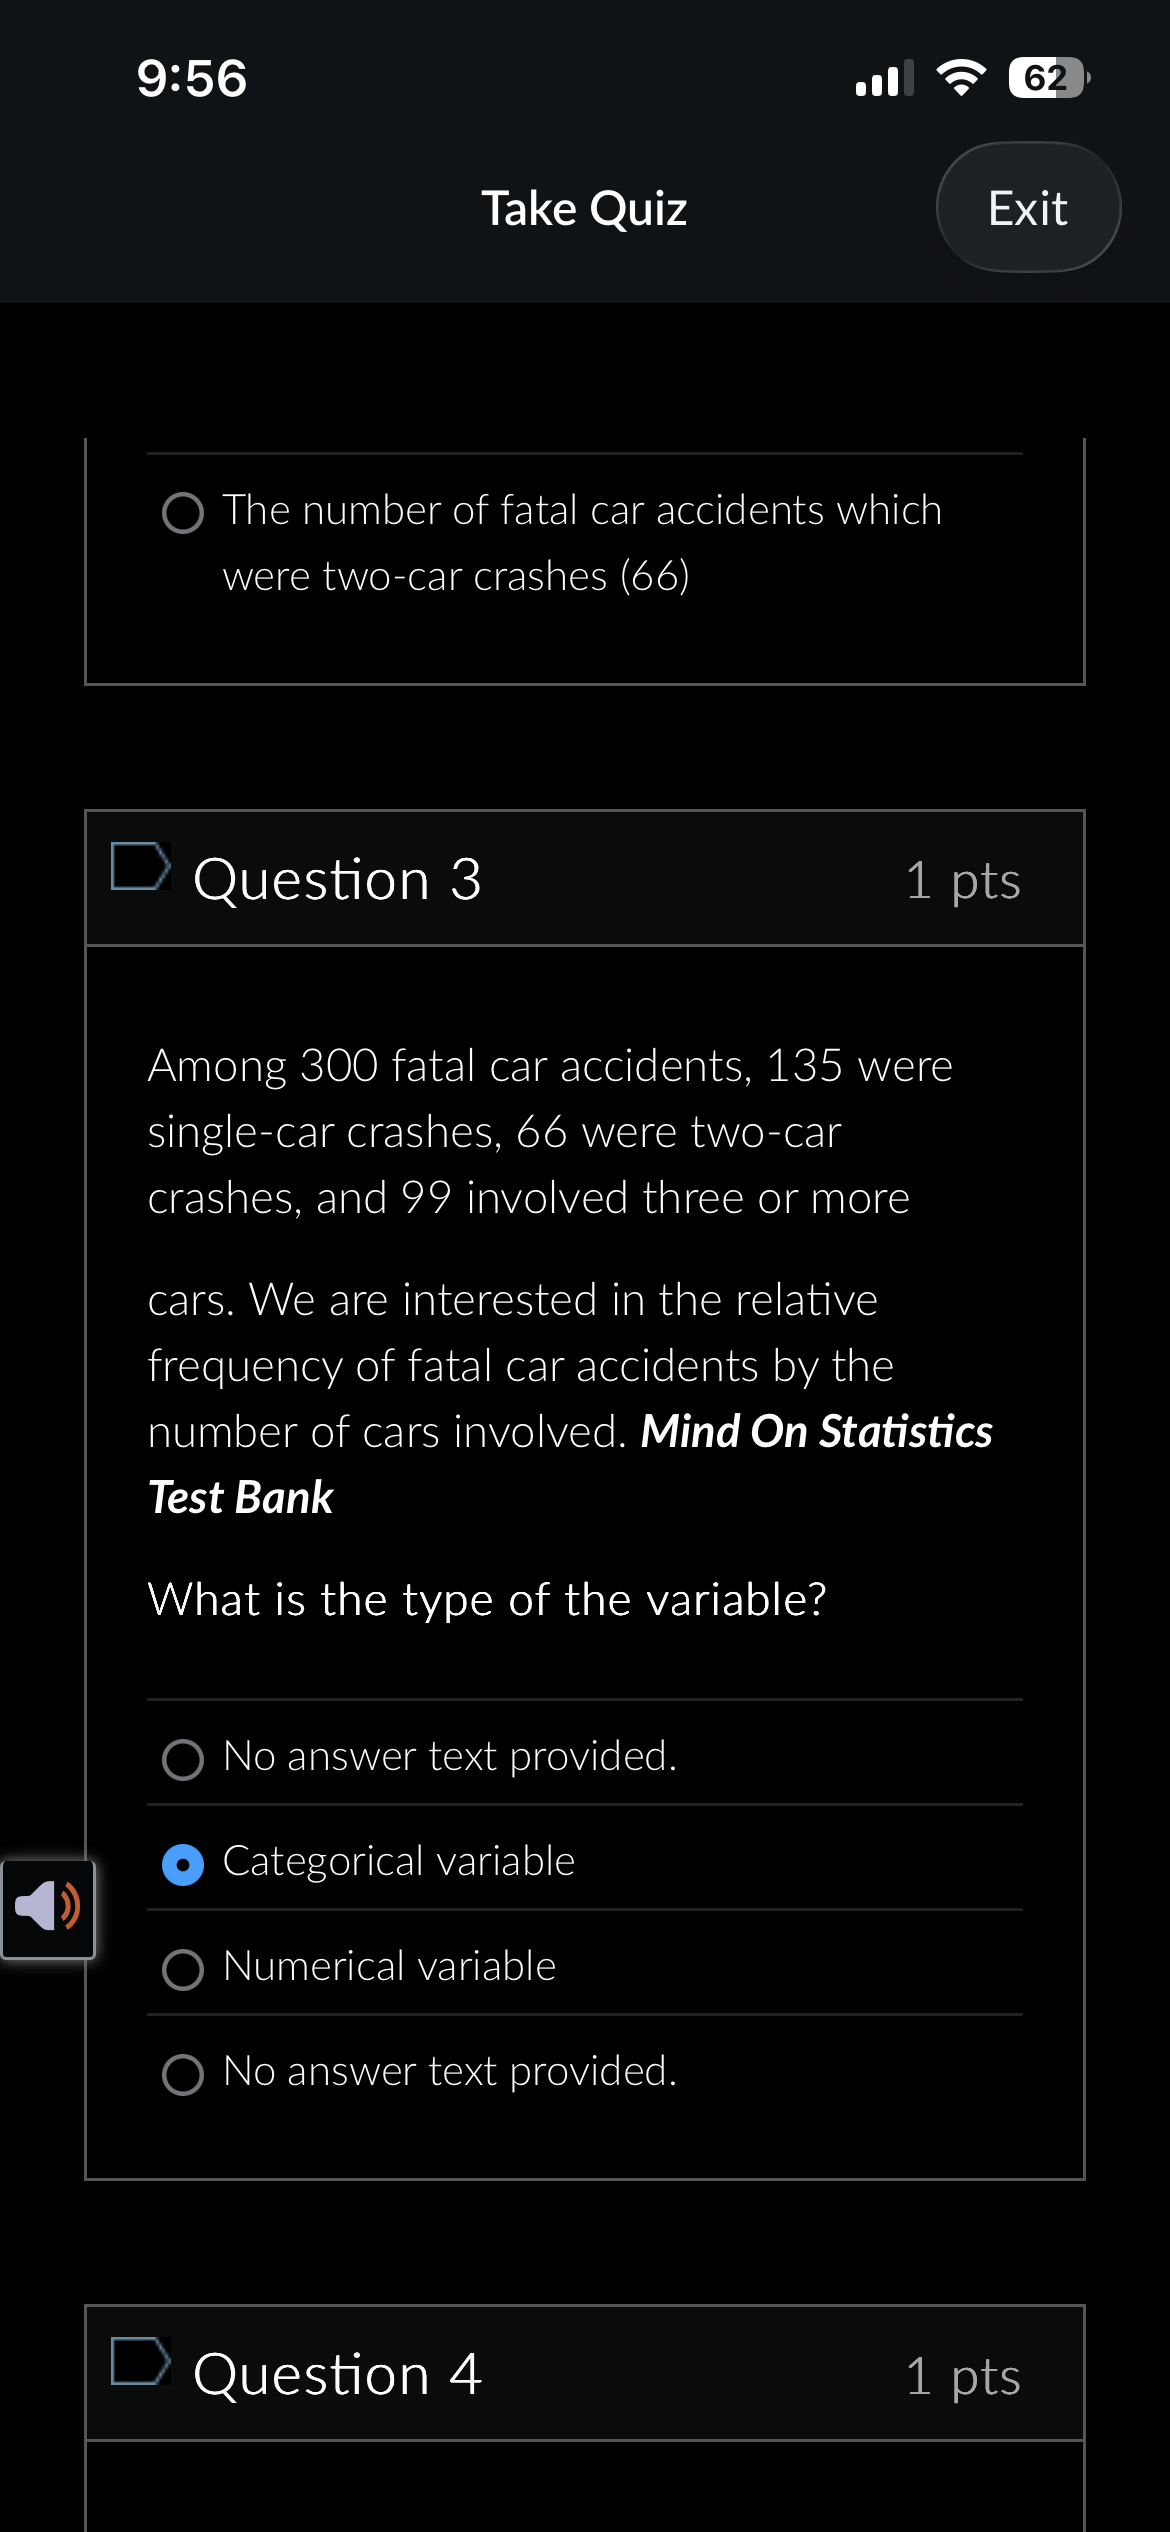
3 or more, not specific
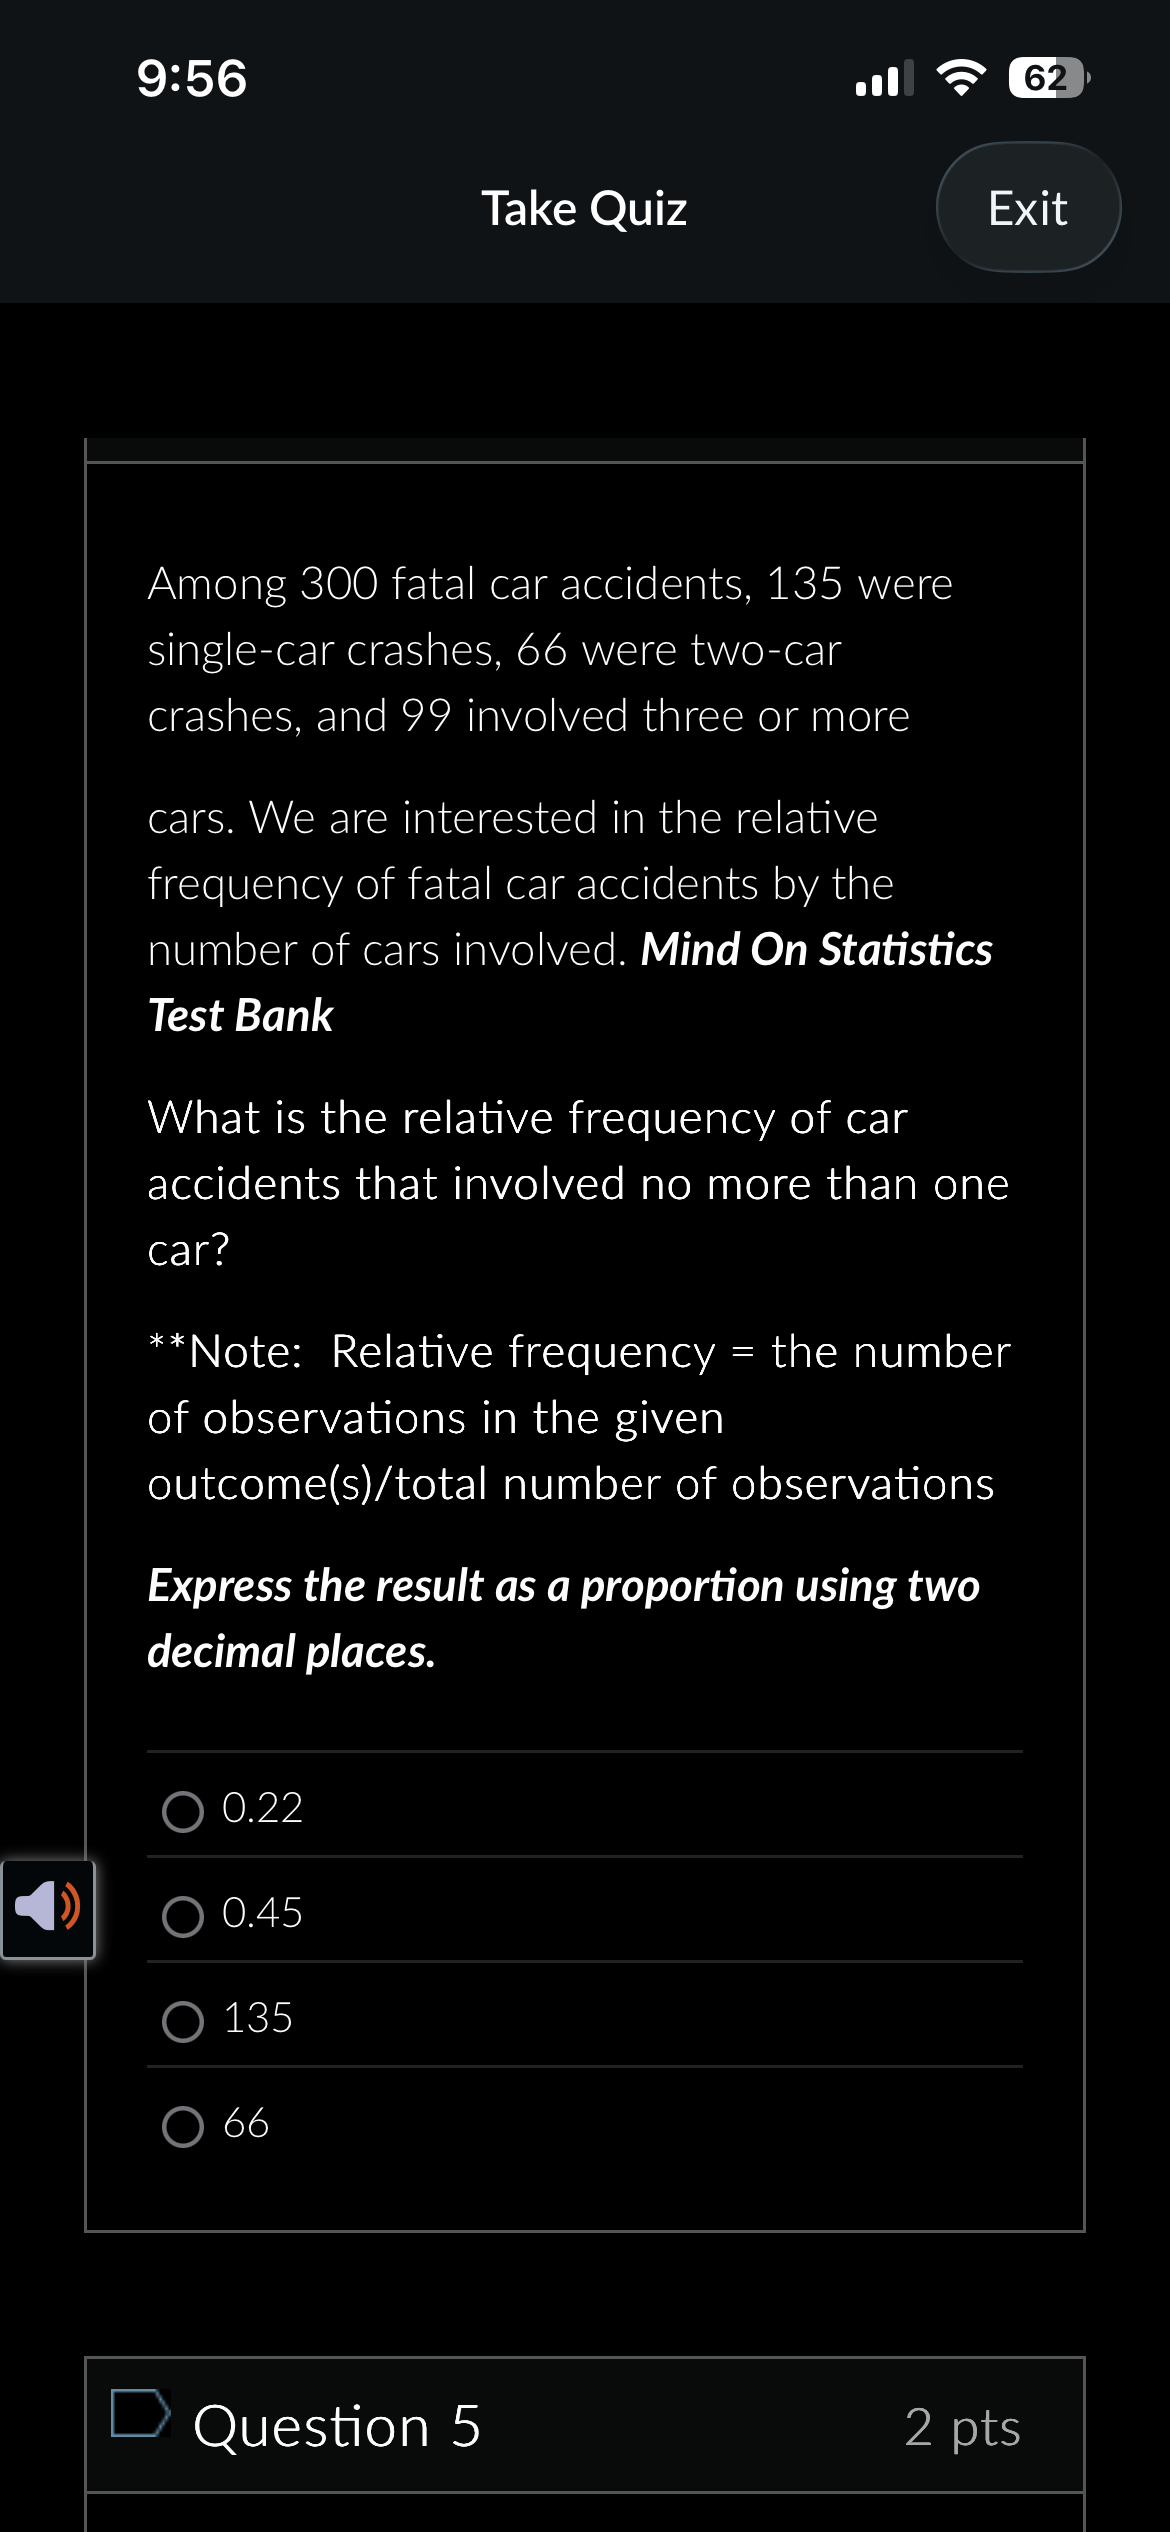


matrix tables count each event as a scene, row
each crash is a scene
frequency table
a descriptive table summarizing the number of occurrences for each outcome within the sample
row=types of occurrences
not specific scenes