Weather and Climate
1/45
There's no tags or description
Looks like no tags are added yet.
Name | Mastery | Learn | Test | Matching | Spaced |
|---|
No study sessions yet.
46 Terms
Polar
the region between 66.5 degrees north and south latitudes and the poles; cool summers and extremely cold winters; low rainfall
Example.
Antarctica
Thunderstorm
Cloudy, rainy conditions with high winds, thunder and lightning.
Anemometer
tool used to measure wind speed
Cold Fronts
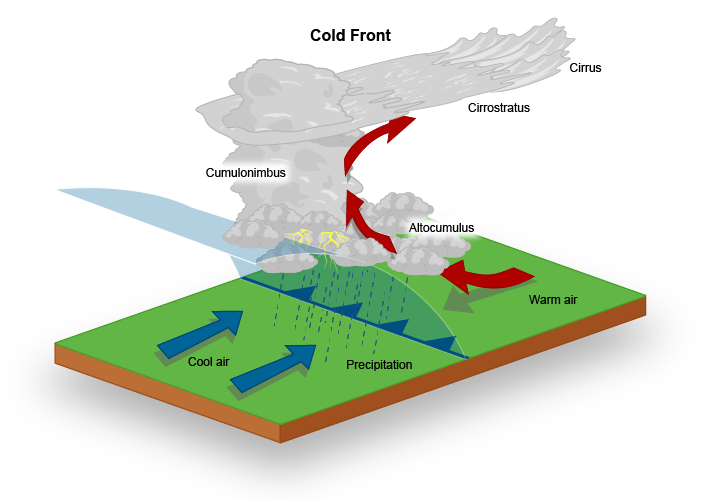
boundaries of an advancing mass of cold air; signified on a weather map by a blue line with blue triangles
Latitude
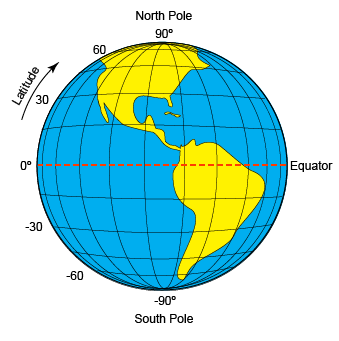
The horizontal lines of the grid system that measure distance above and below the Equator
Sleet
Partially solid water that falls to the earth as water and ice pellets.
Synoptic Chart
a weather map which includes pressure patterns, fronts, wind direction, and speed
Humidity
a measure of the amount of water vapor in the air
Temperate Zones
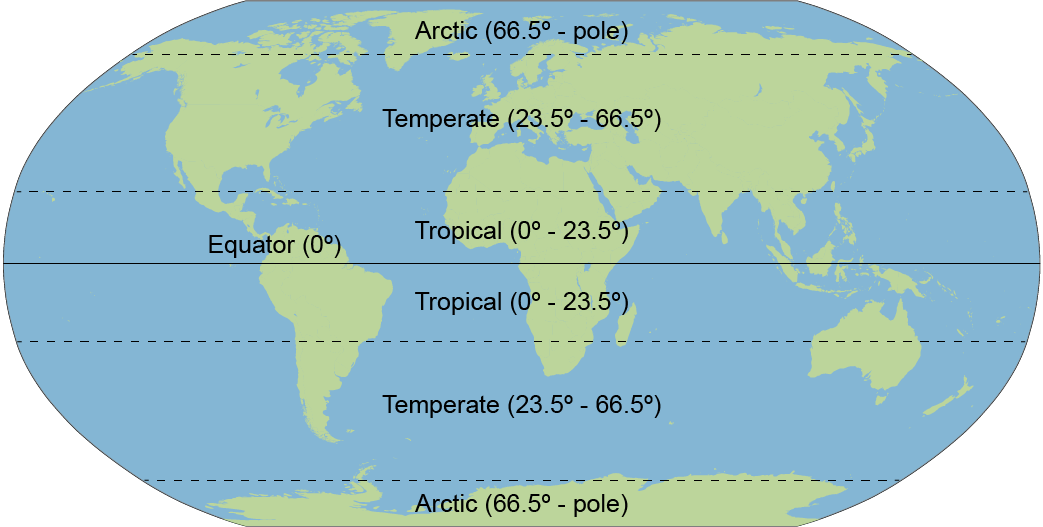
The areas between the Tropics of Cancer and Capricorn(23.5 degrees N and S) and the Arctic and Antarctic Circles (66.5 degrees N and S)
Example.
Pampas
Stationary Fronts

Fronts that forms when a cold air mass and a warm air mass meet; brings lingering precipitation
Thermometer
tool used to measure temperature; measures in degrees Fahrenheit or Celsius
Example.
"Room temperature" is 20 degrees Celsius
Tropics
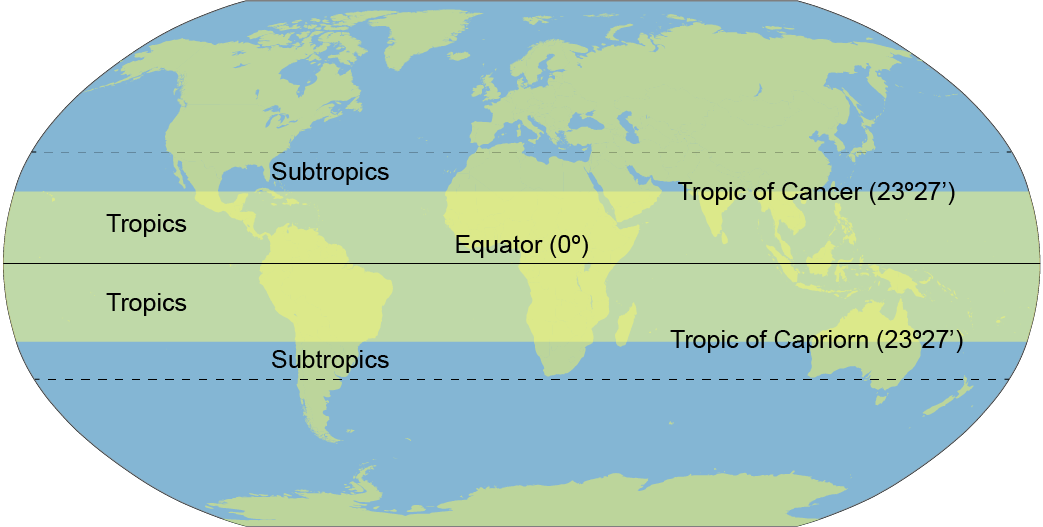
the region between the Tropic of Cancer (23.5 degrees north latitude) and the Tropic of Capricorn (23.5 degrees south latitude); warm temperatures; high rainfall
Example.
Amazon Rainforest
Rain Shadow Effect

the phenomenon in which desert-like conditions appear on the leeward side of a mountain or mountain range.
Example.
Death Valley
Cumulonimbus Clouds
multi-level clouds; impressive, towering appearance; indicate thunderstorms and severe weather
Equator
The center line of latitude around the middle of the Earth that divides the globe into a Northern and Southern hemisphere
Tsunami
An energetic ocean wave in deep water caused by an underwater earthquake, its height increasing as it approaches land.
Wind Sock
tool used to determine the direction of the wind
Rain Gauge
tool used to collect rainfall and measure the amount of precipitation within a certain timeframe;
Computer Forecast Models
a weather model, usually in text or map format, which uses data collected from weather balloons, satellites, ships, aircraft, and weather stations around the world to determine the likelihood of thunderstorm conditions developing
Example.
Global Forecast Model
Warm Fronts

boundaries of an advancing mass of warm air; signified on a weather map by a red line with red semicircles
Climate
a measure of an area's long-term weather patterns
Example.
average temperature range in the Amazon Rainforest is 64 to 73 degrees Fahrenheit
Windward Side
the side of a mountain facing the incoming wind
Isobars
Term definition.
lines on a weather map connecting two areas of similar barometric pressure
Levee
A wall that keeps water from flooding an area; often built of rock, dirt or sand.
Troughs (on a Weather Map)
areas where air is turbulent and unstable; signified on a weather map by a black line
Hail
large chunks of ice that fall to the earth during severe weather
Weather Radar
tool used to determine the amount and type of precipitation over a certain area using radio waves
Hygrometer / Psychrometer
tool used to measure humidity in the air
Orographic Lift
A redirection of wind when it is forced upward to travel over the top of the mountain and then down the other side
Specific Heat Capacity
the amount of heat needed to raise the temperature of 1 mass unit of the material by 1 degree
Example.
water has a specific heat capacity of 1 calorie per gram
Air Pressure / Atmospheric Pressure
the force exerted on an area due to the weight of the air in the atmosphere above
Leeward Side
the side of the mountain facing opposite from the incoming wind
Occluded Fronts
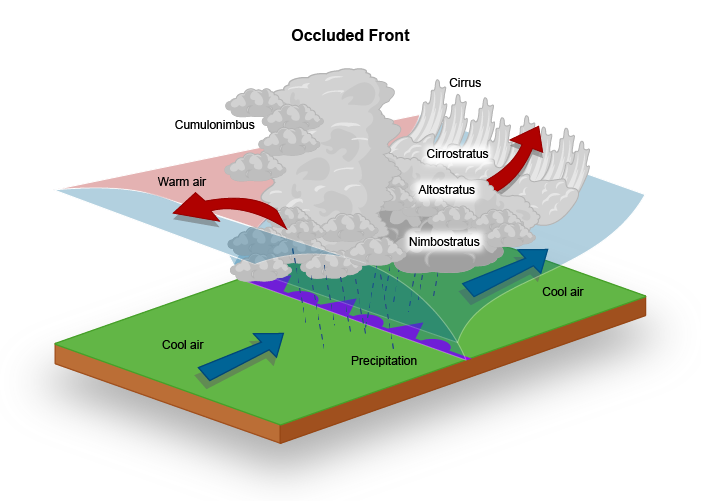
When a warm air mass gets stuck between two cold air masses and lifted away from the Earth's surface. Causes dropping temperatures and rain; signified on a weather map by purple lines with purple triangles and semicircles next to each other.
Snow
Solid water crystals that fall to the earth as snowflakes.
Weather Balloon
tool used to collect atmospheric data from a point high above the ground; the balloon is filled with helium or hydrogen and carries an attached probe into the atmosphere until the balloon bursts, dropping the probe
Blizzard
Heavily falling or blowing snow that causes snowdrifts and makes it difficult to see.
Volcanic Winter
a period of time in which global temperatures are lowered due to a severe volcanic eruption spewing ash and other products into the atmosphere; these products block some of the sun's rays from reaching Earth's surface and consequently lower temperatures
Lightning
a huge electrical spark within clouds, between clouds, or between the ground and clouds
Ensemble Forecast Models
a weather model which uses several models at one time in order to determine the models’ validity; if all the models predict the same weather conditions, they are likely correct
Example.
European Centre for Medium-Range Weather Forecasts uses Ensemble forecasting
Barometer
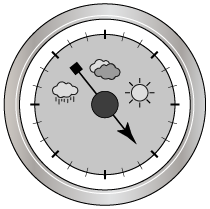
tool used to measure atmospheric pressure
higher pressure indicates lower temperatures and less precipitation
measures in atmospheres (atm) or millimeters of mercury (mm Hg)
Example.
Wildfire
An uncontrolled fire that destroys plants, animals, and habitats over a large region.
Hurricane
A huge rotating storm system that forms over warm ocean water, causing severe wind, rain, storm surges and tornadoes when it reaches land.
Tornado
Rotating air from a thunderstorm that produces high wind speeds; typically lasting only 5 - 10 minutes.
Coriolis Effect
A curving of the flow of wind or water caused by Earth's rotation; to the right in the northern hemisphere, to the left in the southern hemisphere.
Weather
a measure of an area's short-term atmospheric conditions
Example.
70% chance of rain with a high of 80 degrees today
Artificial Satellites
devices in Earth's orbit which collect weather data and allow scientists to quickly monitor atmospheric conditions
Example.
weather satelite