Engineering Data Analysis
 Call Kai
 Learn
Learn Practice Test
 Spaced Repetition
 Match
Match Flashcards
 Knowt Play
1/136

There's no tags or description
Looks like no tags are added yet.
Name | Mastery | Learn | Test | Matching | Spaced | Call with Kai | Chat |
|---|
No analytics yet
Send a link to your students to track their progress
137 Terms
STATISTICS
It involves the methods of collecting, processing. analyzing, and summarizing data in order to provide answers or solutions to an inquiry.
It is defined as a science that studies data to be able to make a decision.
DESCRIPTIVE STATISTICS
Describe what is there in our data
DESCRIPTIVE STATISTICS
Make inferences from our data to more general conditions
DATA
It is a collection of facts from experiments, observations, sample surveys and censuses, and administrative reporting systems
QUALITATIVE
categorical data
labels
cannot be measured
QUANTITATIVE
numerical data
can be measured
Nominal Data
unordered categories
Ordinal Data
ordered categories
Discrete Data
whole numerical value (countable)
cannot be broken down to smaller parts
ex. population
Continuous Data
can take any value within range
can be broken down to smaller parts
ex. time
UNIVERSE
It is the collection or set of units or entities from whom we got the data.
VARIABLE
It is a characteristic that is observable or measurable in every unit of the universe.
POPULATION
The set of all possible values of a variable
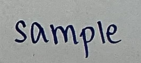
SAMPLE
A subgroup of a universe or of a population is a sample.
Slovin’s Formula
To solve how many samples needed
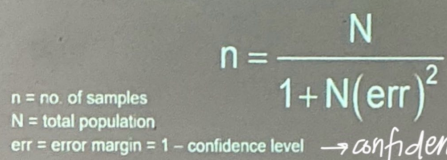
err (margin of error)
= 1 - confidence level
If not stated: 5% = 0.05
probability for committing mistakes
probability for the research to be in erroe
Confidence level
If not stated: 95% = 0.95
Confidence that the research is correct
the margin of error decreases
As the sample increases
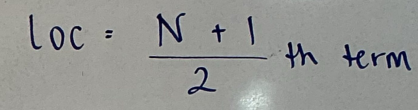
location
Location of Median
Median
The middle value when the data is arranged in ascending or descending order.
Mode
The value(s) that occur most frequently
Mean
The average-sum of all values divided by the number of values
MEASURE OF CENTRAL TENDENCY
Values that describe the center or typical value of a dataset.
MEASURE OF LOCATION
Values that describe the relative position of an observation within the dataset.
PERCENTILE
Values that divide the ordered dataset into 100 equal parts.
QUARTILES
Values that divide the ordered dataset into 4 equal parts.
DECILES
Values that divide the ordered dataset into 10 equal parts.
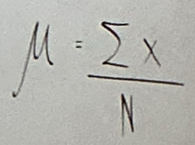
Population Mean
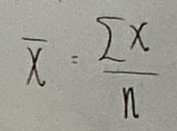
Sample Mean
MEASURE OF VARIATION
Values that describe the variability or spread of a dataset.
RANGE
Difference between the maximum and minimum values,
Sensitive to extreme values.
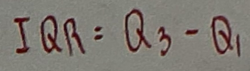
INTERQUARTILE RANGE (IQR) / midspread
Measure the middle 50% of data
calculated by subtracting the first quartile from the third quartile, making it robust against outliers.
VARIANCE
Average of the squared deviations from the mean
measures how far values are spread.
STANDARD DEVIATION / Effective Variance
The square root of variance
Typical distance of values from the mean
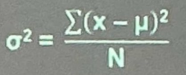
Population Variance
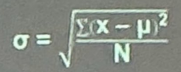
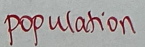
Population Standard Deviation
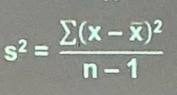
Sample Variance
Sample Standard Deviation
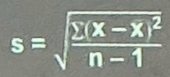
Caltech for mean, population SD, sample SD
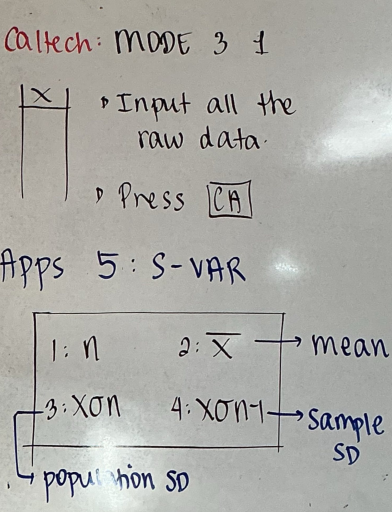
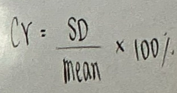
Coefficient of variation (CV)
Tells how much the data varies relative to its mean.
P75
3rd Quartile (Q3) in Percentile
P25
1st Quartile (Q1) in Percentile
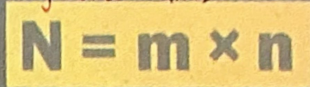
1st FUNDAMENTAL PRINCIPLE OF COUNTING
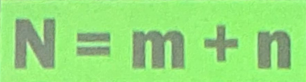
If a thing can be done in m different ways and another thing can be done in n different ways, then the two things can be done one after the other in m times n different ways.
“AND”
2nd FUNDAMENTAL PRINCIPLE OF COUNTING
If a thing can be done in m different ways and another thing can be done in n different ways, then either of these two things can be done in m plus n different ways.
“OR”
PERMUTATION
An ordered arrangement of a finite number of elements, either all of the available n element or of a part of them
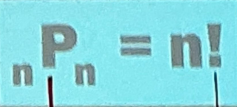
Permutation of n distinct objects taken n at a time:
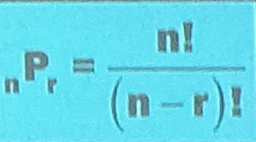
Permutation of n distinct objects taken r at a time
Permutation of repeated objects
When some objects are identical, swapping identical objects does not create a new arrangement.
To avoid counting duplicates, divide by the factorial of the number of identical objects.
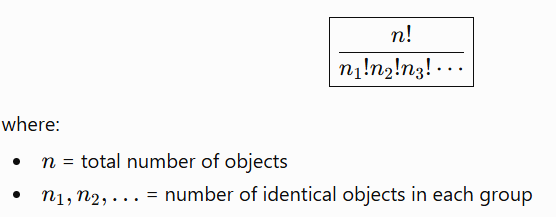
Permutations with grouped objects or permutations with objects required to stay together
*like chain rule
get the # of ways of the groups then multiply with # of ways within a group
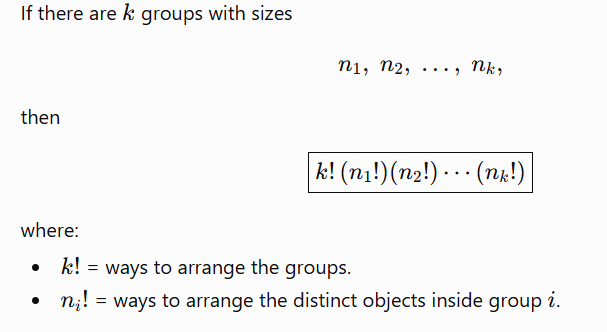
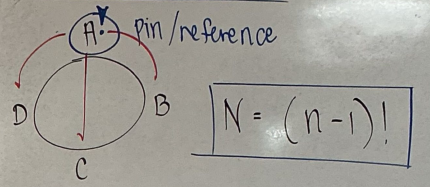
Cyclic Permutation
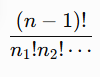
denominator is the repeated objects
Circular arrangement with identical objects
Treat each group as one block, use (number of blocks−1)!, then multiply by the internal arrangements of each block
Circular arrangement with grouped objects

Necklace/bracelet (rotations and reflections considered the same)
COMBINATION
A grouping arrangement of all or of any elements of a set regardless of the order.
“Choose”
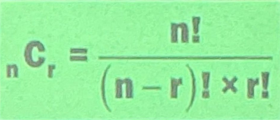
Combination of n distinct objects taken r at a time:
SETS
Any collection of distinct objects.
Ordering of elements are unnecessary.

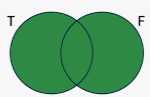
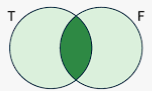
VENN DIAGRAM
Pictorial representation of sets.
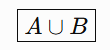
Union
Contains all elements that are in either set or in both sets.

Intersection
Contains only the elements common to both sets
Sample space, S
Universal set
The set of all possible outcome of a random variable
Outcome
Element
The result of a single trial.
Event, E
Set
Collection of 1 or more outcomes
The probability of an event happening is:
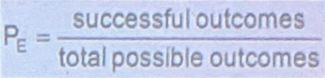
P(S) = 1
Probability of sure event
P (null) = 0
Probability of impossible event
0 < P(A) < 1
Probability of always non-negative event
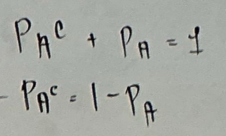
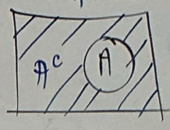
COMPLEMENT OF AN EVENT
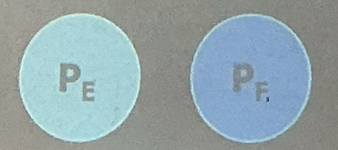
MUTUALLY EXCLUSIVE
[ADDITION RULE “OR”]
Two or more events that can never happen in the same trial
P (A∩B) = 0
![<p>[ADDITION RULE “OR”]<br>Two or more events that can never happen in the same trial<br>P (A<span>∩B) = 0</span></p>](https://assets.knowt.com/user-attachments/ba69f191-07bf-4d52-ad90-43210f75b494.png)
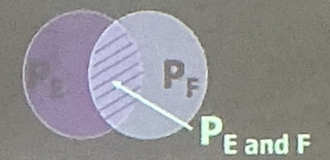
NON-MUTUALLY EXCLUSIVE
[ADDITION RULE “OR”]
Two or more events that can happen in the same trial
![<p>[ADDITION RULE “OR”]<br>Two or more events that can happen in the same trial<br></p>](https://assets.knowt.com/user-attachments/a4031baf-103d-4122-8482-3d97983f58e2.png)
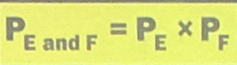
INDEPENDENT
[MULTIPLICATION RULE “AND”]
An event is independent if the outcome of one trial has no effect on the outcome of any other trial.
![<p>[MULTIPLICATION RULE “AND”]<br>An event is independent if the outcome of one trial has no effect on the outcome of any other trial.</p>](https://assets.knowt.com/user-attachments/5d7d374c-e977-4077-a080-a2db0bb0012b.png)
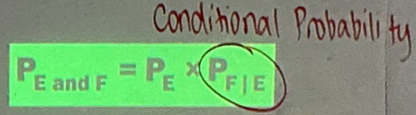
DEPENDENT
[MULTIPLICATION RULE “AND”]
One event has an effect on the outcome of the next event.
Non-mutually exclusive and independent

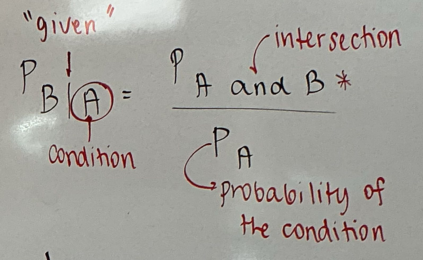
CONDITIONAL PROBABILITY
P(B | A) is the probability of B given that A has occurred.
Since A is known to have occurred, it becomes the new sample space replacing the original.
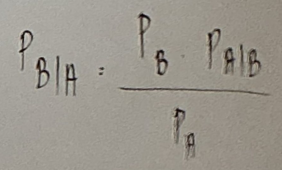
Bayes’ Theorem
a mathematical formula used to calculate the probability of an event based on new evidence or prior knowledge.
It allows you to update your belief in a hypothesis (the "cause") when a related event (the "evidence") occurs.
DISCRETE PROBABILITY DISTRIBUTION
a probability distribution that depicts the occurrence of discrete (individually countable) outcomes, such as 1,2,3… or zero
Mean / average (Expected value) in Discrete Probability
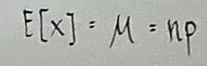
Variance in Discrete Probability
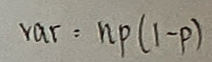
Standard Deviation in Discrete Probability
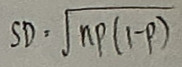
BINOMIAL OR REPEATED TRIALS
There are two possible outcomes of an event, and the possibilities of the outcome are independent and constant.
∴2 outcomes, constant probability for each outcome, trials are independent

for conditions with “at most” or “at least”
[Binomial or repeated trials]
Use summation
![<p>[Binomial or repeated trials]<br>Use summation</p>](https://assets.knowt.com/user-attachments/54344904-dded-4cbd-8bd8-083a06c5d0c8.png)
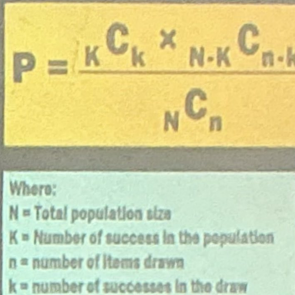
HYPERGEOMETRIC DISTRIBUTION
Describes the probability of getting a specific number of successes in a fixed number of draws, without replacement, from a finite population containing a certain number of successes and failures.
Probability is not given, only number of trials
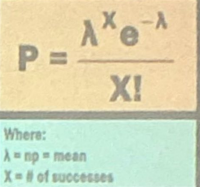
POISSON'S DISTRIBUTION
A limiting case of a Binomial distribution when the number of trials, n, gets very large and p, the probability of success, is small.
↑n = ↓p
Average / mean
λ in formula for Poisson’s Distribution
=np = (number of trials)(probability)
= mean/average value
=variance

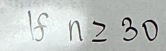
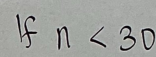
n ≥ 20, number of trials in the mean (Poisson’s Distribution)

n ≥ 100, number of trials in the mean (Poisson’s Distribution)
for conditions with “more than”
[Poisson’s distribution]
Use 1 - summation of less than the specified value
![<p>[Poisson’s distribution]<br>Use 1 - summation of less than the specified value</p>](https://assets.knowt.com/user-attachments/356adcbc-e059-4b94-96f5-1a5576dedbc4.png)
Binomial
Type of Experiment for Repeated Trials with replacement
Hypergeometric
Type of Experiment for drawing without replacement from a finite population
Poisson’s
Type of Experiment for Counts of events in a continuous Interval (e g. time)
Typically large
Population Size for Binomial
Finite and known
Population Size for Hypergeometric
Infinite or undefined
Population Size for Poisson’s
n; number of trials
p; probability of success
Key Parameters for Binomial
N: population size
K: successes in population
n: number drawn
Key parameters for Hypergeometric
What is the probability of k successes in n independent trials, each with the same chance of success?
Quick Intuition for Binomial
What is the probability of k success in n dependent draws from a known group without replacements?
Quick Intuition for Hypergeometric