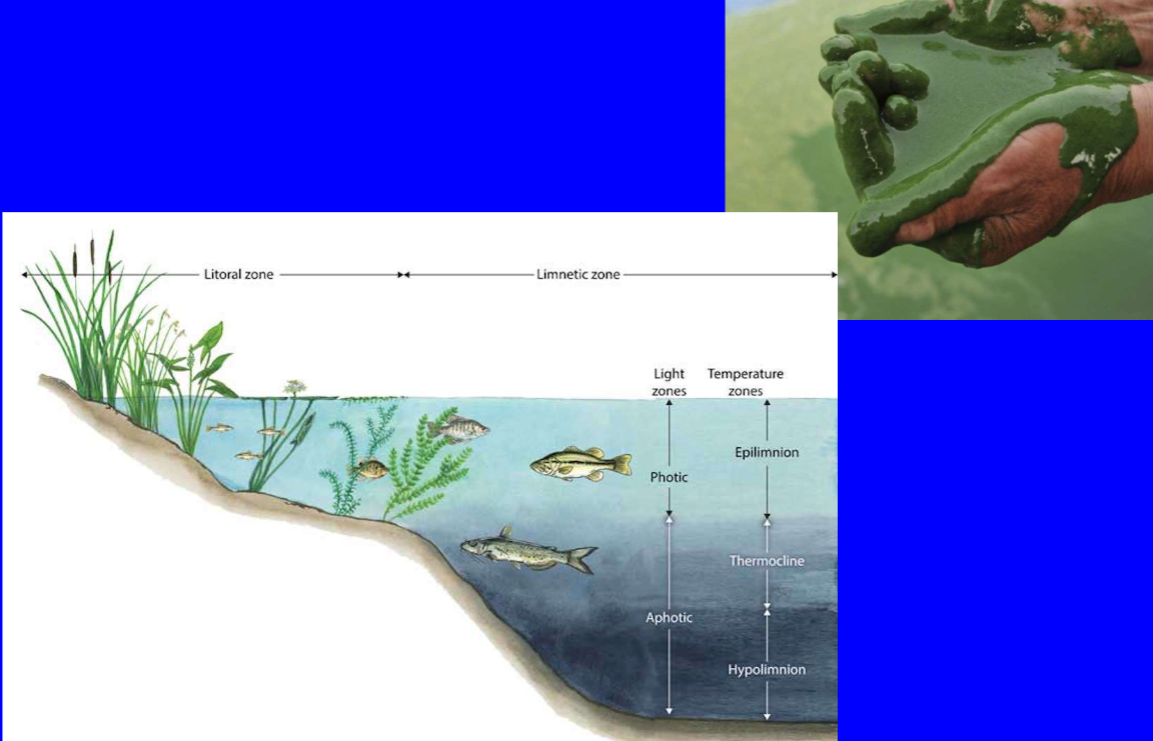
Freshwater ecosystems
1/78
There's no tags or description
Looks like no tags are added yet.
Name | Mastery | Learn | Test | Matching | Spaced | Call with Kai |
|---|
No study sessions yet.
79 Terms
Ideal indicator
Taxonomically sound & easy to identify
Widespread distribution
Numerically abundant
Large body size
Ecological requirements known (autecology)
Narrow ecological demands
What are biological indicators
Organism(s) or attributes of the community which can be used to provide information on:
The state of the environment
Change from ‘normal conditions’
Highlight the pressure causing a change
What are the types of indicators?
Sentinel organisms
Community level indicators
Organism level indicators
Biochemical indicators
Life history responses
Morphological deformities
MACROINVERTEBRATE are a key indicator group
Advantages of Macroinvertebrates in Water Quality Assessment
Wide diversity (species & functional groups) and abundance
Relatively sedentary → occurrence of most can be related to conditions at place of capture
Life cycle of 6 months or longer → provides overview of prevailing physical/chemical conditions
Sampling relatively easy and cheap
They respond to environmental stress → integrate the effects of short-term perturbations.
Disadvantage of using Macroinvertebrates in Water Quality Assessment
Biological expertise needed to identify some groups.
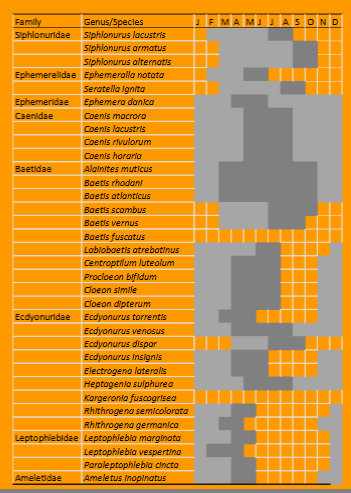
Autecology of various groups needed as absences may be related to habitat or life cycle factors
Macro’s respond to environmental stress
Oxygen depletion
Direct toxicity
Loss of microhabitat
Siltation of habitat
Food availability changes
Competition from other species
Bioassessment using Macroinvertebrates
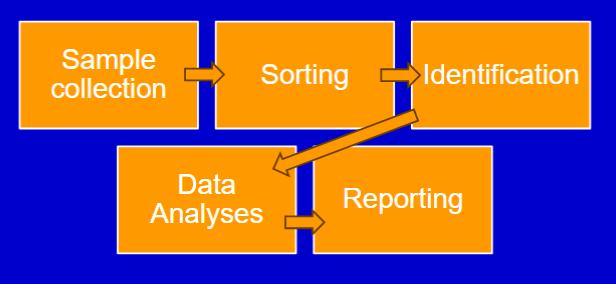
Analyses Measures (Metrics)
Evaluate and express the presence/level of impact
Univariate approach 5 possible categories:
Taxon Richness
Composition Measures
Community diversity & Similarity indices
Functional Feeding Group and other species trait
Biotic Indices
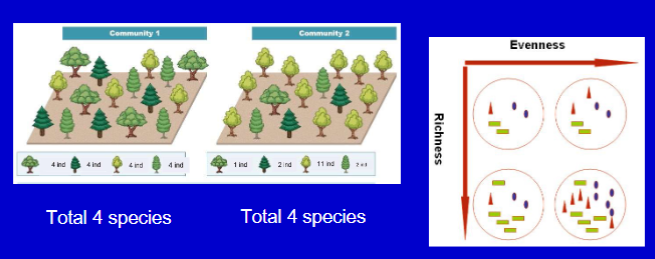
Taxon richness
Measure of the no. of different taxa (group of one or more populations of an organism(s)) present in a community or sample
Community diversity & Similarity indices
Quantitative measure used to determine the degree of resemblance between two or more samples, sets or structures. Often expressed as a percentage or a value between 0 and 1
Functional feeding group
Classification system for organisms (macros especially), based on their primary method of acquiring food rather than their taxonomic group.
Biotic indices
Incorporate info on pollution tolerance/biological tolerance to provide overall measure of water quality (numerical value).
Biotic Index Systems for Macroinvertebrates
Ireland → EPA Q-Value score
UK → BMWP score (Biological monitoring working party) ASPT
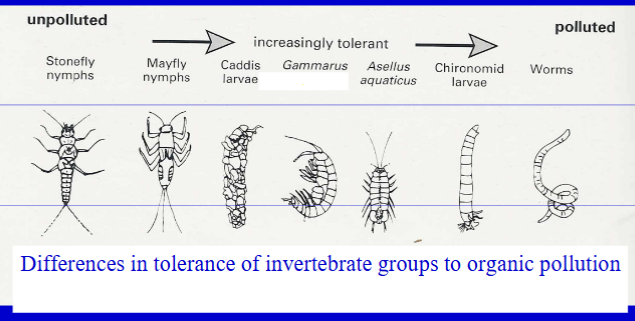
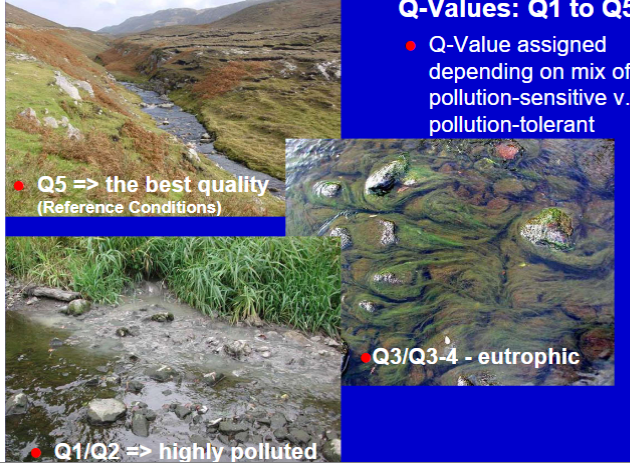
Q-values
Assigned depending on mix of pollution-sensitive vs pollution tolerant
Macro families can be divided into 5 pollution sensitive groups
A. (Highly sensitive),; E (tolerant)
Proportions of the various groups present in the river indicates the prevailing water quality, yields Q-values score from 1 to 5
Sensitive groups A to C
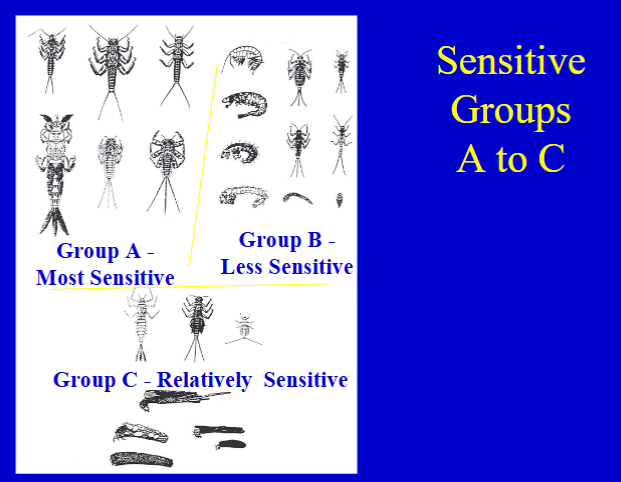
Tolerant Forms (D & E)

What are the threats to freshwater & their biodiversity?
Pollution
Types and extent increasing
Over 1500 contaminants have been found in freshwaters
Top gun: Nutrients, Organic waste, Sediment, Pesticides
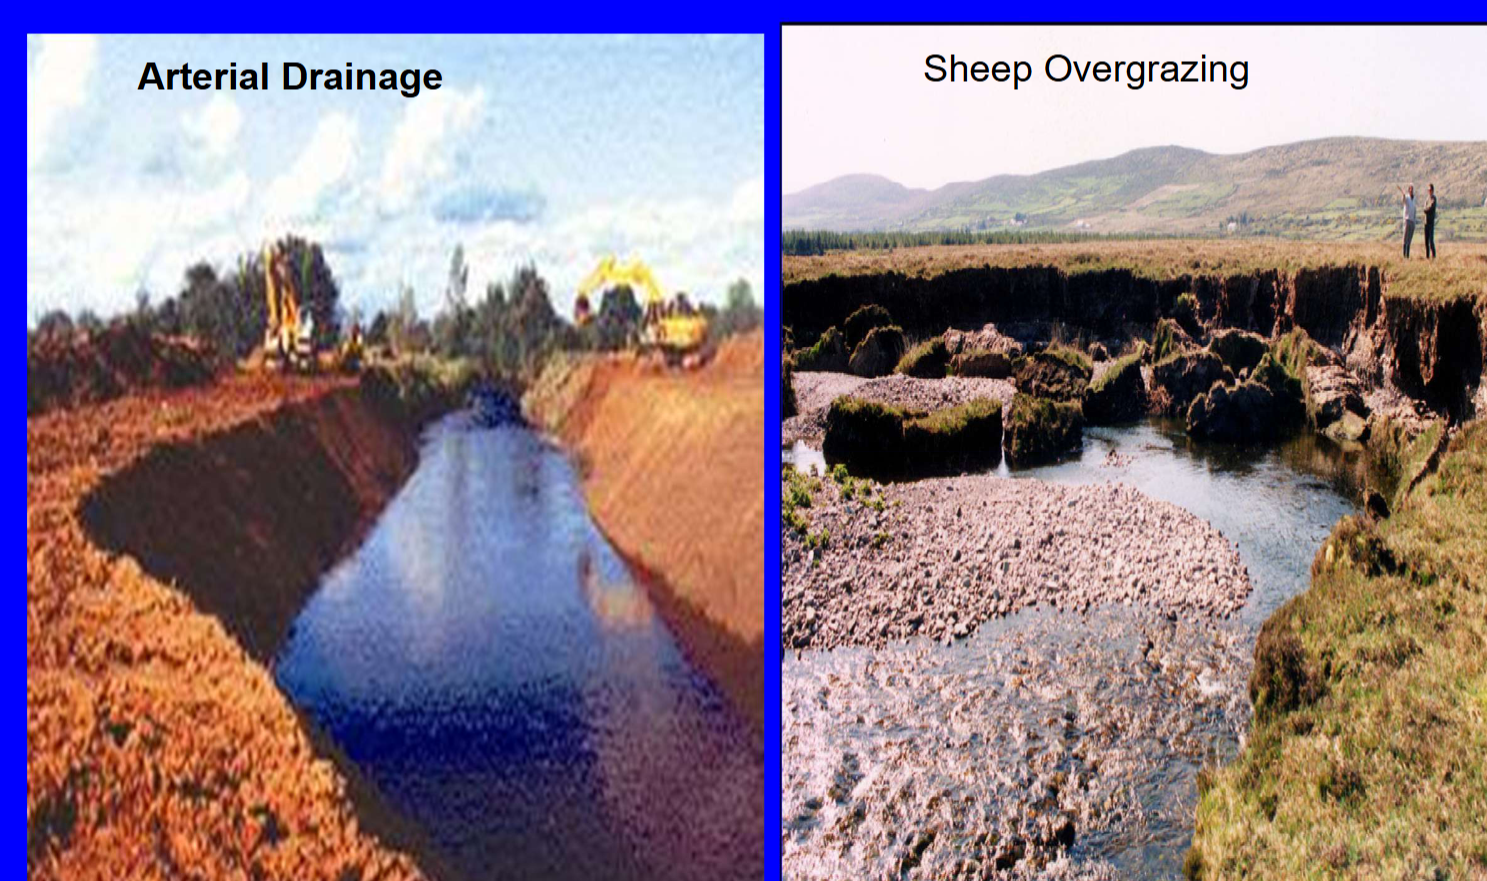
Habitat degradation
Flow modification (dams)
Surface waters have also been drained, straightened, over-abstracted, fragmented
Global wetlands are vanishing three times faster than forests
Overexploitation for water
Overexploitation for organisms (target and bycatch)
Invasive species
New emerging threats (climate change)
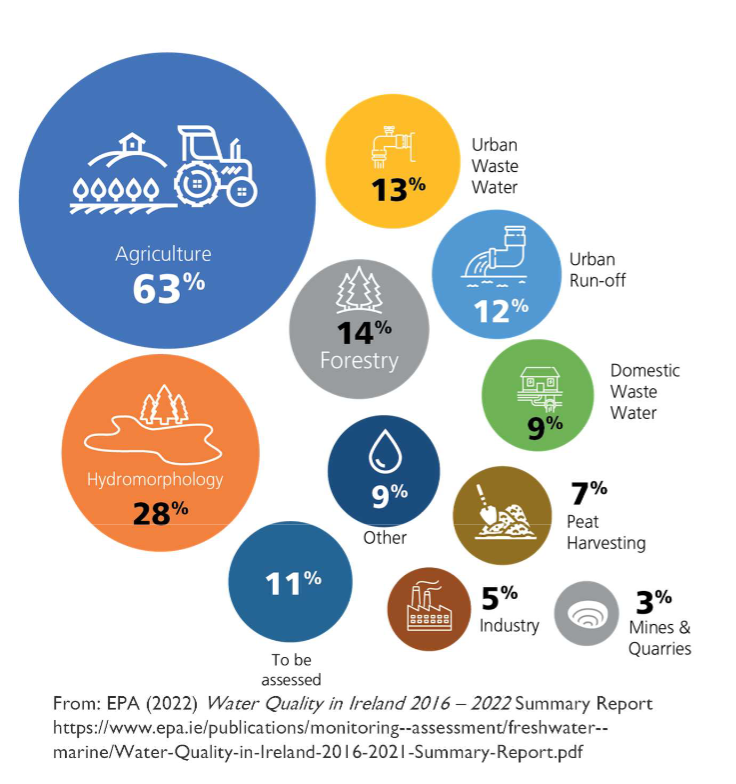
What are the statistics from the reports on water quality within Ireland?
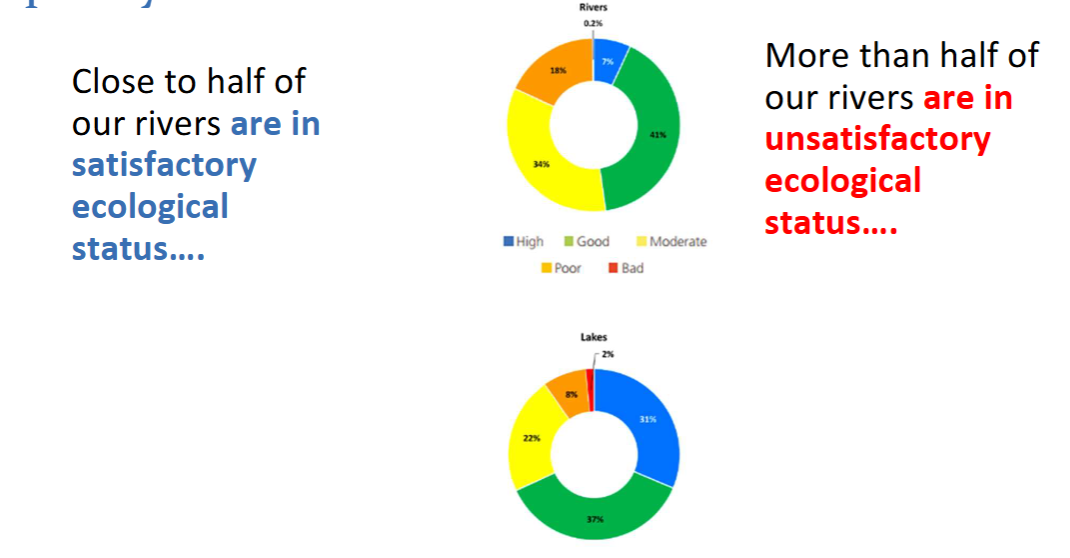
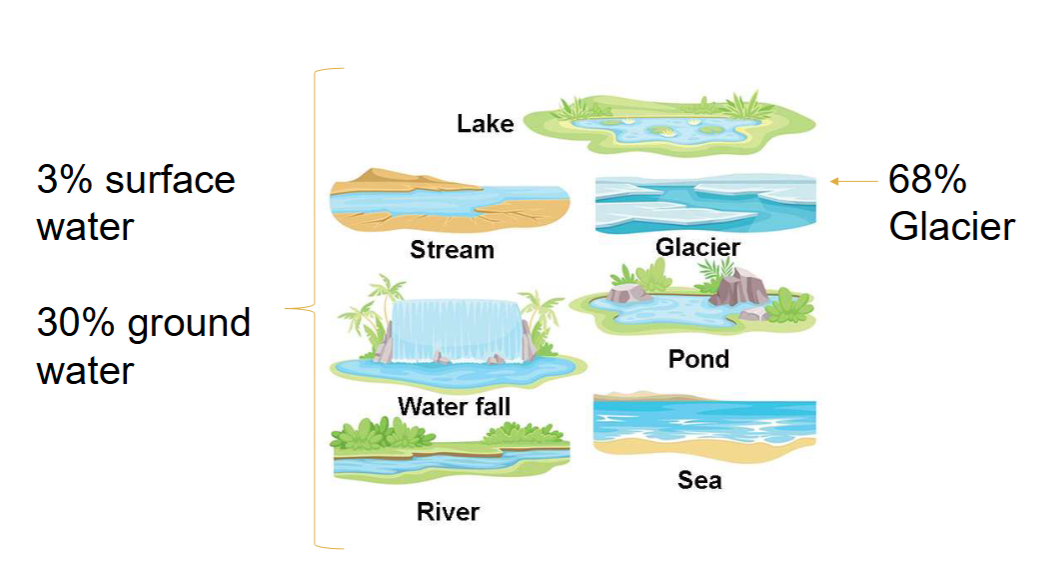
Types of water bodies
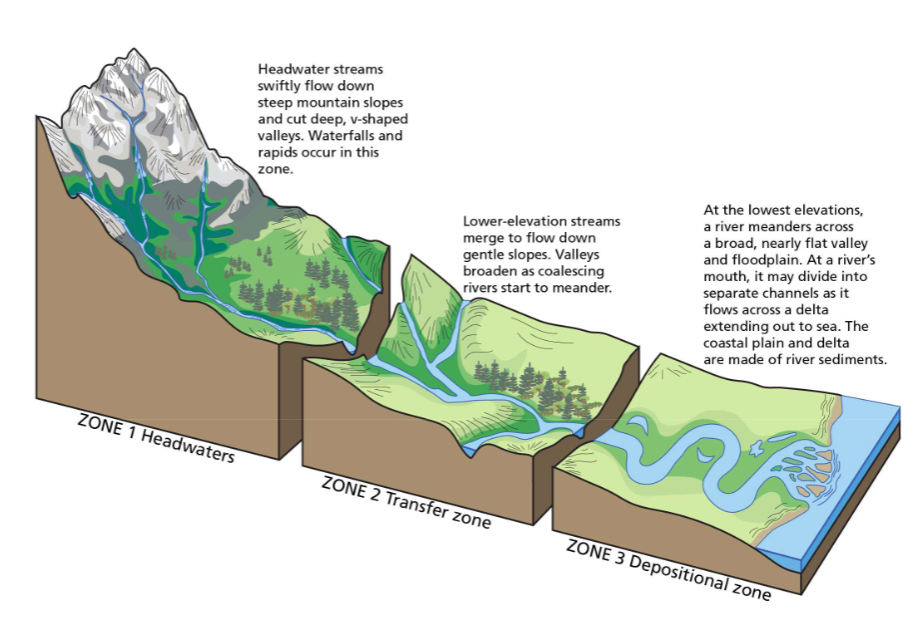
Types of Rivers
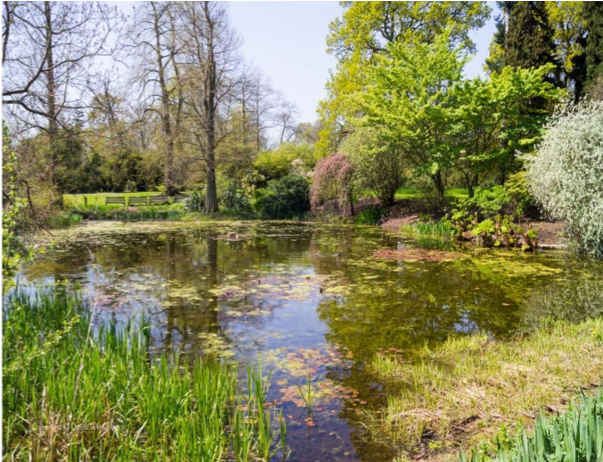
Ponds provide many benefits
Stepping points for biodiversity in highly modified landscapes
Ponds often support greater diversity than other freshwater habitats (lakes/rivers), sustaining many rare and endangered aquatic taxa and act as important refuge in heavily modified landscape.
Contribute to regional biodiversity
Carbon sequestration
Water retention
Amenity & education values
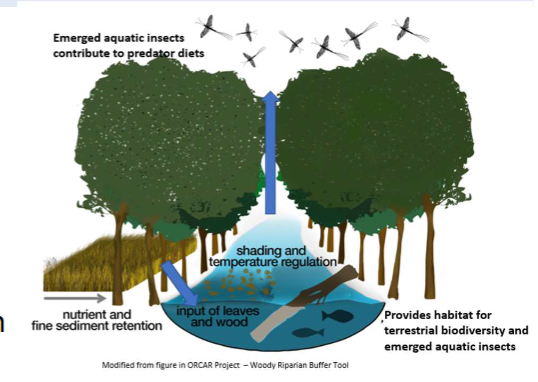
Riparian vegetation provides vital benefits for water quality protection and biodiversity, why?
Important two-way subsidies
Leaf litter fuels aquatic food webs, insects from riparian vegetation are an important diet of salmonids
Emerged adult aquatic insects contribute to terrestrial predator diets (bats, birds and spiders).
Riparian vegetation can attenuate diffuse population and regulate extremes in temperature (climate change pressure)
Degraded or no riparian buffer zones in many catchments in Ireland leave surface waters open receptors for diffuse pollution.
Macroinvertebrates importance (again)
Multiple functions in freshwater from processing leaf litter and detritus, and as prey for fish, other invertebrates, birds and mammals. Also helps maintain clean clear water.
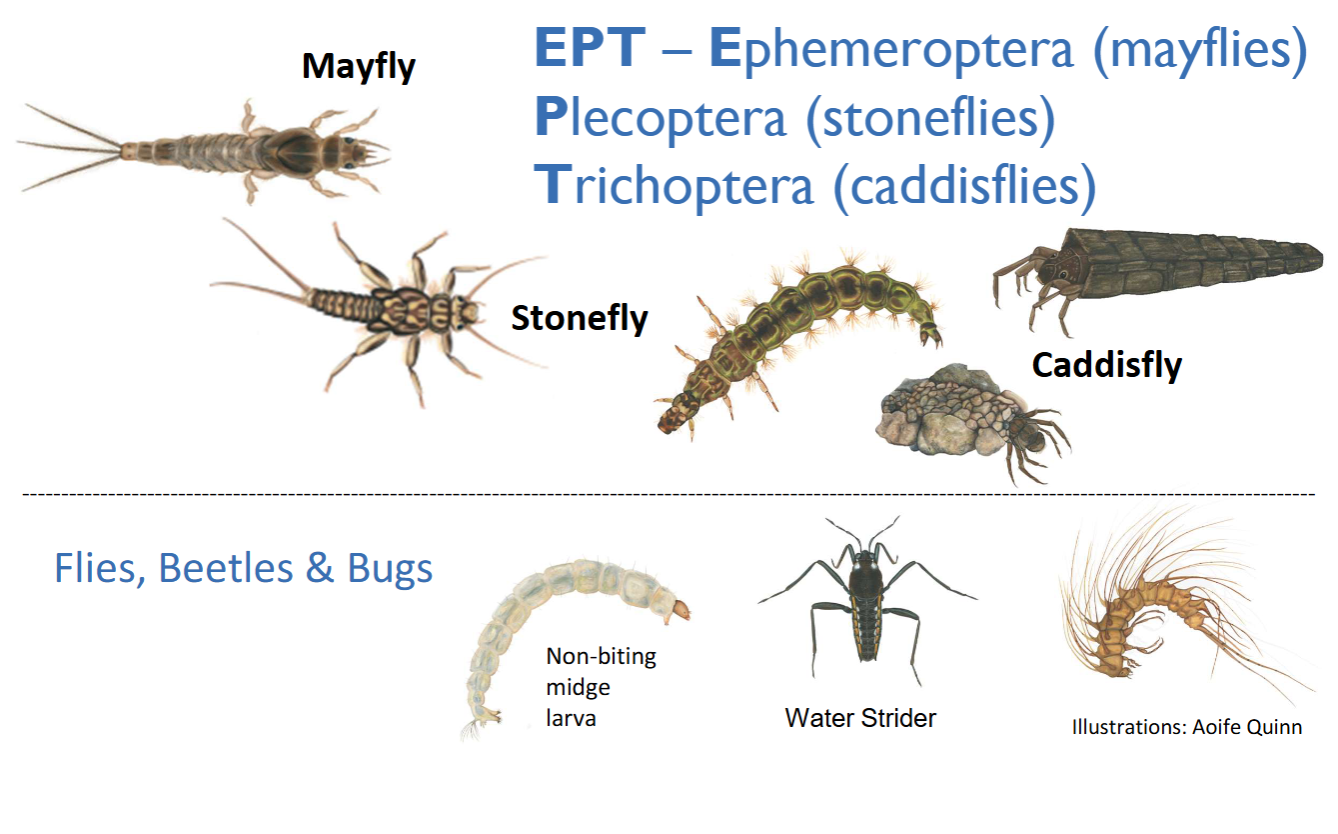
EPT (Ephemeroptera, Plecoptera, Trichoptera)
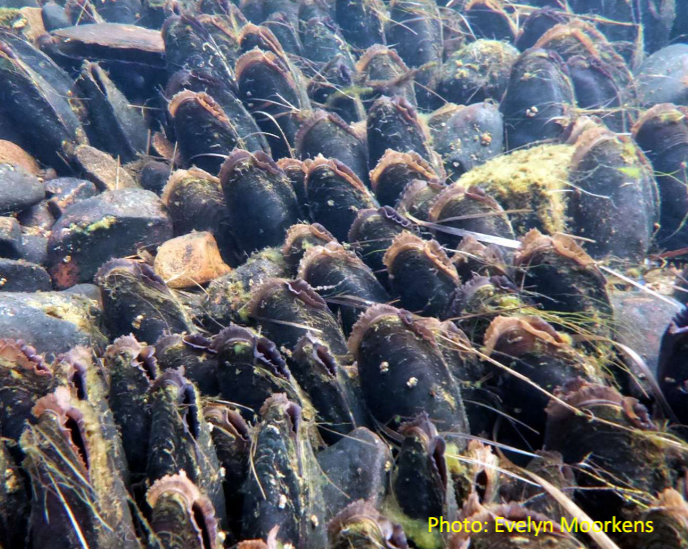
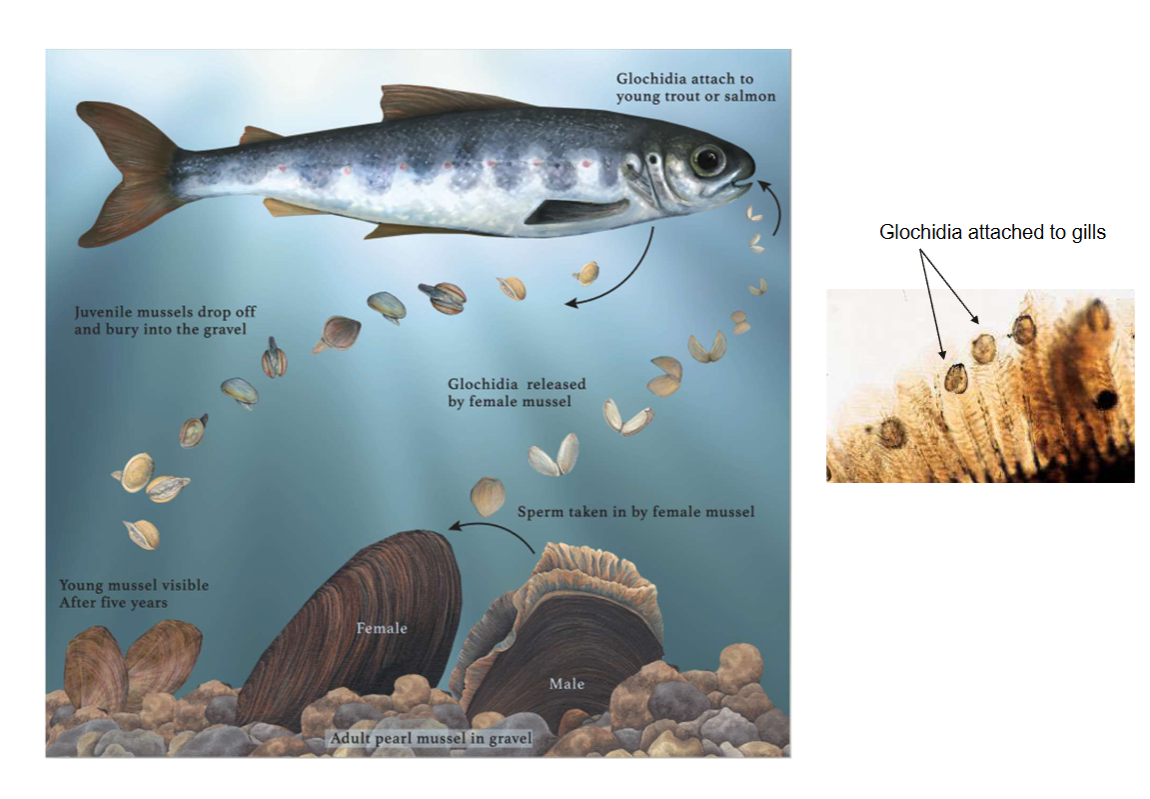
Pearl mussel (special invertebrate) flagship species
Lives up to 120 years in Ireland
Depends on salmonids complete their life cycle
Requires the highest water and habitat quality
Protected under the Habitats Directive
Due to land-use pressures (e.g. drainage, nutrients and fine sediment inputs) pearl mussels are threatened with extinction.
Freshwater anthropogenic problems
Run-off of nutrients, excess sediment and pesticides from agricultural lands and farmyards.
Land drainage, navigational dredging and the presence of barriers such as dams, weirs or culverts in water courses.
Poorly treated sewage from urban wastewater treatment plants, domestic treatment systems and storm water overflows.
Run-off of nutrients and excess sediment from forestry operations
Ireland’s freshwaters are receiving and are being impacted by ‘cocktails’ of multiple stressors (pollutants) delivered along varying pathways often from several sources, requiring the targeting of the right measures in the right place.
The significant pressures impacting Ireland’s freshwaters goes to-
Agriculture is the dominant source of pressure on freshwaters following by hydro-morphology and urban wastewater.
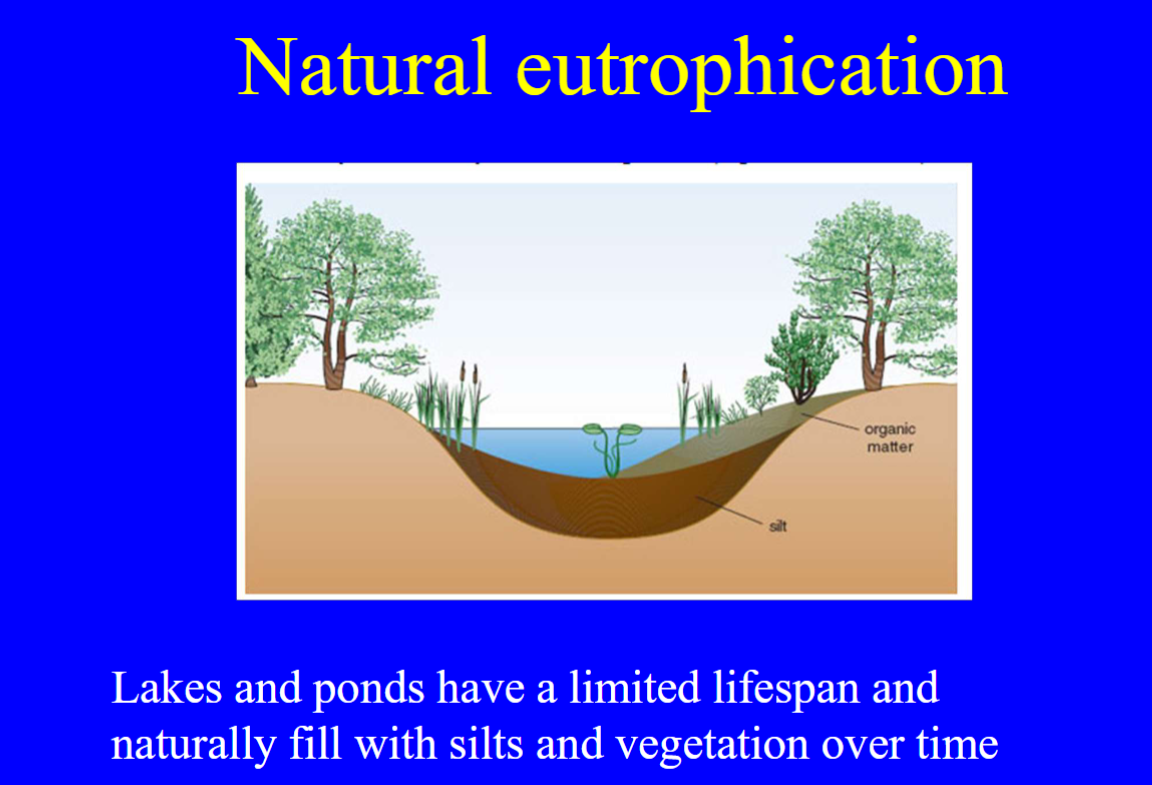
Eutrophication
The biological effects of an increase in the concentrations of nutrient
Caused by the availability of nitrogen and phosphorus, commonly present in soil and water in the form of nitrate and phosphate.
It leads to slight to moderate pollution and failure to meet the goals of the WFD
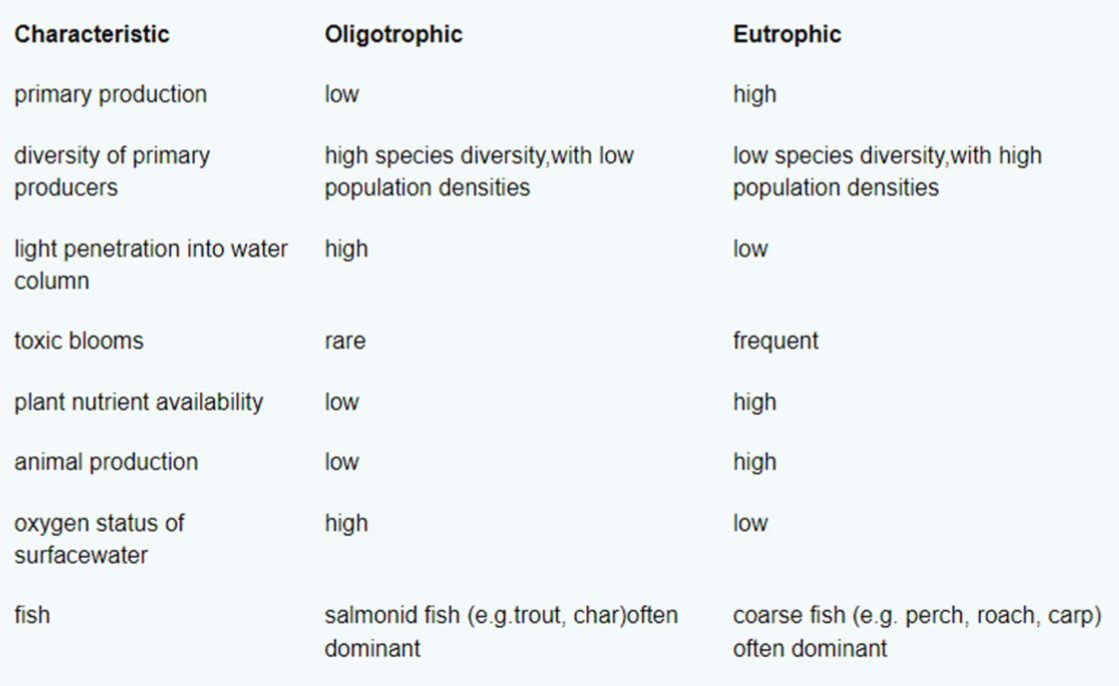
General characteristics of Oligotrophic vs Eutrophic waters
The amount of P required by living organisms is small but it is the most common growth-limiting factor in freshwaters
Little bio-available P released from breakdown of rocks (common component of rocks up to 7%)
Root zone in soils retain much P
Rainwater contains little P
P reaching freshwaters is readily absorbed onto particles → become unavailable
Organisms require small amounts and can store many times their immediate needs
Anthropogenic sources of Phosphorus
Run-off agricultural lands
Forest fertilisation
Tree felling (brash)
Inadequate sewage treatment
Use of detergents and other household P-containing products
Urban areas
Rural dwelling septic tanks
Leachate from dumps
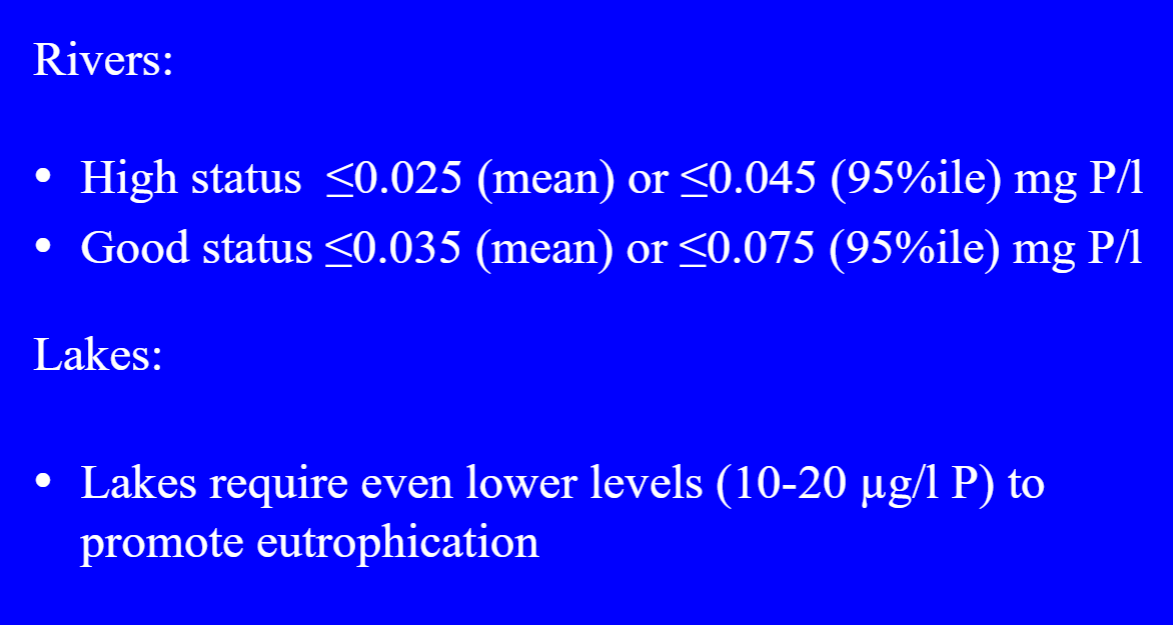
Water Frame Directive standards
Symptoms of Eutrophication in lakes
Excessive algal blooms; low water quality (pea soup)
Increased turbidity, reducing amount of light and oxygen reaching submerged plants → loss of habitat for some invertebrates and fish
Diversity of aquatic plants tend to decrease
Macroinvertebrate communities dominated by tolerant species.
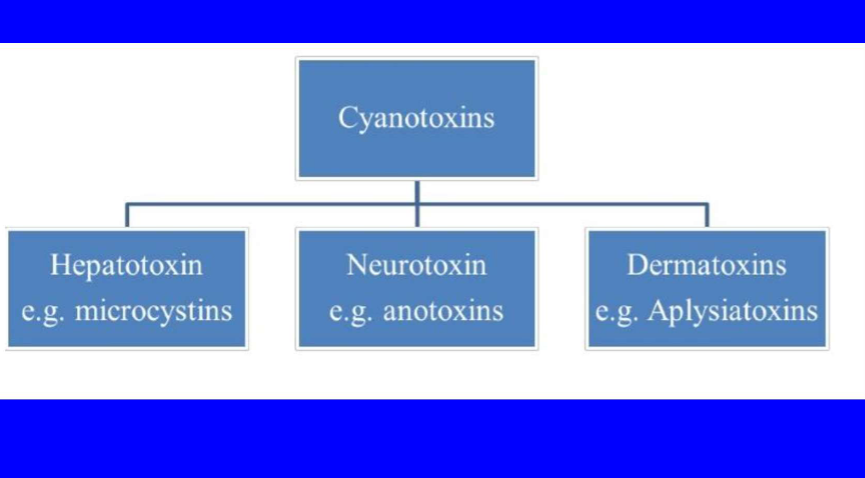
Possibility of toxic blue green algae (HABS produce toxins)
Oxygen depletion in deep water as organisms decomposing the increased biomass consume O
P recycled from sediments
Increased water treatment costs
Water may be unacceptable to taste or odour due to the secretion of organic compounds by microbes.
DOC secreted by algae may increase cost of chlorination and also produce chlorinated phenolic substance.
Algae adapted to low P
Luxury consumption/uptake more P than is necessary to support their next cell cycle
Storage as polyphosphate granules
Production of enzyme alkaline phosphate (ALP - cells and to exterior environment)
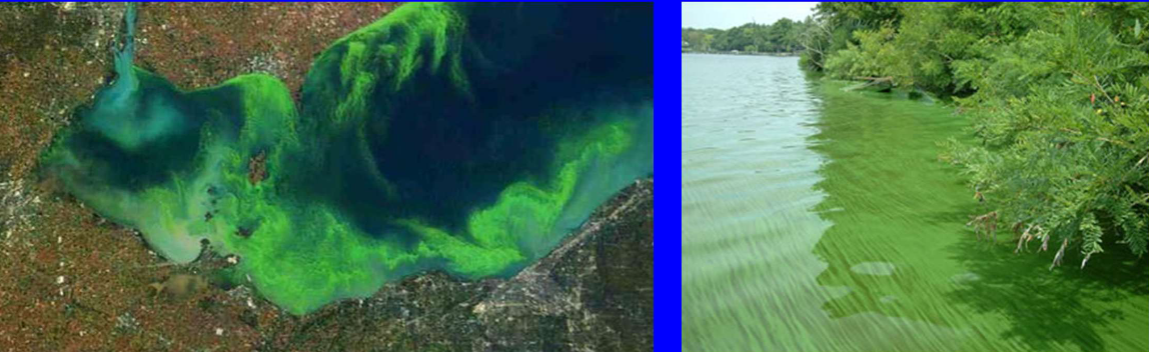
Harmful Algal Blooms (HABs)
Component of HABs (Dinoflagellates, diatoms and cyanobacteria)
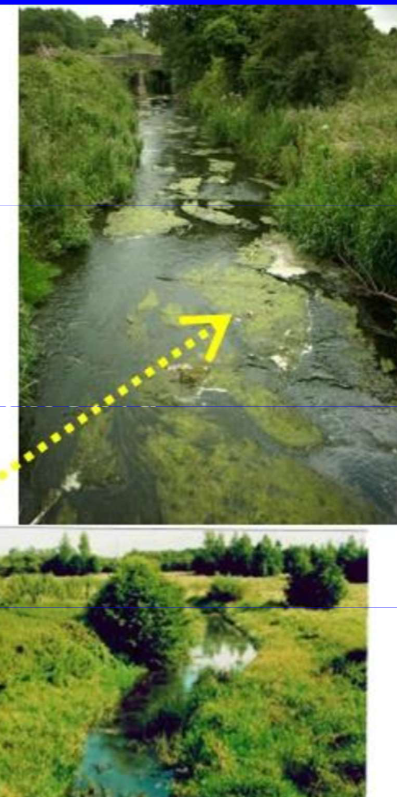
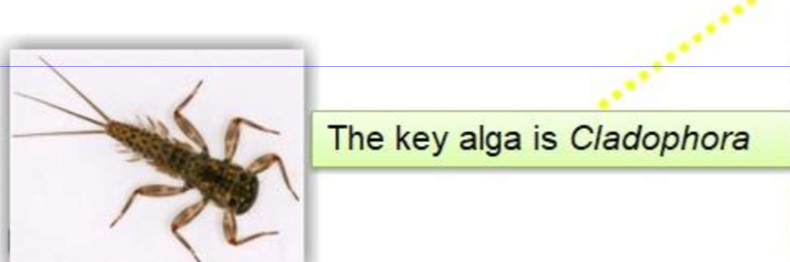
Symptoms of Eutrophication in Rivers
Excess macrophytes & especially filamentous algae Cladophora sp. and marginal vegetation of rivers
Strong diurnal fluctuation in dissolved oxygen levels (night time deficits)
Fish kills in warm weather or salmonid populations move out
Pollution-sensitive macroinvertebrates disappear
Stress leading to fish kills
Remediation/Mitigation measures
Subsiding of sewage treatment plants
Nutrient management on farms; only apply what is needed, soil testing
Diverting wastewater to treatment plant or constructed wetland
Maintaining vegetated buffer zones along watercourses
Slow the flow (uptake further upstream)
Reducing livestock
Reduce soil compaction
Undertake conservation/contour tillage
P reduction may not be sufficient in hypertrophic lakes (accumulation of nutrients for many years)
Main forms of Nitrogen in Freshwaters
Ammonia
Nitrite
Nit
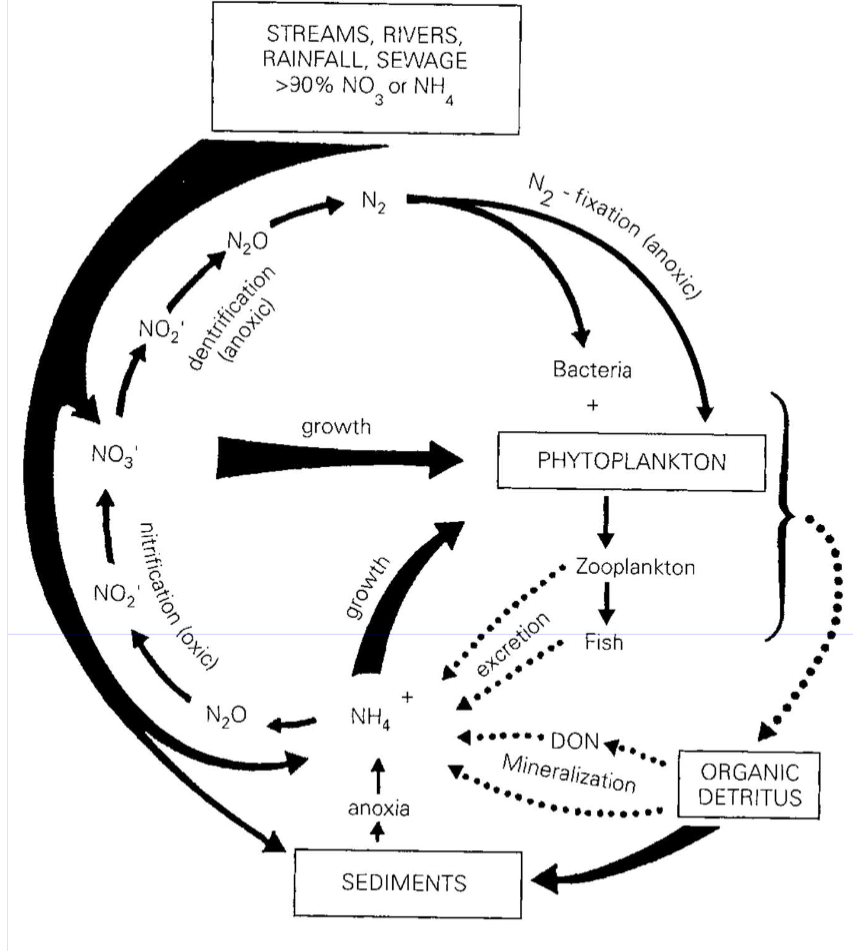
Nitrogen cycle in Freshwater ecosystems
Thick black lines indicate main pathways in terms of mass transfer.
Dotted lines are those involved in recycling and mineralisation in the water column.
Nitrogen is mostly available as nitrate, which passes from rain to rivers and lakes, where much of it is take up by algae and used for growth, then deposited in the sediments.
Nitrogen in algae is eaten by zooplankton (lakes) and insect larvae (lake benthos and streams) is excreted as ammonia which is recycled back to algae in the summer.
Note the two anoxic sections of the cycle (N2 fixation and denitrification), which involves blue--green algae and bacteria; in contrast to the rest of the cycle that occurs under oxygenated conditions.
Most N2 fixation occurs in the plankton, whereas denitrification occurs in sediments especially in estuaries and wetlands. Most organic nitrogen in aquatic ecosystems is present as plant or animal nitrogen and organic detritus (particulate or DON = dissolved organic nitrogen).
Ammonia WFD standard
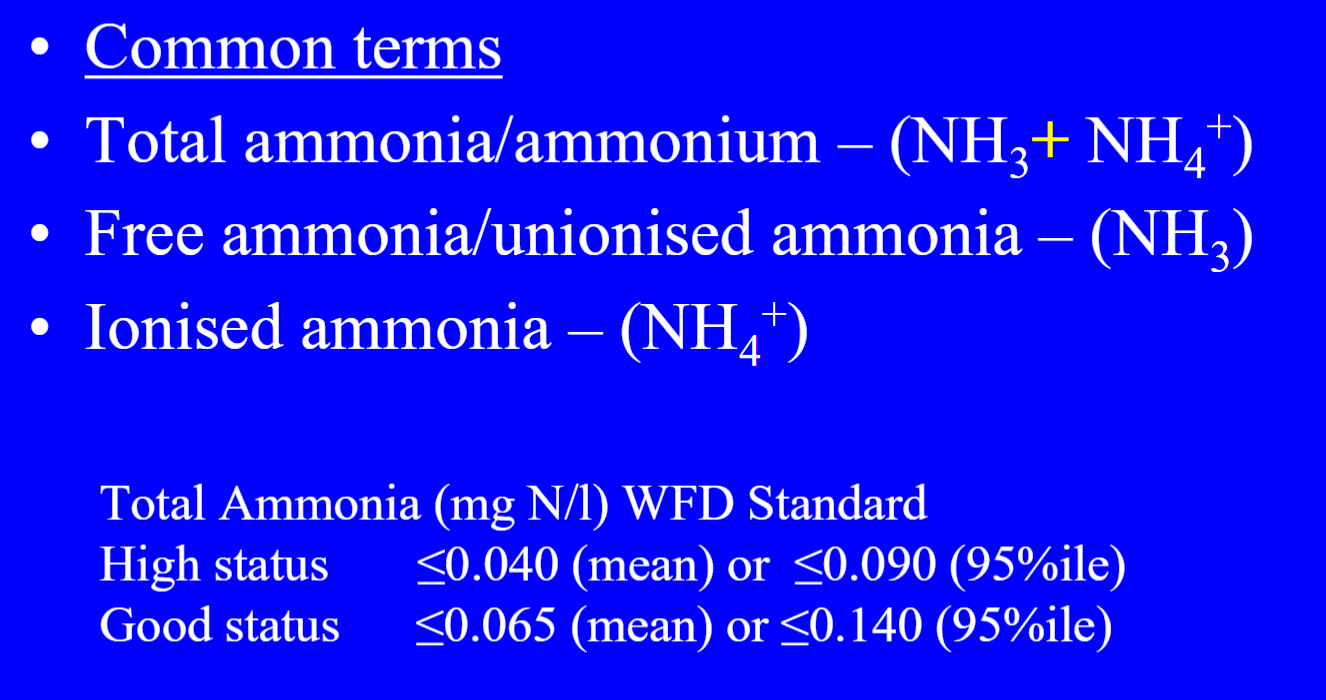
Unoionised Ammonia is Toxic to fish in high concentrations
Acute exposure causes:
Increase in gill ventilation
Hyper-excitability
Convulsions
Death
Chronic exposure to unionised ammonia
Affects
Causes decrease in reproductive capacity (egg viability, date of spawning etc)
Causes decrease in growth (condition factor drops)
Increases susceptibility to disease
Get progressive deterioration in physiological functions
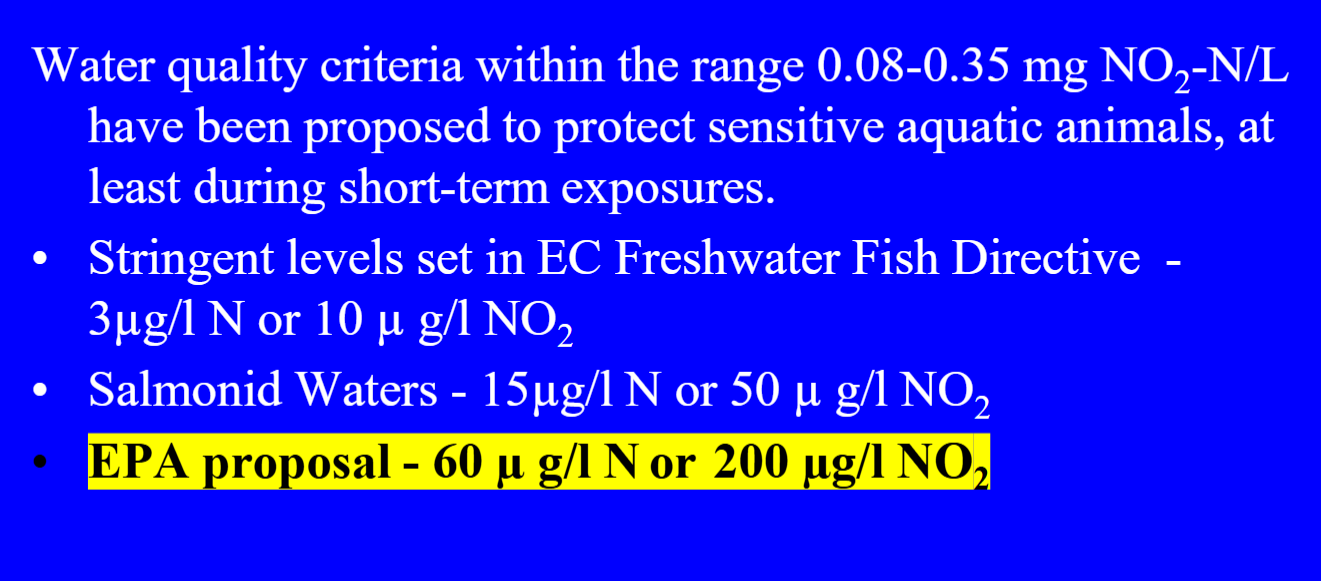
Nitrite NO2
Toxic to fish in small conc.
Causes hyperventilation & impacts cardiovascular function
Main toxic action of nitrite on aquatic animals:
The conversion of oxygen-carrying pigments into forms that can no longer transport oxygen leads to severe hypoxia and can ultimately cause death.#
In fish, entry of nitrite into the red blood cells is associate with the oxidation of the iron, converting haemoglobin into methaemoglobin that is unable to release oxygen to body tissues because of its high dissociation constant
Get a similar oxidation reaction with copper in the hemocyanin of crustaceans as it is converted into methemocyanin
Nitrite thresholds
Nitrate NO3
Main toxic action of nitrate on aquatic animals is due to the conversion of oxygen-carrying pigments (e.g. hemoglobin, hemocyanin) forms that are incapable of carrying oxygen (e.g. methemoglobin)
Not usually toxic to fish (low permeability of gills to nitrate)
Can promote eutrophication
Has implications for quality of drinking water

Nitrate toxicity to fish
Potential for toxicity increases with increasing concentration and exposure time
Egg and dry appear to be most vulnerable
Cation composition (protected by hardness) of water may affect toxicity e.g. freshwater fish are more susceptible
Morphological problems in Irish Rivers
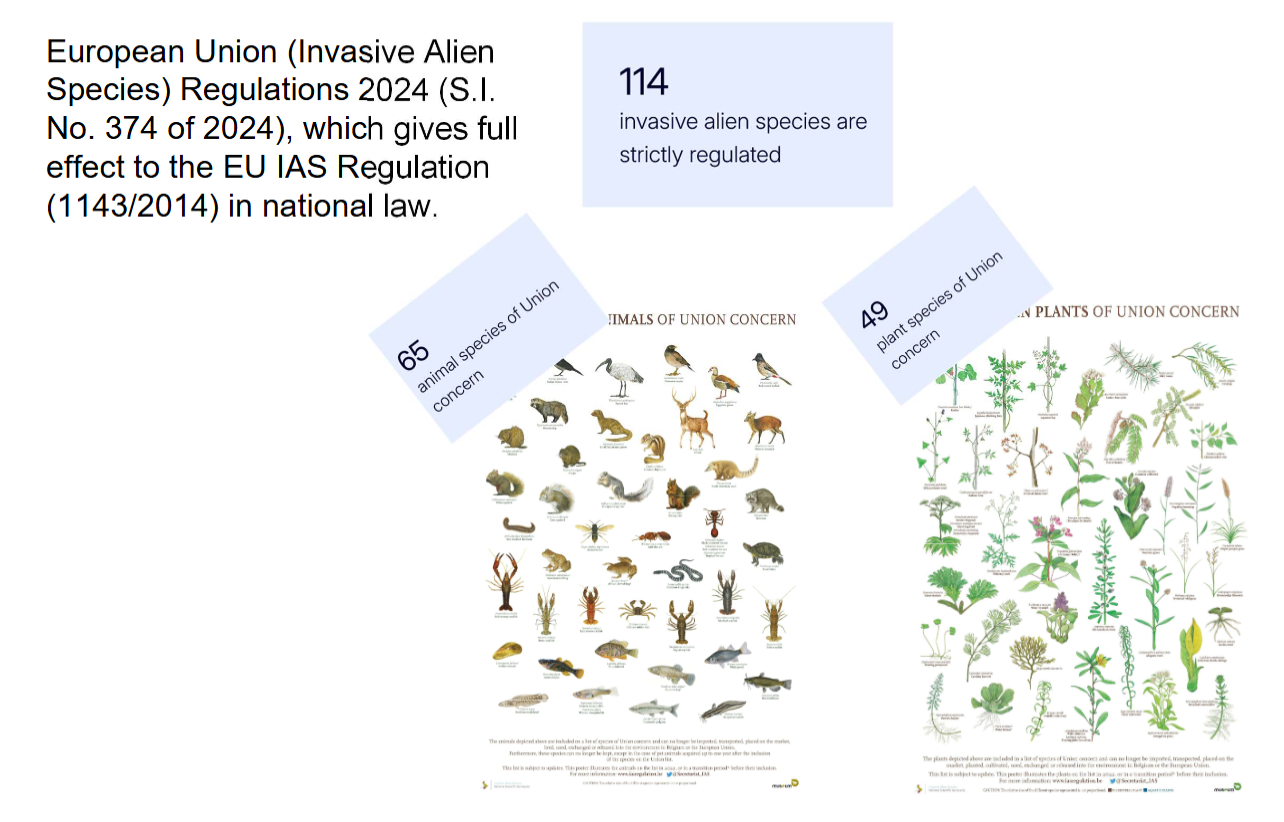
Invasive alien species
Plants, animals, pathogens etc are non-native to an ecosystem and which may cause economic or environmental harm or adversely affect human health.

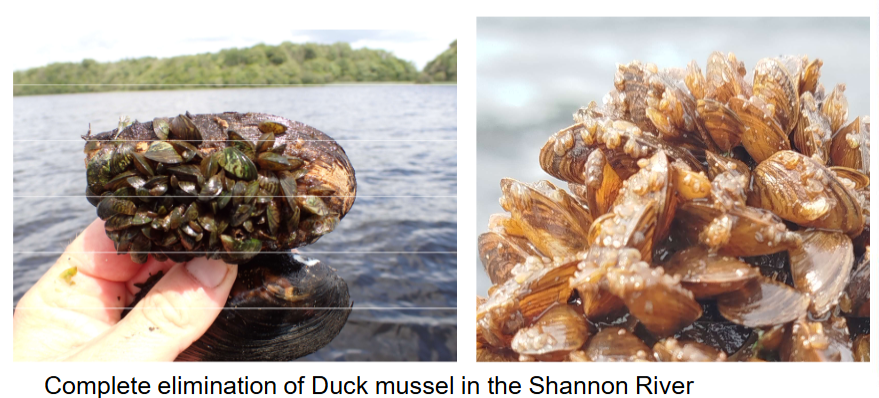
Invasive species: Quagga mussel
Filter feeding bivalve
Similar to zebra mussel
Biofouling
High densities
Graph of invasive species

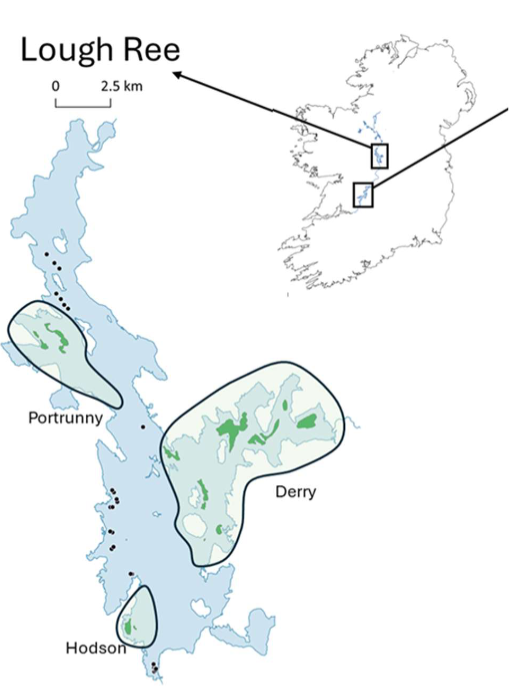
Stary stonewort (Nitellopsis obtusa)
Native to Europe but invasive in UK & Ireland
Recently expanding
Significant monocultures e.g. 84ha
250ha in 3 bays in L. Ree
Acid mine drainage
Low pH
Toxic heavy metal concentrations
e.g. Lead and Zinc
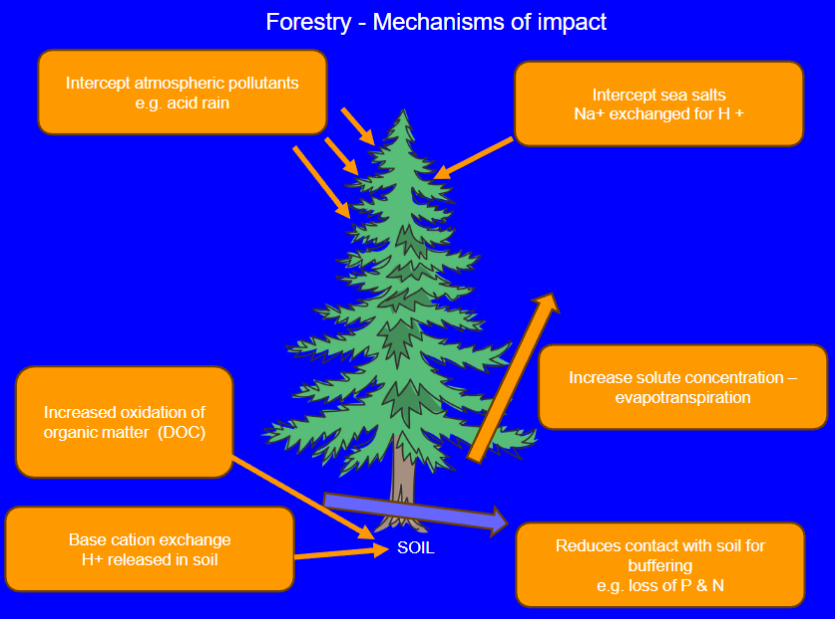
Impacts from Forestry Operations
10.5% forest cover (3/4 coniferous)
Takes 35-40 years to reach maturity
Most planted on upland peaty soils
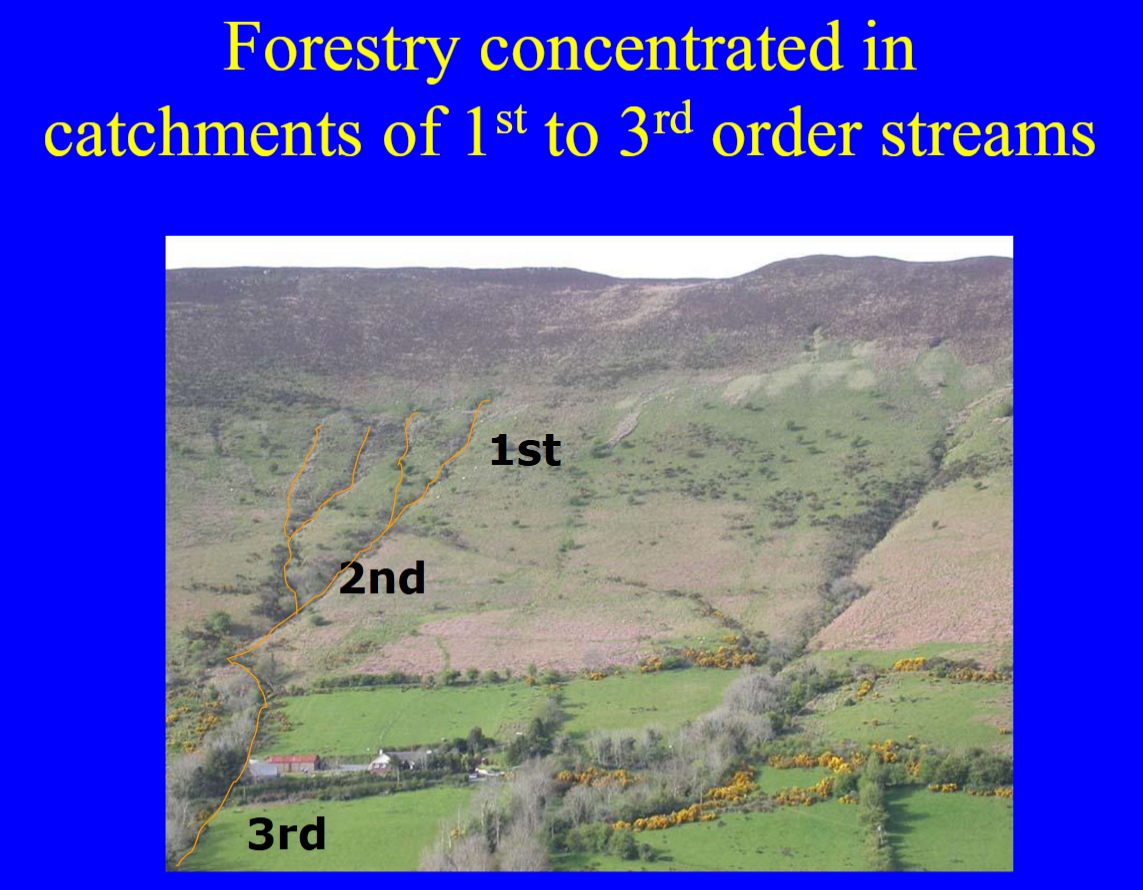
WFD characterisation
Forest operations are potential source of diffuse pollution:
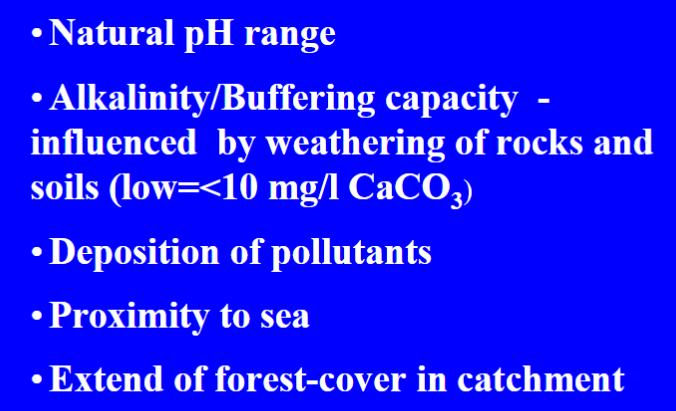
Acidification
Eutrophication
Siltation
Tree harvesting
Literature indicates felling increases sediment and nutrient losses in streams draining the catchment
Sensitivity of Freshwaters
Aluminium
Measurements
Total aluminium
Inorganic aluminium - potentially toxic to fish and other biota
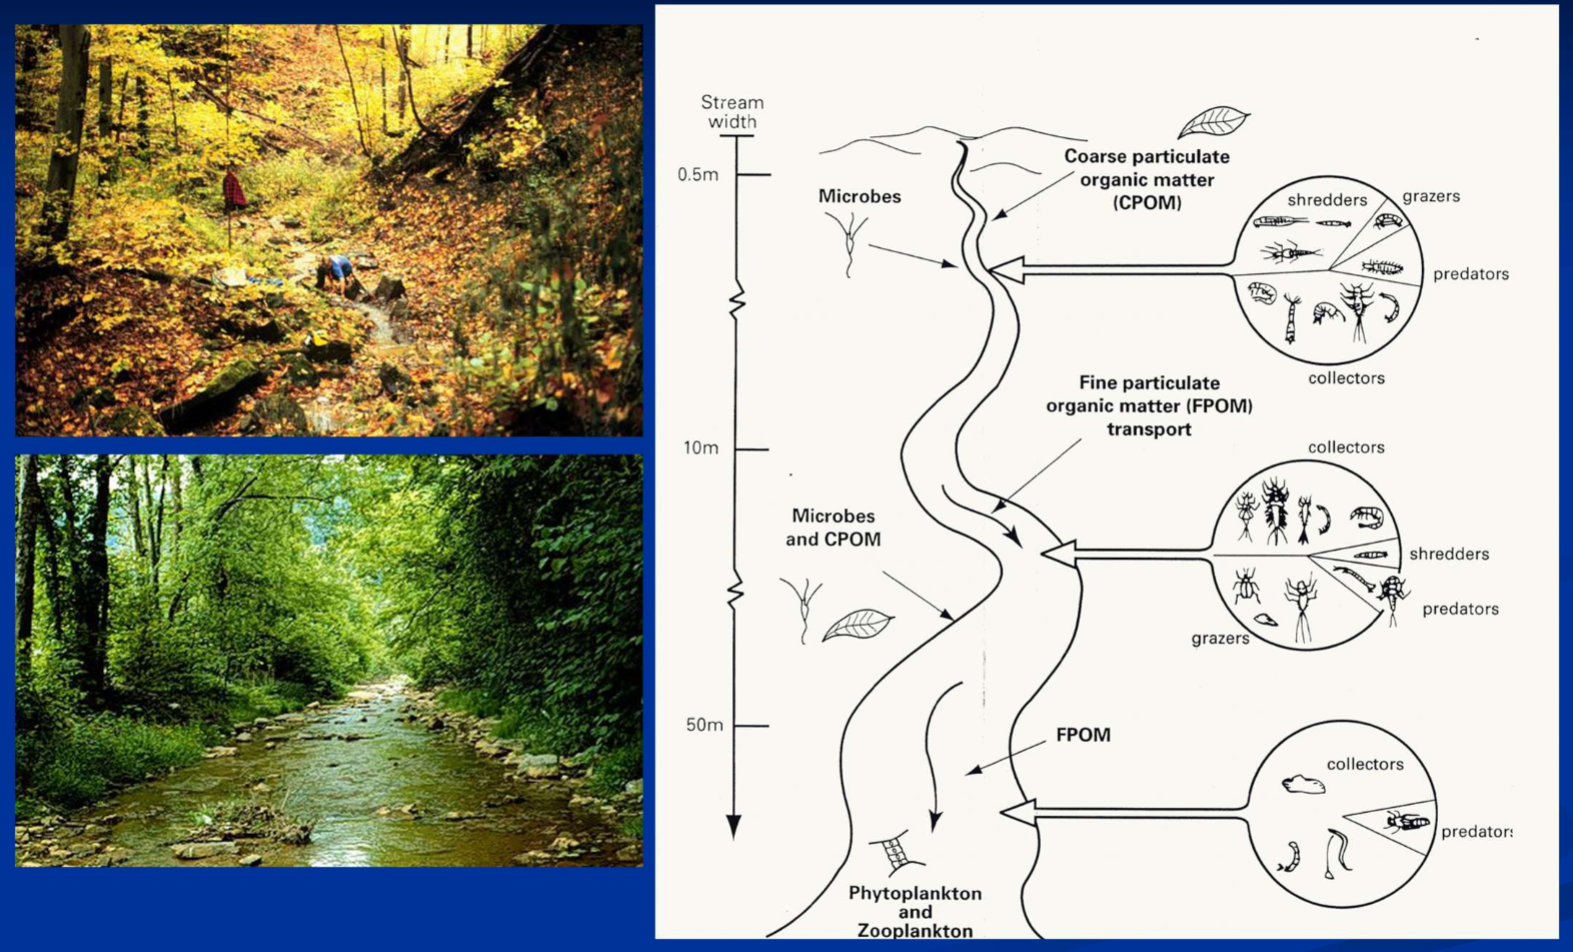
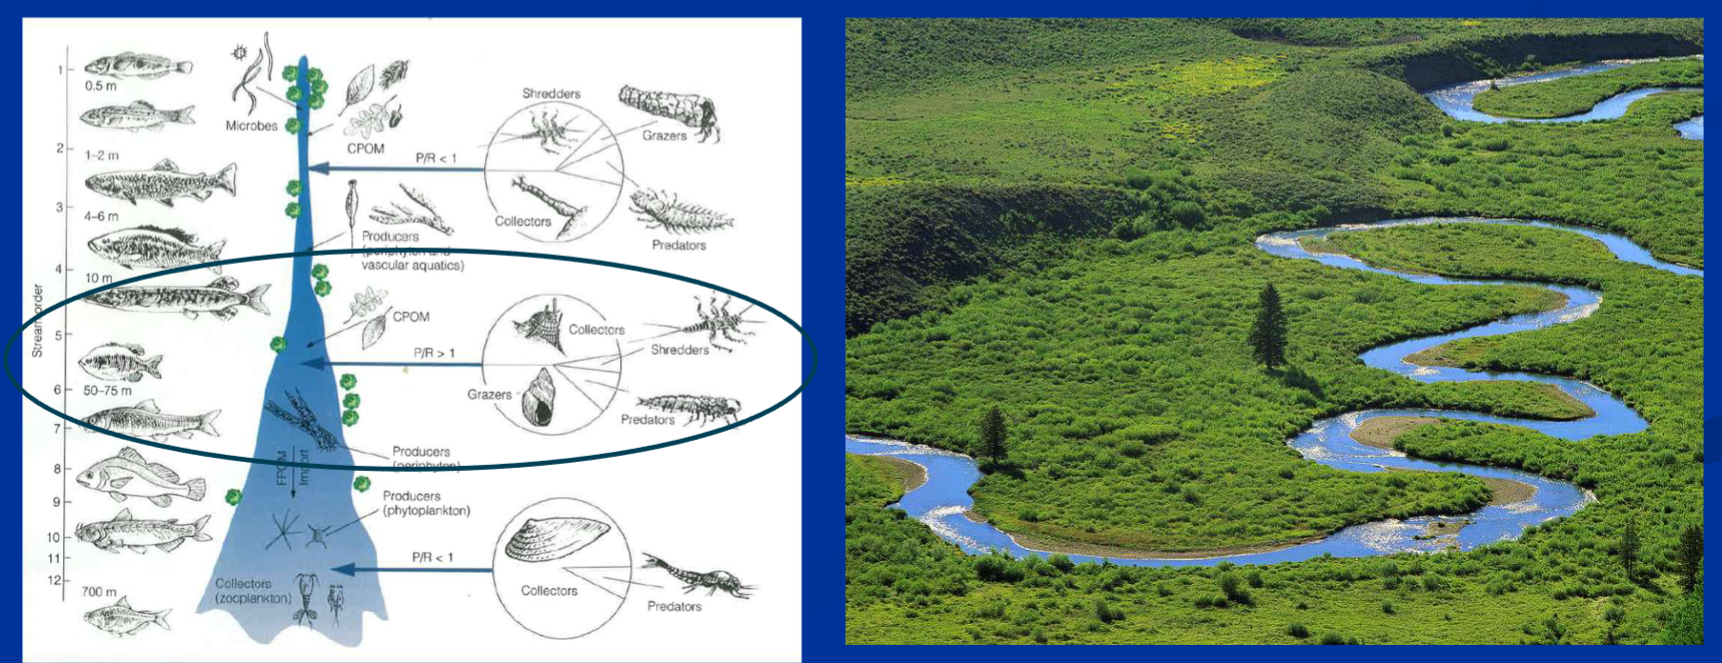
Continuum of Change
Community of macroinvertebrates change in response to changes in food supply and abiotic factors
Weaknesses of RCC (River-continuum concept) 1
Works best for temperate rivers with season inputs of organic matter
Relates to the main channel, omitting side channels, marshes, backwaters and floodplains and other linkages.
Does not take into account as ‘‘discontinuities’’ such as lakes or dams
Does not take into account various types of rivers sources
Weaknesses of RCC (River-continuum concept) 2
High biological diversity in mid-reaches (2nd/3rd order) due to greatest diversity of substrate, flow and food sources (unlikely that all coincide
High diversity of mid reaches due to downstream drift of insects and upstream movement of crustaceans (true for large rivers confined to their channels but not for large floodplain rivers, which accumulate substantial input of energy from the floodplain.