Lecture 19: Measuring Activity of the CNS
1/9
There's no tags or description
Looks like no tags are added yet.
Name | Mastery | Learn | Test | Matching | Spaced | Call with Kai |
|---|
No analytics yet
Send a link to your students to track their progress
10 Terms
Electroencephalography (EEG)
Measures electrical activity of the brain
Post-synaptic activity of 1000s or more neurons
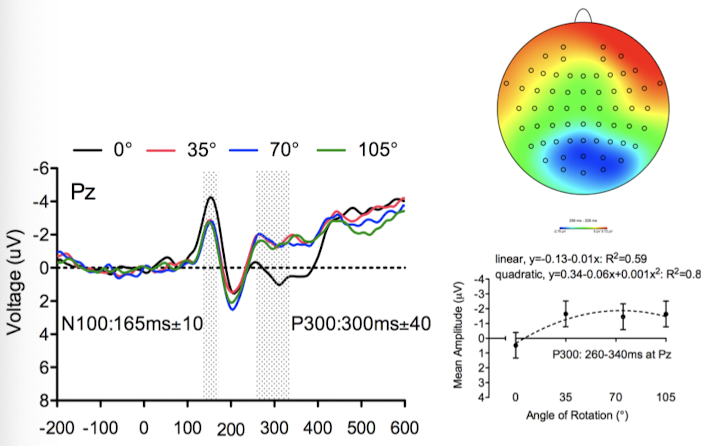
Event-related brain potentials (ERP)
Excellent temporal resolution BUT “inverse problem”
Fast measurement technique → measures electro-activity in milliseconds
Doesn’t allow you to localize brain area → very poor spatial resolution
Measure technique time locked to sensory, cognitive, or motor event.
Hundreds of trials
Going above 0 voltage → increase; going below 0 voltage → decrease
Positron Emission Tomography (PET)
Nuclear imaging technique
Injected with radioactive (isotope) trackers
Measures physiological changes → metabolism, blood flow, glucose uptake
Primarily used as diagnostic tool → identify specific neurodegenerate diseases
Very poor spatial resolution
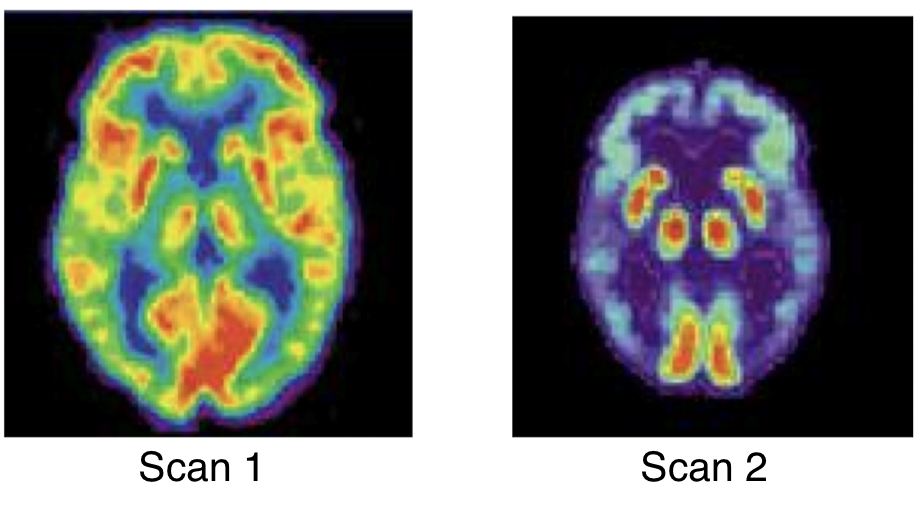
Which is the healthy brain and which is the Alzheimer’s brain?
Scan 1 → healthy participant
Scan 2 → Alzheimer’s Disease; slight reduction in overall cortical and subcortical regions of the brain
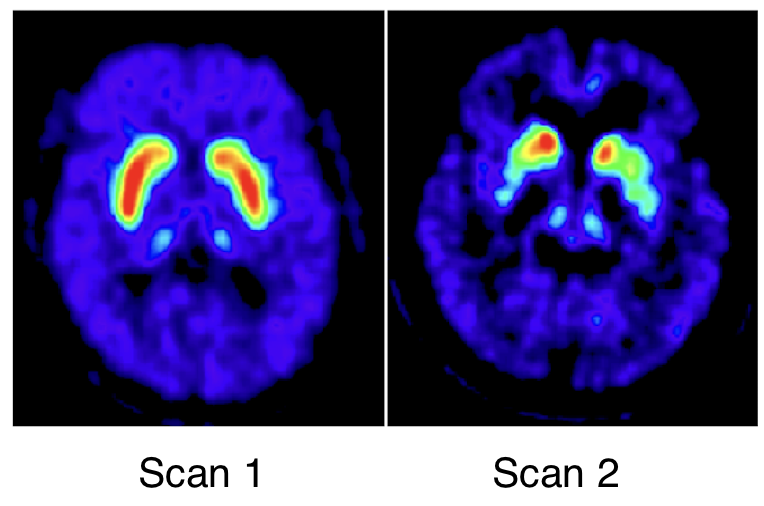
Which is the healthy brain and which is the Parkinson’s brain?
Scan 1 → healthy participant
Scan 2 → Parkinson’s Disease
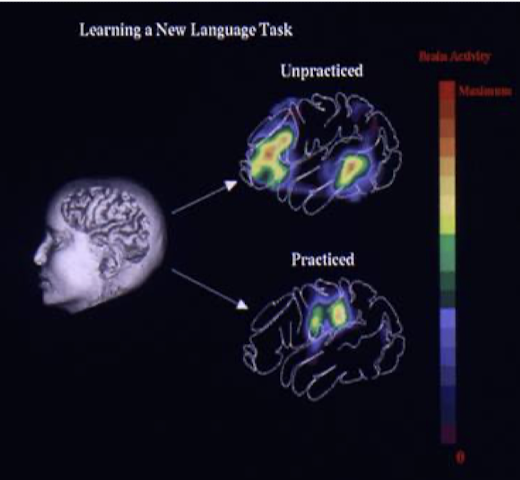
What was neuroimaging originally used for and what does it do now?
Originally to localize function in the brain
Now clinical to look at onset and progression of neuro-degenerate diseases like Alzheimer’s and Parkinson’s
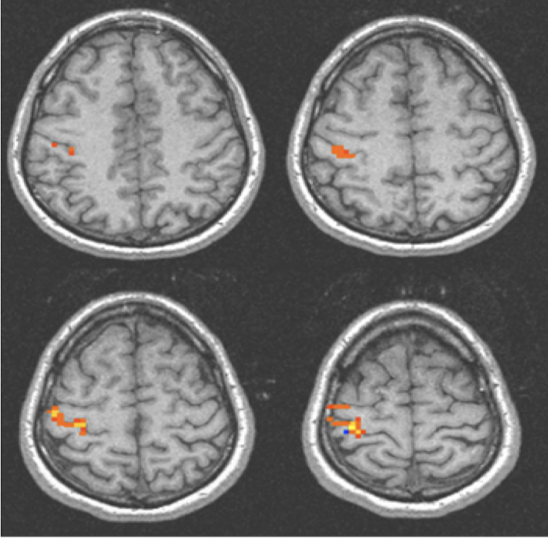
Functional Magnetic Resonance Imaging (fMRI)
Measures brain activity by identifying changes in blood flow
Brain activity and blood flow linked
Bold signal
System level of the brain
All about structure and function
Measuring neural activity in brain by proving good spatial resolution but terrible temporal resolution
A little slow → ~1 second
Participant tapping finger → fMRI sees primary motor cortex active, able to evaluate bold signal through blood oxygen level → magnet spins biomolecules and blood cells in brain (carrying O2) able to measure spin frequency and determine where there is significant uptake of blood
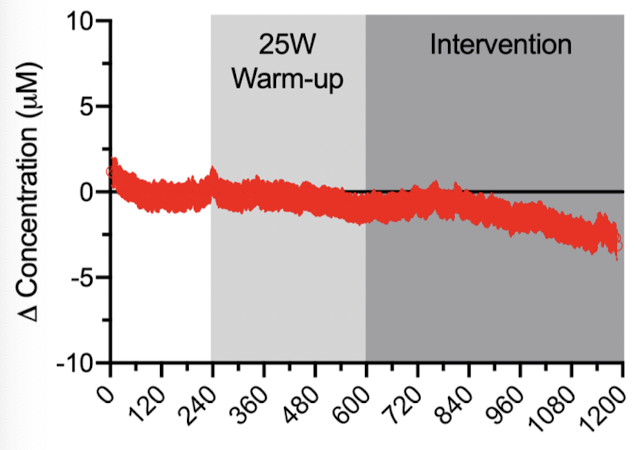
Near-Infrared Spectroscopy
Technique using light to detect changes in oxygenated (and deoxygenated) hemoglobin in blood.
Decrease in oxygenation of the blood cells as a function of exercise → cells using more oxygen
Transcranial Magnetic Stimulation (TMS, rTMS)
Non-invasive brain stimulating technique in which a changing magnetic current induces electrical activity at a specific region of the brain
“Virtual” lesion technique → disrupts or facilitates neural activity in the brain
If disrupt is virtual lesion → area doesn’t work for a couple milliseconds
Increases or decreases localized brain activity
Single pulse creates scotoma (small area where you can’t see) in visual cortex → no processing of visual information
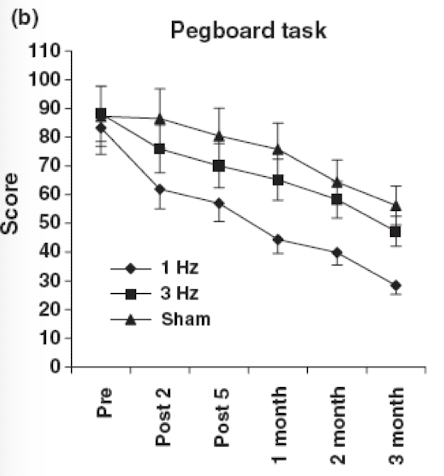
Purdue Pegboard Test Findings
1 and 3 Hz groups showed better functional recovery at every assessment
1 Hz to unimpaired Hz has the greatest recovery
TMS and Visual Spatial Neglect
One treatment of 5 Hz, 15 days later
Difference of severity of visual spatial neglect → gradually faded back to baseline