AP Macroeconomics
1/124
There's no tags or description
Looks like no tags are added yet.
Name | Mastery | Learn | Test | Matching | Spaced |
|---|
No study sessions yet.
125 Terms
Gross Domestic Product (GDP)
the total value of all final goods and services produced in a year within that country
2 ways to calculate GDP
the income approach and the expenditure approach.
National Income (NI)
sum of the income earned by the factors of production owned by a country’s citizens
Personal income (PI)
the money income received by households before personal income taxes are subtracted
Disposable income (DI)
personal income minus personal income taxes
Expenditure approach
adds up spending by households, firms, the government, and the rest of the world using the following formula:
GDP = C(consumption by households) + I(investment) + G(gov purchases) + (X-M) exports - imports
Income Approach def + formula
slightly modifies national income to arrive at GDP
GDP = NI + Depreciation - Subsidies + Net income of foreigners
Depreciation
decline in the value of capital over time due to wear or obsolescence
Difference between national income and GDP
National income is the total income earned by a nation's residents, while GDP measures the total economic output within a country. An american making a film in france would add to US’s national income and France’s GDP.
Net domestic product
GDP minus depreciation. indicates how much output is left over for consumption and additions to the capital stock after replacing the capital used up in the production process
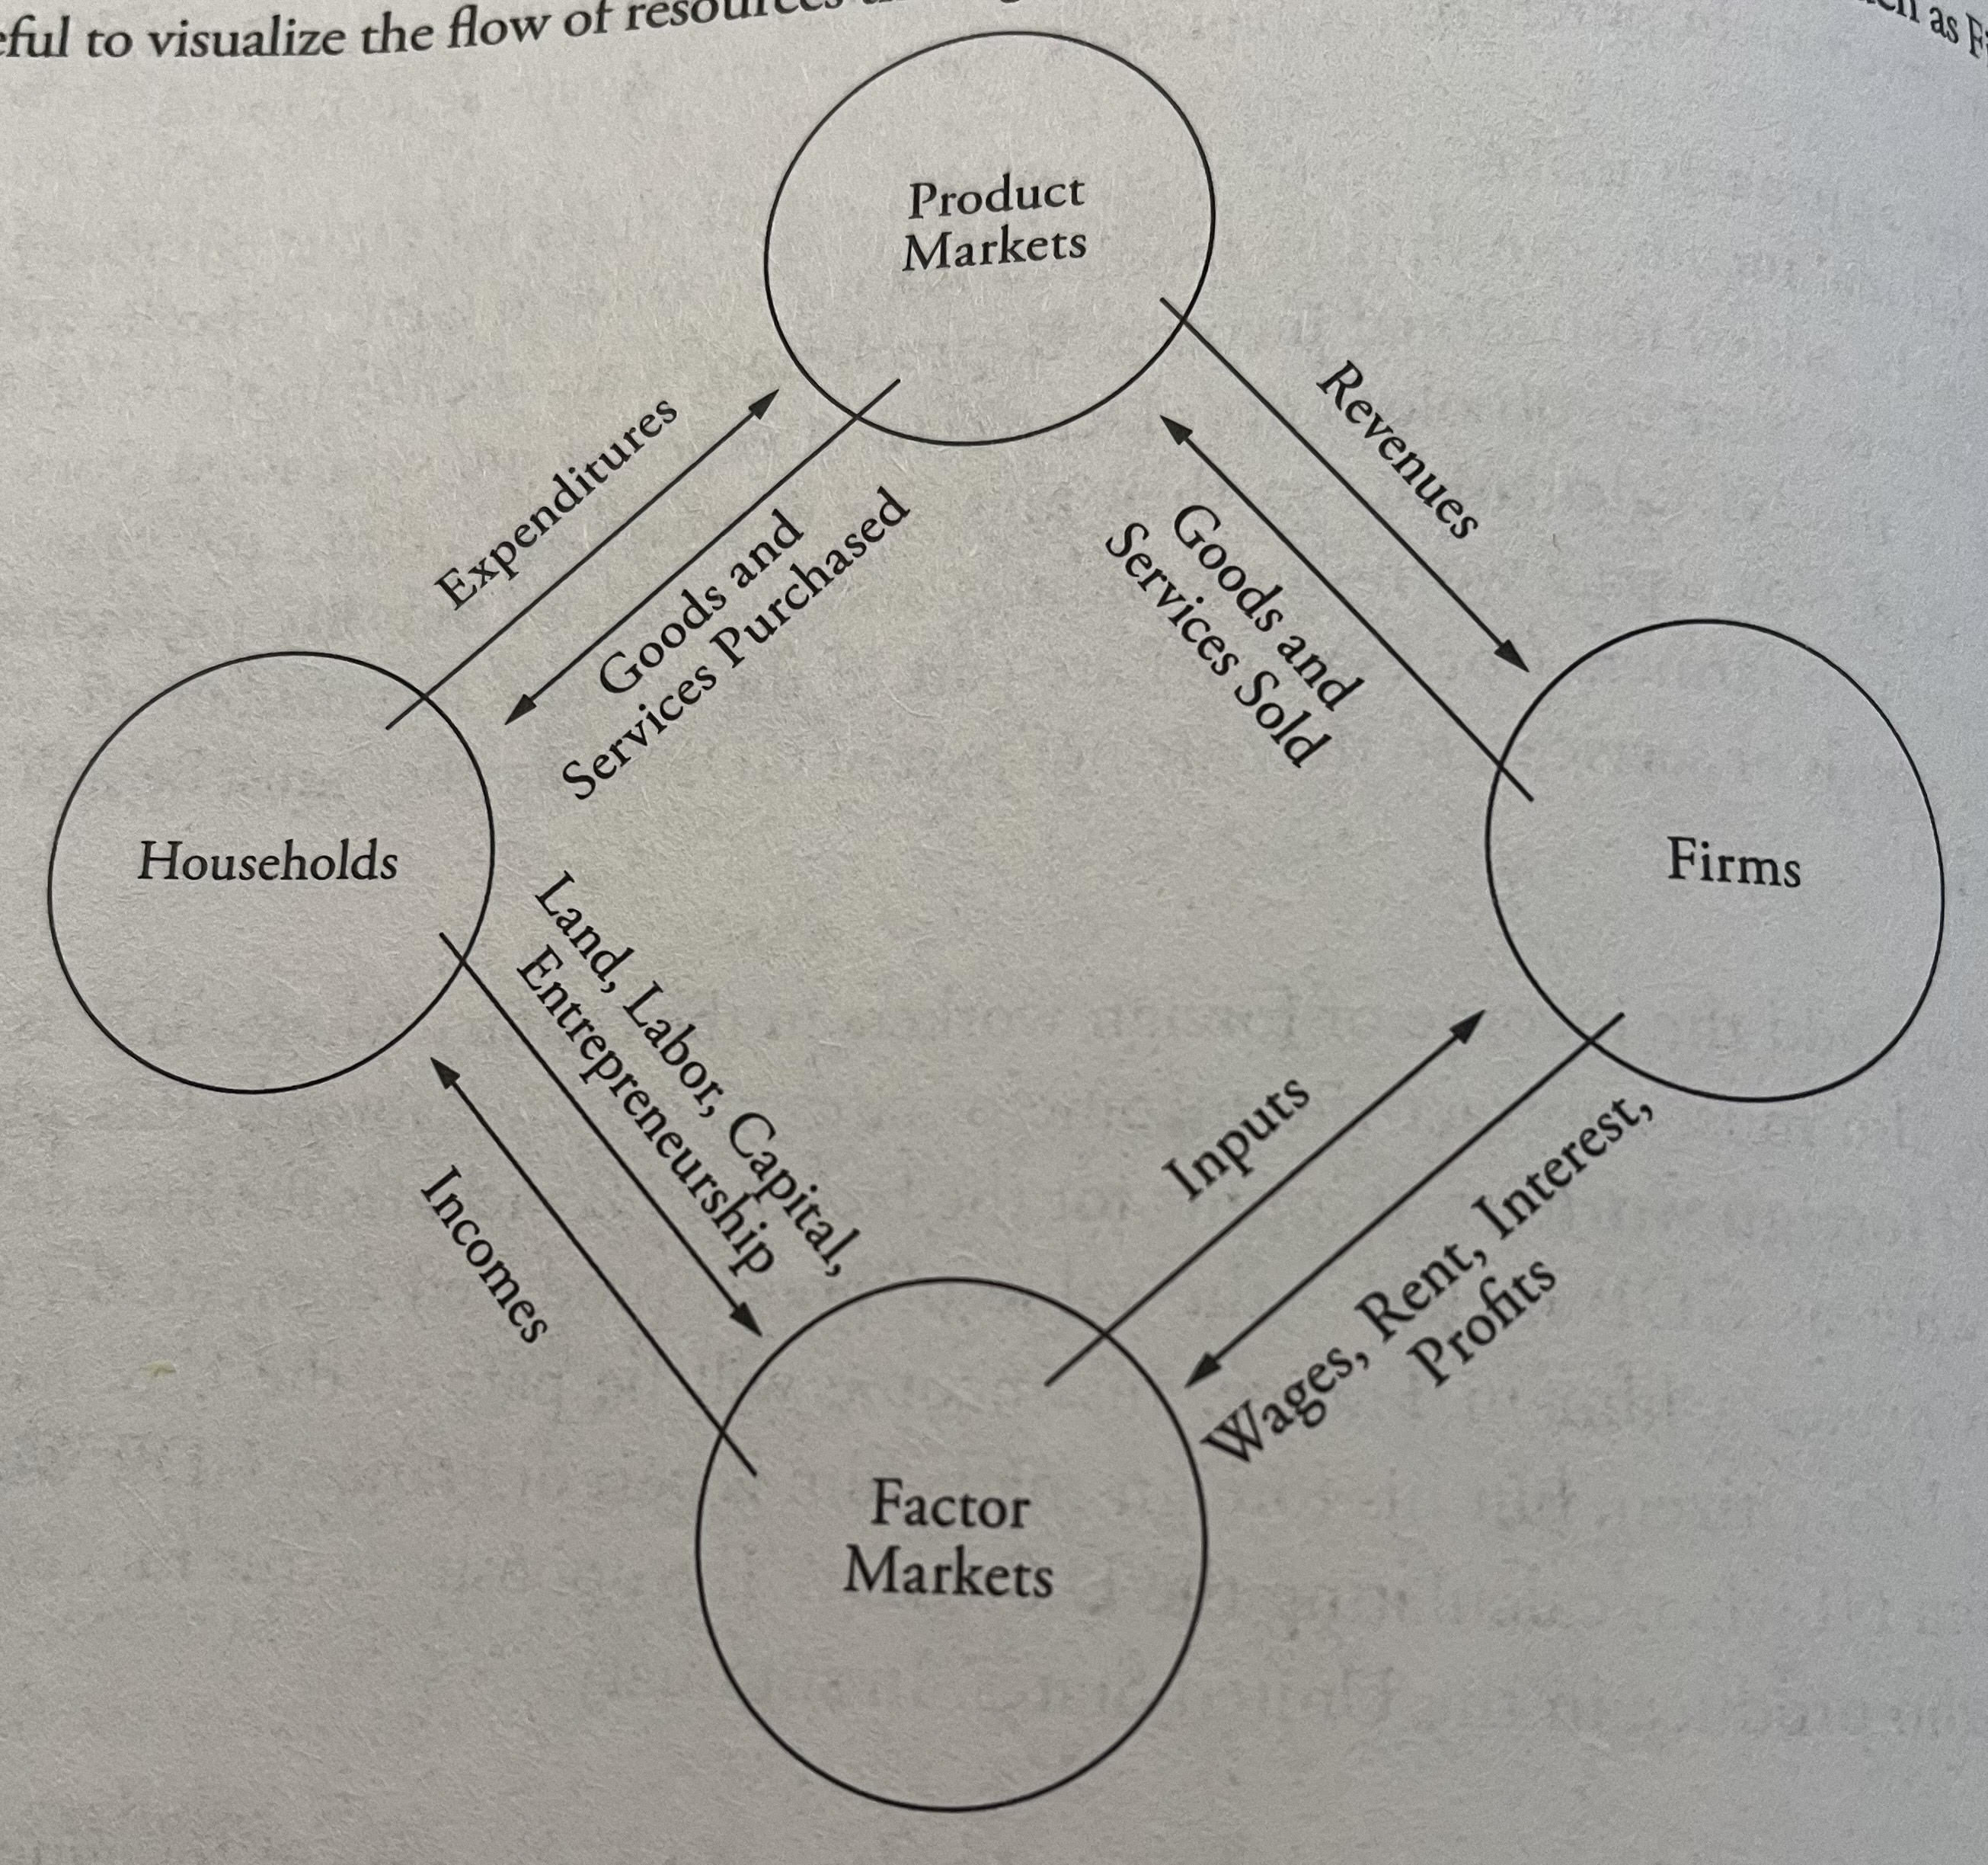
Circular flow model
Aggregate income = aggregate expenditure = GDP
Labor force
includes employed and unemployed adults
unemployed
a labor force participant willing and able to work and has made an effort to seek work in the past four weeks.
labor force participation rate
#of people in the labor force/working-age population
Discouraged workers
those willing and able to work but have stopped looking for work due to being discouraged and frustrated. do not count as part of the labor force
dishonest workers
claim to be unemployed to receive benefits, are able to work or are working for cash in an unreported job.
full employment (potential output)
level of unemployment that corresponds with the natural rate of unemployment (about 5% in the US)
Okun’s Law
for every 1% increase in the unemployment rate above the natural rate, output falls by 2-3%.
Frictional unemployment
temporary unemployment bc they’re moving to a new location/occupation in which they will be more productive
Structural unemployment
unemployment that occurs when workers' skills are unmarketable and no longer neededdue to changes in the economy or technological advancements.
Cyclical unemployment
unemployment that results from economic downturns or recessions, when aggregate demand decreases.
Seasonal unemployment
unemployment because of the season/time of year
Inflation
sustained increase in the overall price level
Deflation
sustained decrease in the overall price level
Nominal salary
actual number of dollars a person earns
Real salary
purchasing power of the money one earns
Money illusion
When one’s nominal salary increases but their real salary (purchasing power) hasn’t increased→ leads to excessive spending
Consumer Price Index (CPI)
government’s gauge of inflation. used to adjust tax brackets and social security payments
CPI formula + inflation formula
CPI = (Cost of base year market basket at current prices / cost of base year market basket at base year prices) * 100
Inflation between years Y and Z = (Year Z’s CPI / Year Y’s CPI-1) * 100
Bureau of Labor Statistics
calculates CPI by using the average change over time in the prices paid by consumers for a basket of goods and services.
Real GDP formula
Real GDP = (Nominal GDP / CPI for the same year as the nominal figure) * 100
Producer Price Index (PPI)
measures changes in the prices of wholesale goods such as lumber and steel
GDP Deflator
alternative general price index that reflects the importance of products in current market baskets, rather than in base year market baskets, which become less relevant over time
GDP Deflator formula
Cost of current year market basket at current prices / cost of current year market basket at base year prices * 100
the GDP deflator tends to register a lower inflation rate than CPI because
GDP deflator reflects both price changes and substitutions away from goods that have become relatively expensive
Business cycles
fluctuations in aggregate output and employment
Output gap
difference between potential output and actual output (where the actual gdp curve and potential gdp intersect the output gap is 0)
Say’s law
states that production (supply) creates its own demand, suggesting that supply will generate an equal level of demand in the economy.
John Maynard Keynes economic theory
a flat AS curve in the depression range and argued that wages cannot adjust to match changes in price levels. Further, he argues that deviations from full employment output might persist until the government steps in with monetary or fiscal policy.
which 3 effects cause the inverse relationship between price and GDP
real wealth effect, foreign trade effect, interest rate effect
foreign trade effect
when the price level in one country increases, the prices of imports from other countries become relatively less expensive. leads to more imported goods and fewer exports → decreases real GDP
interest rate effect
wen price level increases, purchasing power of money decreases. increases the demand for money in the form of loans, decreases the supply of loanable funds. This leads to higher interest rates, which decreases investment and consumption, ultimately reducing real GDP.
real wealth effect
price level increases, the value of assets such as cash and checking account balances falls. real value of assets declines, so people buy less leading to real GDP reduction
aggregate supply curve (SRAS)
In the short run, it slopes upward, illustrating a positive relationship between the price level and the quantity of goods and services supplied. has a horizontal depression “keynesian” stage, a positively sloped intermediate range, and a vertical physical limit “classical stage”
LRAS curve
vertical and stands at the level of output that corresponds with full employment
Cost-push or supply side inflation
when inflation results from an increase in resource costs that shifts the AS curve to the left
Stagflation
rising prices + falling output (increasing inflation and increasing unemployment)
Demand pull inflation
result of the AD curve shifting out to the right relative to the AS curve (like inflation or increase to the money supply)
creeping inflation
remains steady at a low rate for a long period of time
galloping inflation
exceeds 10 percent per year and grows month after month unsteadily
hyperinflation
very rapid prince increases in excess of 50 percent per year
recessionary gap
amount by which equilibrium real GDP would have to increase to reach LAS
inflationary gap
amount by which equilibrium real GDP would have to decrease to reach LAS
spending mulitplier/ expenditure multiplier
number by which the initial amount of new spending should be multiplied to find the total resulting increase in real GDP
marginal propensity to consume (MPC)
amount by which consumption increases for each additional dollar of real income
MPC formula
change in consumption/ change in real income
Marginal propensity to save (MPS)
fraction of each additional dollar of income that is saved
MPS formula
change in saving / change in real income; MPS = 1-MPC
spending multiplier/expenditure multiplier formula/government spending multiplier formula
Multiplier = 1/MPS
Tax multiplier def + formula
total change in real GDP resulting from each $1 change in taxes
Tax multiplier = -MPC/MPS
fiscal policy
excercised by the gov when trying to counter fluctuations in aggregate expenditure with changes in purchases, transfer payments, or taxes
Money + its 3 functions
anything that is commonly accepted as a means of payment for goods and services. medium of exchange, store of value, unit of account
medium of exchange
avoids a double coincidence of wants and the need to barter. money acting as a common medium of exchange simplifies transactions
store of value
key characteristic distinguishing money from currency. allows for a non perishable item that will hold value of past production into the future
unit of account
standard unit price listings and comparisons that provides a consistent measure of value, allowing individuals to compare the value of different goods and services.
Currency
any item that is used as money that does not act as a store of value or carry intrinsic value (like paper cash would have no value past being scratch paper if the US ceased to exist)
Commodity money
raw material with intrinsic value (silver coin) that is used in exchange for other goods in an economy
Fiat money
currency without intrinsic value (paper cash). also known as currency
central banks
manage macroeconomic indicators and influence economies via the policy rate.
U.S. central bank and policy rate name
Federal Reserve Bank and federal funds rate
Fed “dual mandate” two goals
maximize the employment rate and maintain price stability
Money supply
amt of money available on the market
liquidity
the ease of converting assets into cash without affecting their market price. how easily that money can be accessed
M1
sum of coin and paper money (currency) + checking deposits + traveler’s checks
M2
M1 +saving deposits, small-time deposits, money market mutual funds
limited reserves
economies with this system use a fractional reserve banking system in which only a fraction of total deposits is held on reserve and the rest is lent out
reserve ratio (formula)
bank reserves / total deposits
money creation
generation of assets caused by an initial deposit to a bank being held partially in reserve and partially redistributed as a loan over and over again
Money multiplier def + formula
total amount of deposits resulting from an initial deposit that is ultimately held as reserves
Money multiplier = 1 / required reserve ratio
discount rate
interest rate banks pay to borrow money from the Fed
Open market operations
Fed’s purchase and sale of government securities
ample reserves
economies with this system rely on administered interest rates, the discount rate and interest on reserves, to influence the economy
financial assets
subcategory of economic assets. these are entities over which institutional units or individuals assert ownership rights.
Monetary policy
the use of money and credit controls to influence interest rates, inflation, exchange rates, unemployment, and real GDP
expansionary monetary policy effects
Money supply (Ms) goes up, interest rates(r) decrease, investment (i) goes up, aggregate demand (AD) goes up, output (Y) goes up
contractionary monetary policy effects
Money supply (Ms) goes down, interest rates (r) goes up, investment (i) goes down, aggregate demand (AD) goes down, output (y) goes down
Monetary inflation
when prices increase due to an oversupply of currency
Phillips curve
illustrates the inverse relationship between inflation and unemployment
Rational expectations theory
suggests that people learn to anticipate government policies designed to influence the economy. Anticipating an AD shift to the right and the subsequent increase in the price level, people will demand higher prices and wages and shift AS back to the left. argues gov intervention is not necessary or useful for economic stability
Budget deficit
difference between fed gov spending and tax collections in one year
national debt
accumulation of past deficits → the total amount that the fed gov owes at a given time
Ricardian Equivalence Theory
states that deficit financing is no different from tax financing bc if the former is chosen, people will simultaneously increase their savings by the amount they would have been taxed in preperation for the inevitable repayment of the debt at a later time
balance of payments
statement of all international flows of money over a given period
trade deficit exists when
imports exceed exports, opposite being a surplus
merchanidse trade balance equation
merchandise exports - merchandise imports
current-account balance equation
trade balance + services balance + transfers (unilateral)
Financial account balance equation
foreign purchases of home assets - home purchases of foreign assets
merchandise trade deficits or surpluses must be offset elsewhere in
the current-account or financial account balances
arbitrage
practice of buying low and selling high
fixed exchange rate
when set by the central bank changes in demand affect only the quantity of dollars purchased; supply curve is horizontal bc changes in demand dont affect value of currency but affect quantity of it