3. T-tests Pt1
1/40
There's no tags or description
Looks like no tags are added yet.
Name | Mastery | Learn | Test | Matching | Spaced | Call with Kai |
|---|
No analytics yet
Send a link to your students to track their progress
41 Terms
How do z-scores help us understand a test score?
A z-score tells us how many standard deviations (SDs) a score is above or below the mean.
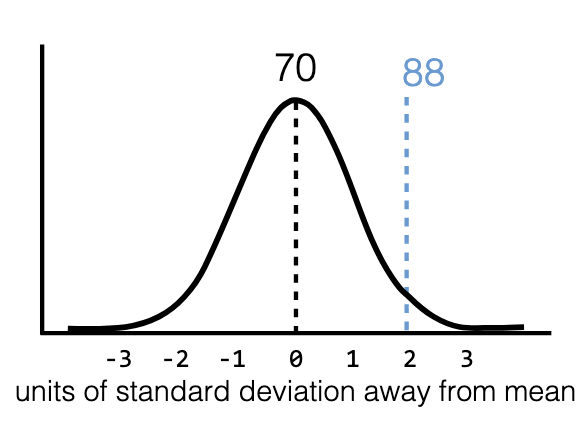
Ex: Score = 88%, mean = 70%, SD = 9
z = (88−70)/9 = 2 → “2 SDs above the mean”
Without SD, we only know “18% higher,” but not whether it’s rare or common.
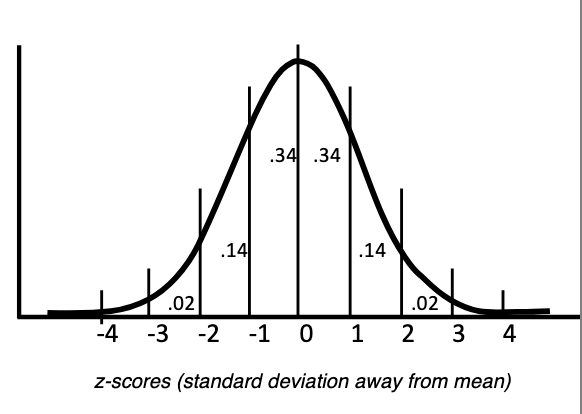
What percentages fall within 1 and 2 SDs in a normal distribution?
68% within ±1 SD of mean
96% within ±2 SDs of mean
Any normal data can be converted into z-scores to use this rule.
How do we test if a score supports a hypothesis?
Compare score to class mean using z-transform.
Ex: 76 vs mean 66, SD = 6 → z = (76−66)/6 = 1.67.
Next: check probability of scoring ≥ 76 if you’re from the same population (if you’re equally smart as the average student).
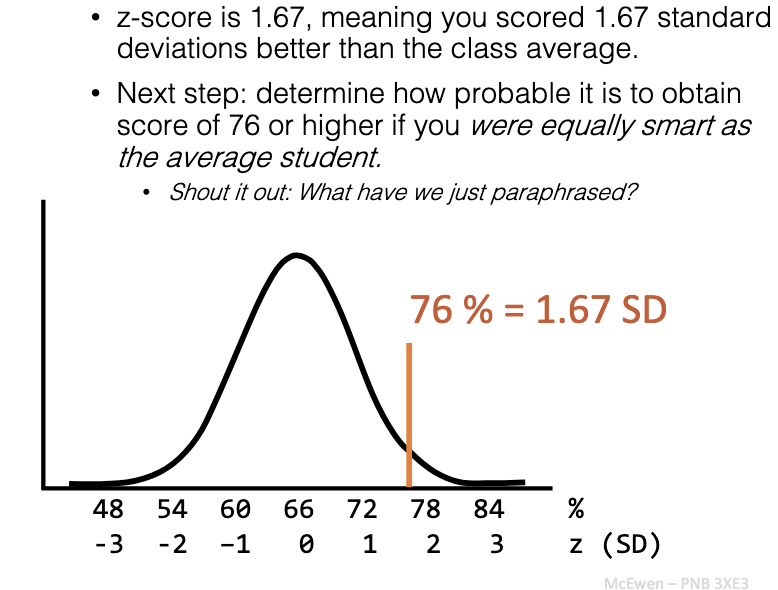
What does z = 1.67 mean in hypothesis testing?
You scored 1.67 SDs above average.
Next: find how probable it is to score this high if you are actually average.
This restates: “What’s the probability of this result if H₀ is true?”
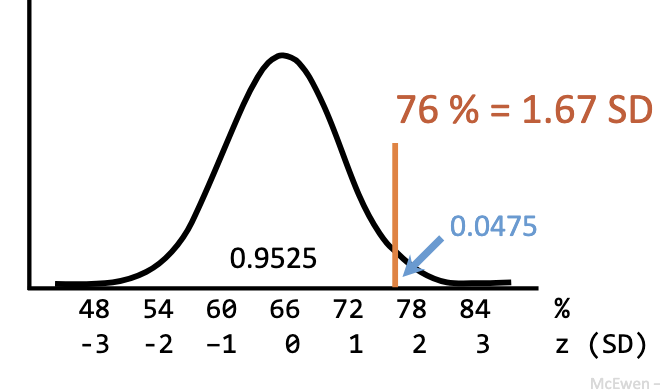
What does a p-value tell us about test scores?
p = 0.0475 → only 4.75% chance of scoring ≥ 76 if you are average.
You did better than 95.25% of classmates.
Strong evidence, but one score isn’t enough → repeated high scores = stronger evidence.

What is the traditional cutoff for statistical significance?
p < 0.05 (5% probability or less under H₀).
If something is les than 5% probable, then there’s good chance it belongs to a different population
Ex: Genius score p=0.0475 < 0.05 → statistically significant.
But: cannot prove you’re smarter, only support your interpretation.
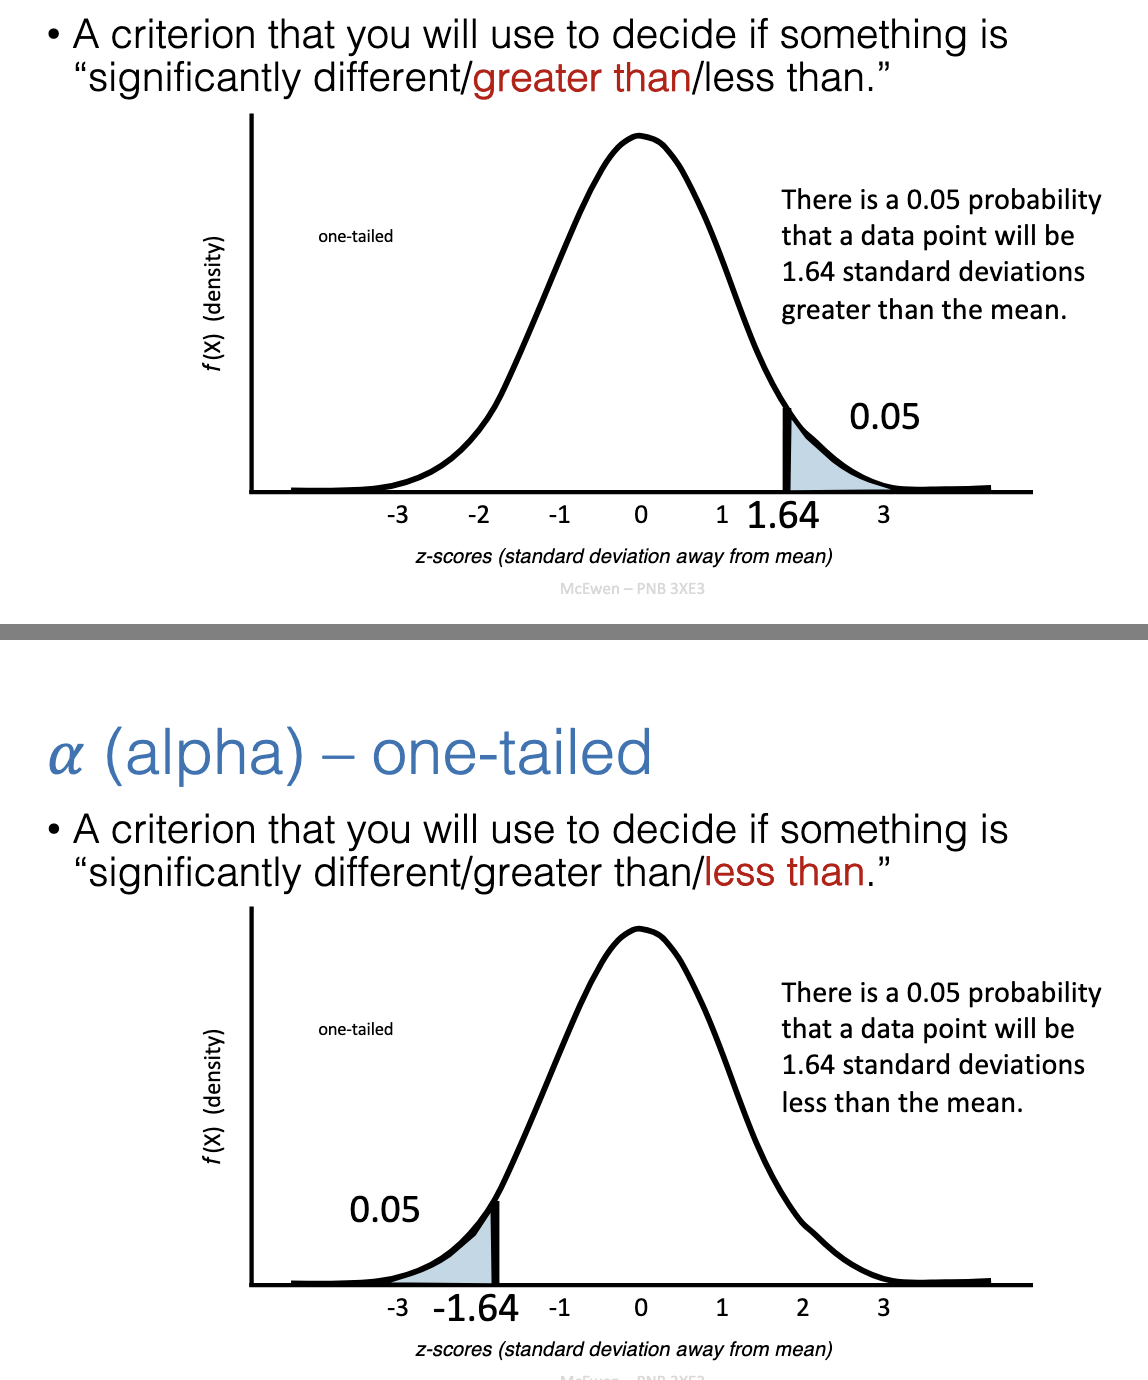
What does alpha mean in a one-tailed test?
Alpha = probability threshold for deciding significance.
At α = 0.05 → cutoff = 1.64 SDs above or below mean (depending on direction).
Used when testing only one direction (greater OR less).
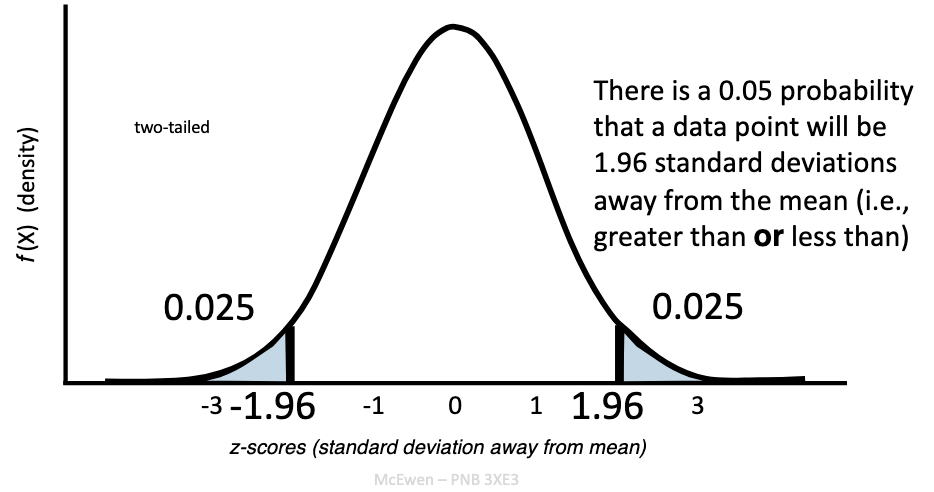
What does alpha mean in a two-tailed test?
At α = 0.05 → cutoff = ±1.96 SD from mean.
Tests for differences in either direction (greater OR less).
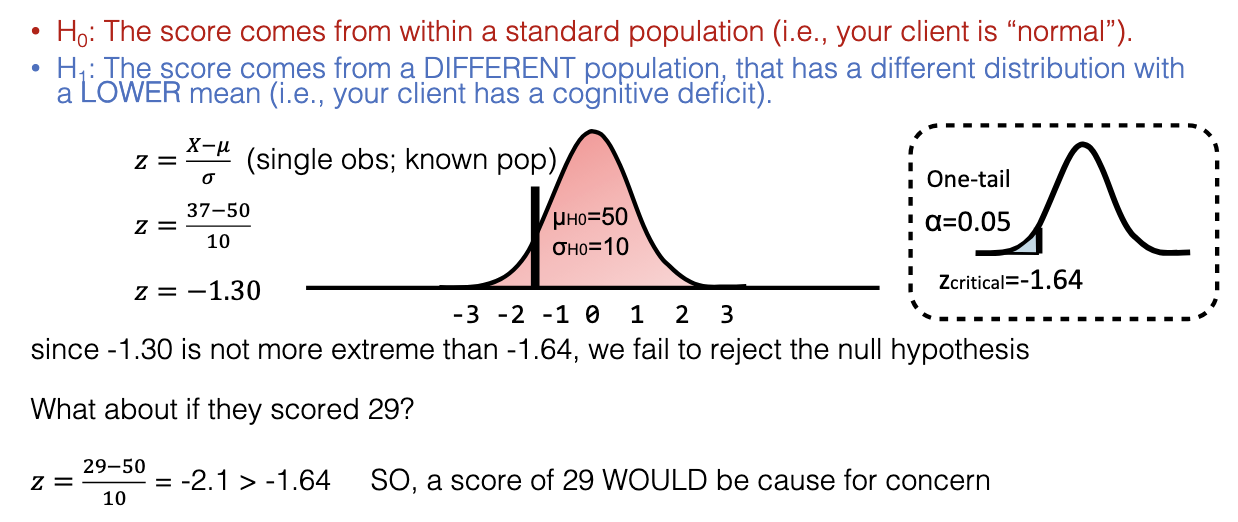
What is a one-sample test?
Tests if one score/group differs from a known population mean.
Ex: Pop mean = 50 (SD=10). Concussion client scores 37 or 29.
Question: Is their score extreme enough to suggest cognitive deficit?
H₀: Client’s score comes from normal population (no deficit).
H₁: Score comes from different population with lower mean (cognitive deficit).
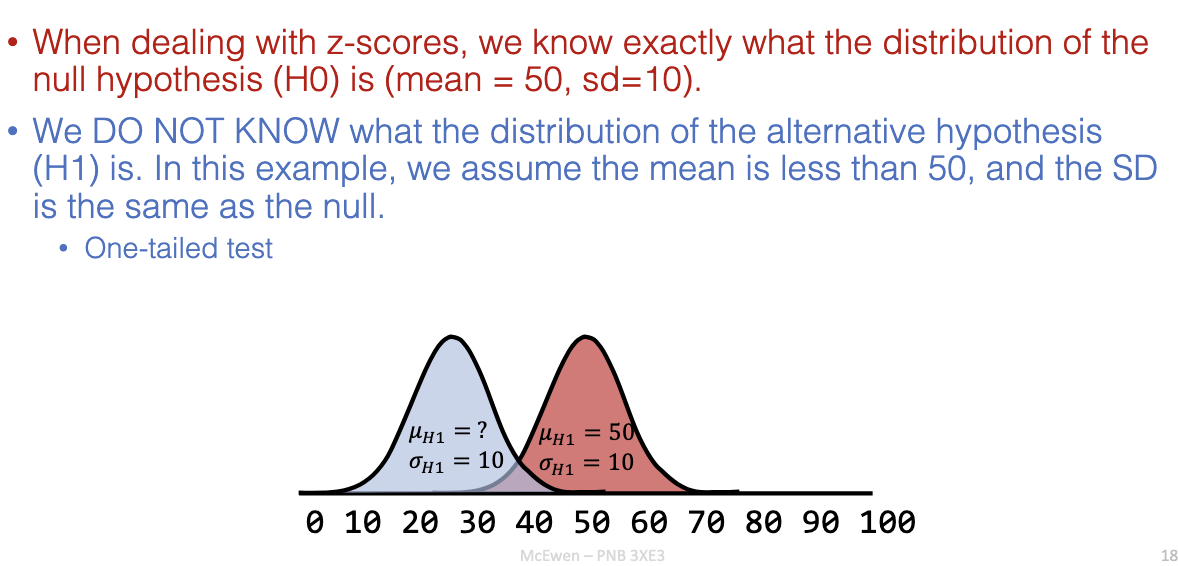
How do H₀ and H₁ differ in distribution assumptions?
H₀: Known distribution (mean = 50, SD = 10).
H₁: Unknown distribution, assumed mean < 50, same SD.
Usually tested with a one-tailed test.
Why don’t we always use z-tests?
Z requires true population mean (μ) and SD (σ).
In reality, we estimate with sample mean (M) and sample SD (s).
This leads to t-tests, using Central Limit Theorem for approximation.
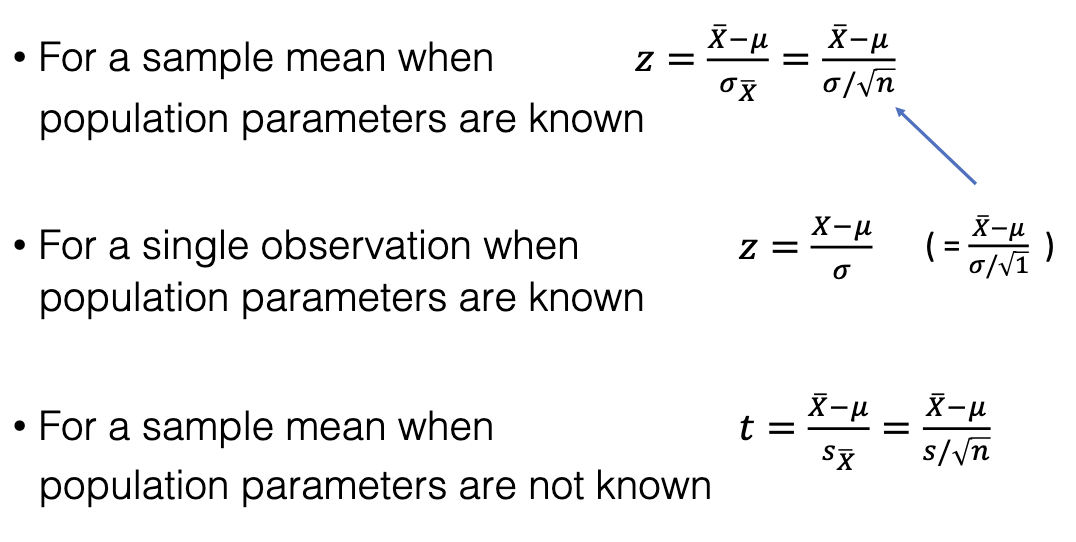
How does a t-test differ from a z-test?
Z-test: assumes μ and σ known.
T-test: estimates μ and σ from sample data.
Uses CLT: sample means approach normal distribution as n ↑.
When do we use z-tests vs. t-tests?
Use z-test if σ is known.
Use t-test if σ is estimated from s.
As n ↑, t distribution → z distribution.
In practice: usually use t-test if σ unknown.
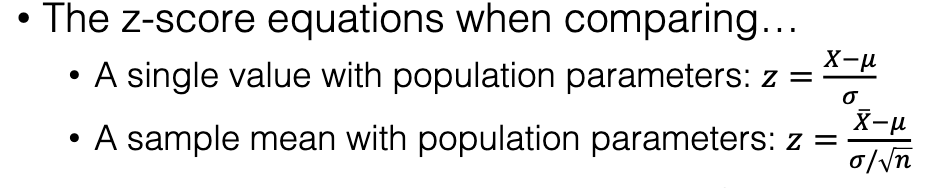
What are the formulas for z and t tests?
Single observation, known σ: z = (X−μ)/σ
Sample mean, known σ: z = (M−μ)/(σ/√n)
Sample mean, unknown σ: t = (M−μ)/(s/√n)
What are degrees of freedom in a sample?
Number of independent pieces of data after estimating parameters.
Estimating mean (sample mean) loses 1 df → df = n−1.
Ex: With 5 numbers and known mean, last value is determined → not independent.
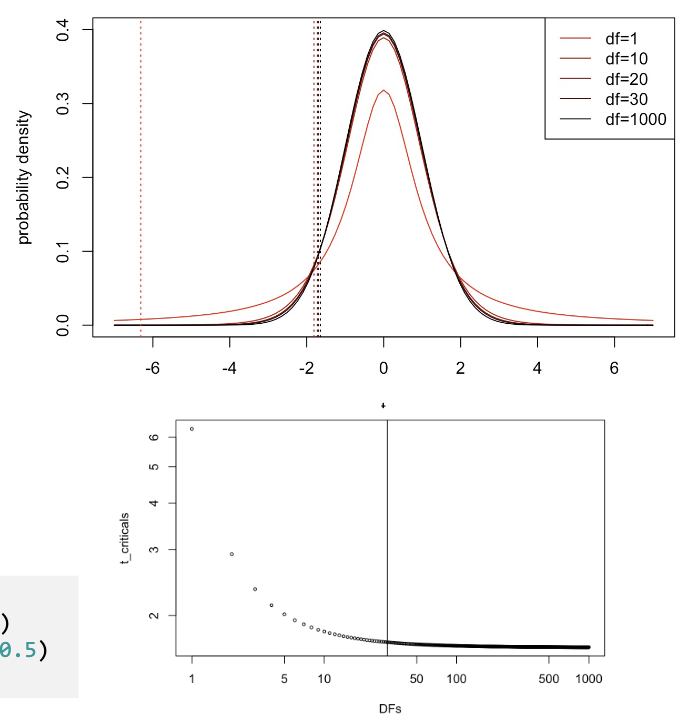
How does df affect t-critical values?
Many t distributions exist; cutoff depends on df.
df = n−1.
When df > 30, differences from z are small.
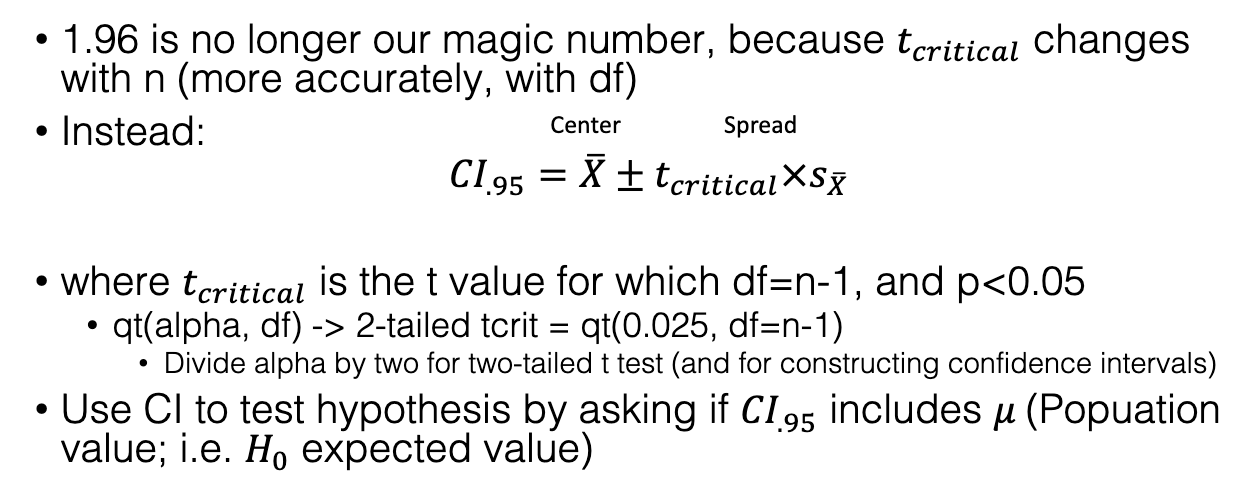
How do we calculate CI using t-values?
CI = M ± (t-critical × SE)
SE = s/√n
Use df = n−1 to get t-critical.
For 2-tailed test: split α in half (0.025 each tail at α=0.05).
If CI excludes μ, reject H₀.
How do we test if a sample mean differs from population mean using CI?
Ex: n=20, Sample mean=20, s=4. Pop mean = 18.
SE=0.89, tcrit(df=19)=2.09.
CI = 20 ± 2.09×0.89 = [18.14, 21.86].
Since 18 not in CI, conclude sample mean ≠ 18 (significant difference).
![<ul><li><p>Ex: n=20, Sample mean=20, s=4. Pop mean = 18.</p></li><li><p>SE=0.89, tcrit(df=19)=2.09.</p></li><li><p>CI = 20 ± 2.09×0.89 = [18.14, 21.86].</p></li><li><p>Since 18 not in CI, conclude sample mean ≠ 18 (significant difference).</p></li></ul><p></p>](https://knowt-user-attachments.s3.amazonaws.com/3f4c72c1-7c82-442e-a173-5dda0172e057.png)
What is the main goal of hypothesis testing regarding variation in data?
Dependent measures vary due to many sources.
Goal = understand these sources and isolate variance caused by the independent variable(s).
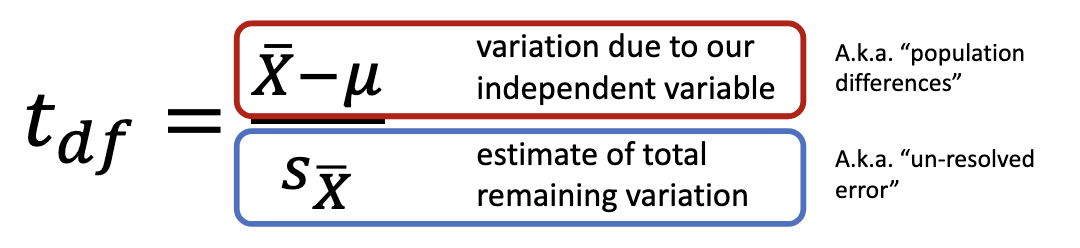
What does the t-score represent in hypothesis testing?
Ratio of variance explained by the independent variable ÷ unexplained variance (error/chance).
Formula: t= (variation due to our independent variable) / (estimate of total remaining variation)
Aim: reduce variation from chance/confounds.
How can variability (noise) in experiments be reduced?
Group samples meaningfully → use related samples.
Methods:
Repeated measures: same participant under >1 treatment.
Matched samples: pairs of participants matched on key traits, each assigned different treatment.
Example: If you want to test a new learning method, you could pair students with the same GPA. One student from each pair uses the new method, the other uses the traditional method. Then, differences in outcomes are more likely due to the method—not GPA.
What are examples of related samples in psychology?
Same subjects before & after treatment, or on 2 measures.
Identical twins, siblings, spouses.
Groups sharing a key characteristic (e.g., same tumor type).
How do related samples affect hypothesis testing?
Test is on the difference between means of related samples.
Related samples ↑ power (better detection of real effects).
Accounts for non-independence (correlation) between samples.
If we ignore the fact that the samples are related, the shared variance (non-independence) would distort results and make it harder to see the true effect.
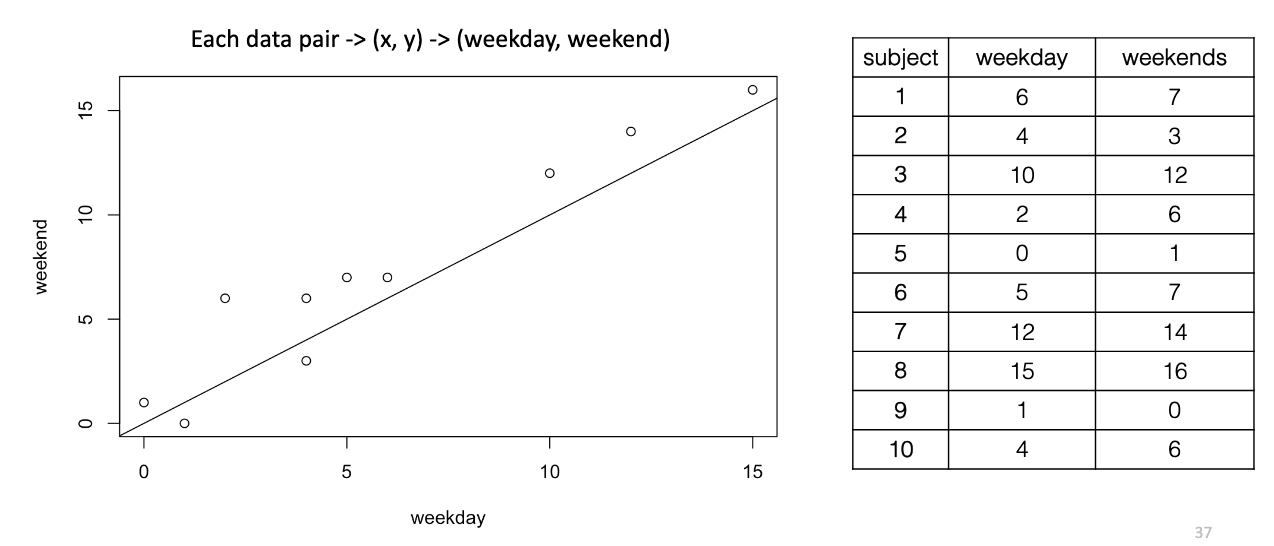
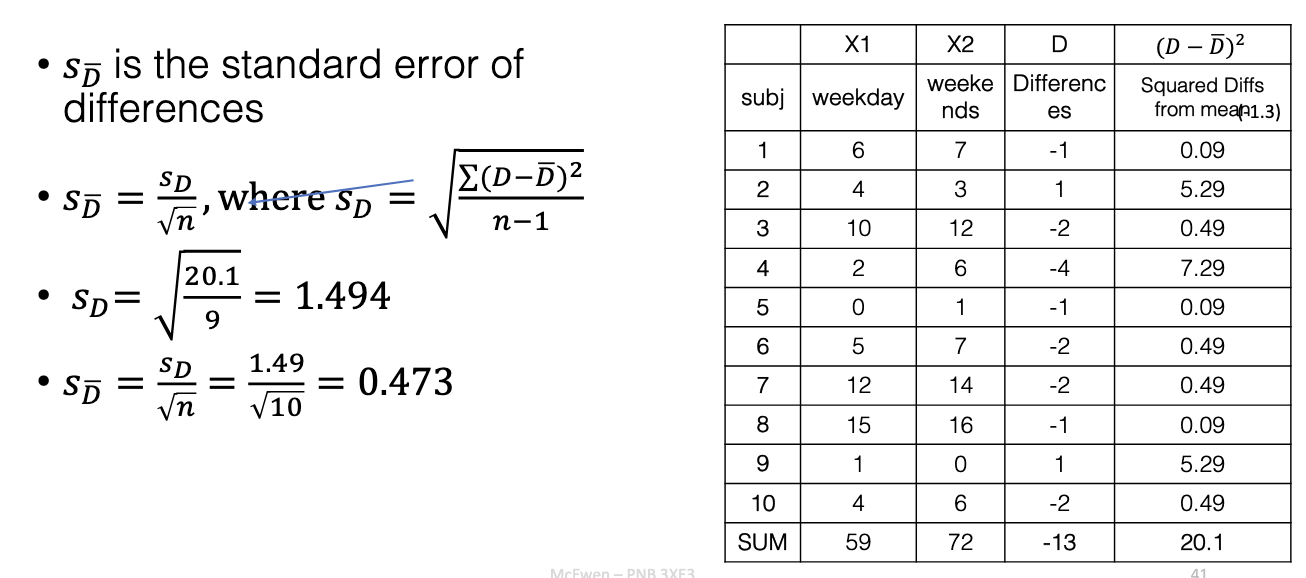
Why do related samples reduce random variability?
Example: Compare weekday vs. weekend TV in same kids.
Paired scores are correlated → cancels out baseline differences, leaving real changes clearer.
Ex: Subjects 1 & 5 have same trend (increase of 1 despite their baselines being very different)
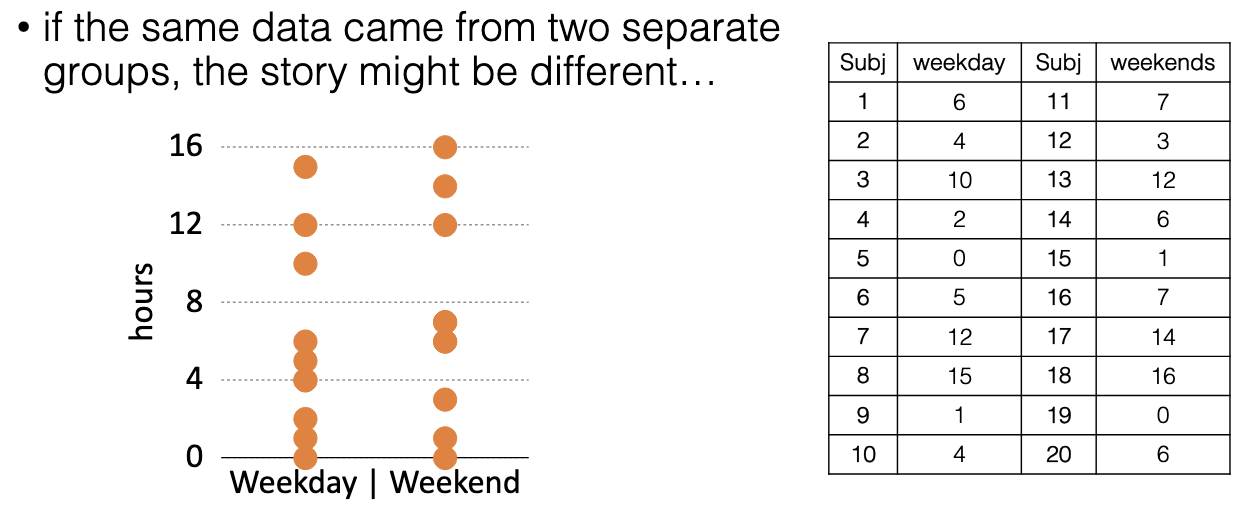
What happens if the same data came from two independent groups instead of related samples?
If the same data instead came from two completely separate groups, the natural differences between individuals would add extra variability.
That extra variability could hide real effects, making it harder to detect significant differences.
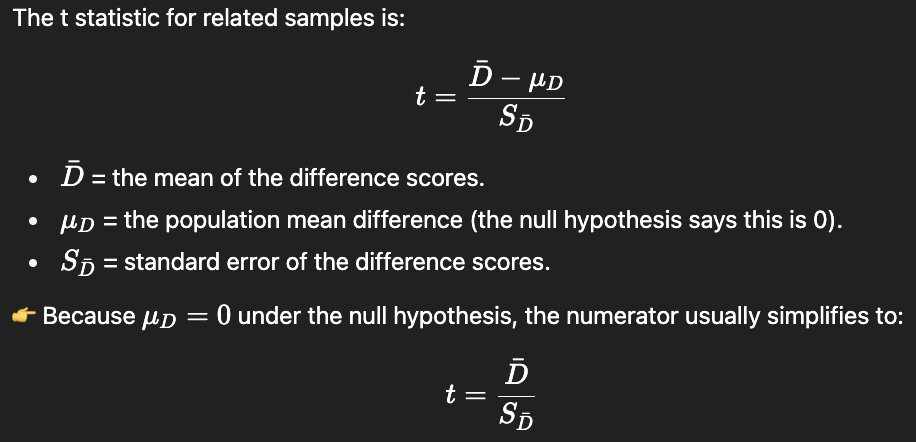
How does a t-test work for two related samples?
Uses difference scores (D = score1 – score2).
Then treat differences like a single-sample t-test.
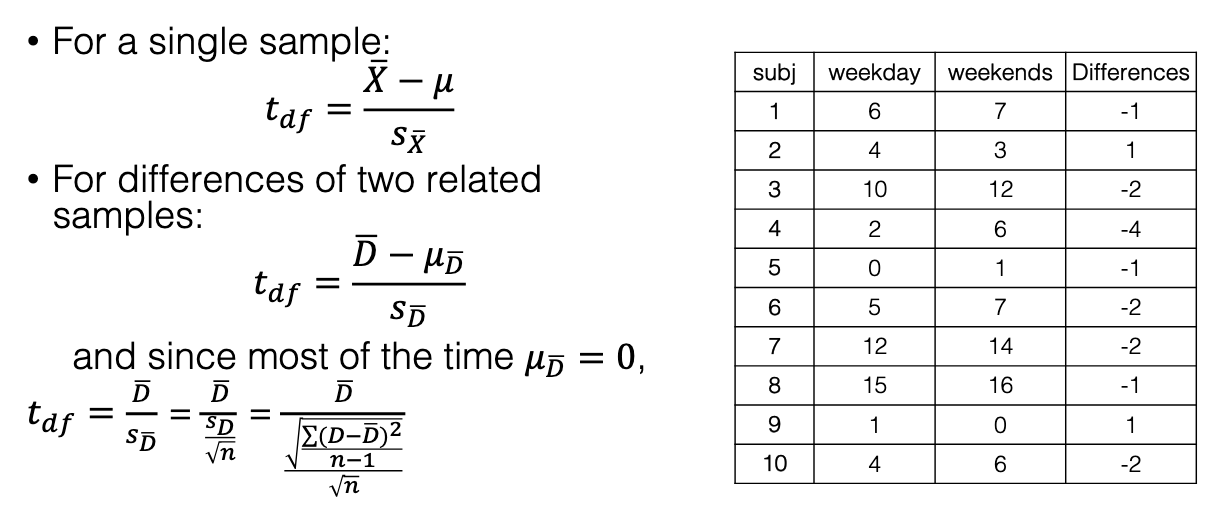
What is D and how is it used?
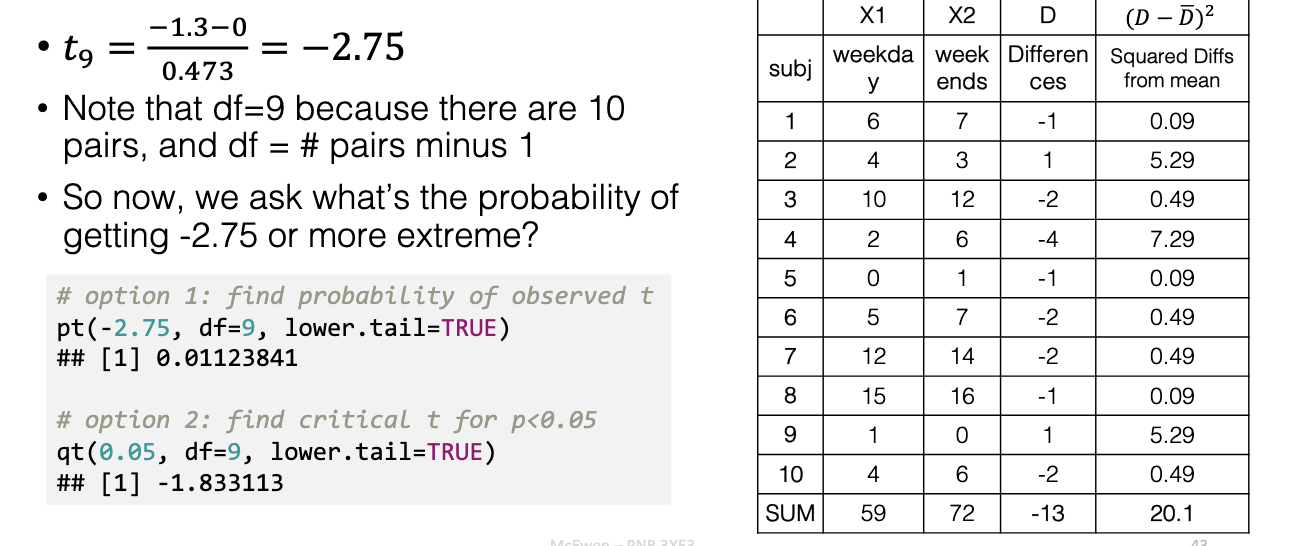
How do you calculate df for related samples t-test?
df = # of pairs – 1.
Example: 10 pairs → df = 9.
What conclusion was reached about TV watching?
tobs = −2.75
p = 0.011(the probability of getting -2.75 or more extreme)
tcrit= −1.83 (critical t value for p<0.05)
Reject H₀ → kids watch significantly more TV on weekends.
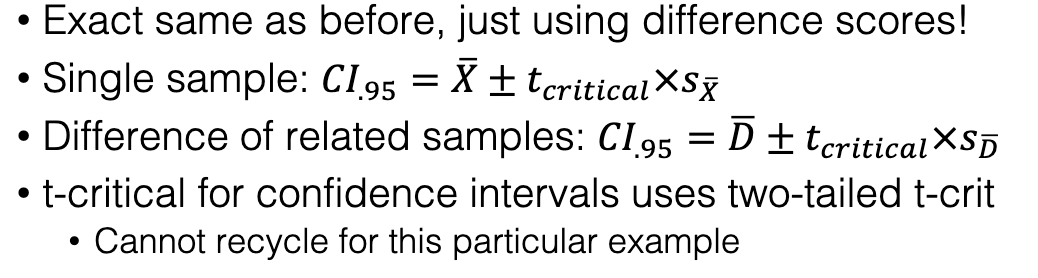
How do you calculate CIs for related samples?
Same formula as single sample, but with difference scores:
What are examples of poor statistical practices in t-tests?
“P-hacking”: choosing analysis after seeing data.
Switching direction of one-tailed test after checking sign of test statistic (+/-)
Good practice: plan H₀ and H₁ before collecting data.
Most real-world t-tests = two-tailed.
Why isn’t significance always a good outcome?
Depends on context.
Example: High vocabulary score = good.
Example: High liver enzyme (significant difference) = bad.
Researchers should not “hope” for results → avoid bias.
What are advantages of related samples designs?
Controls for between-subject variability (↑ power).
Reduces confounds between participants.
Recruitment: twins, matched groups, or pre-screening.
Trade-off: may reduce generalizability compared to random samples.
What are disadvantages of related samples designs?
Order effects: performance changes due to test order. Controlled with counterbalancing.
Carry-over effects: earlier trials influence later ones (e.g., practice, drug effects).
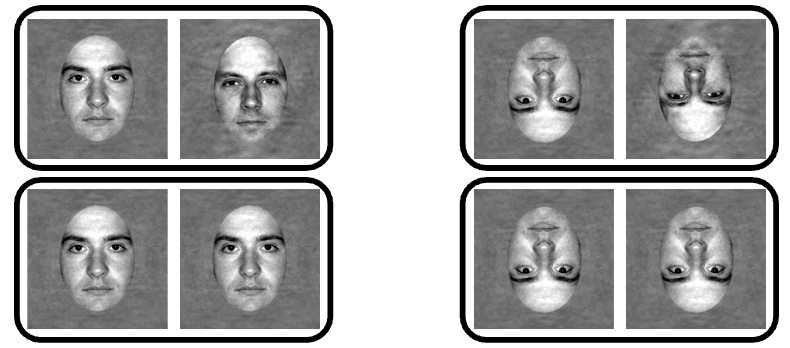
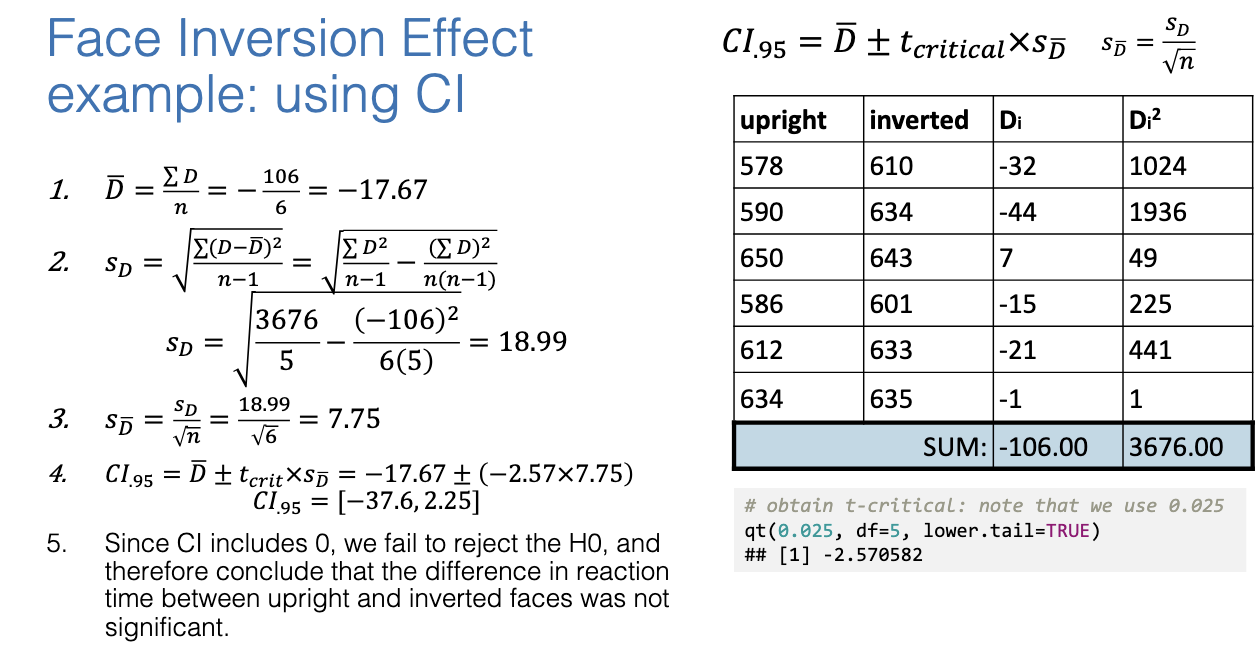
What is the Face Inversion Effect experiment?
Task: Decide if two faces (upright vs inverted) are same or different.
DV = reaction time (RT).
Hypothesis: RTs will differ between upright vs inverted faces.
H₀: RT to inverted and upright faces are the same.
RT for inverted = upright (no difference).
H₁: RT to inverted faces will be different that upright.
RT for inverted ≠ upright (difference exists).
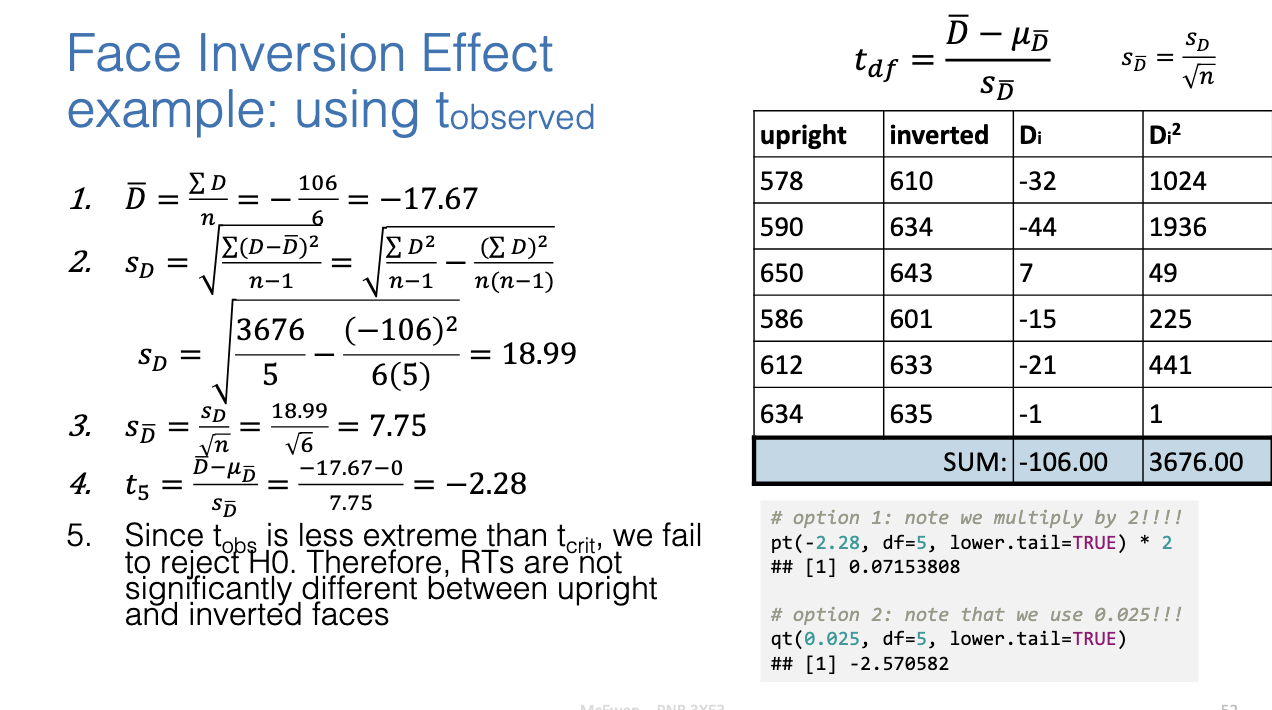
How do we test the Face Inversion Effect using t?
Compute tob from difference in means and SE.
Compare tobs to tcrit to test significance.
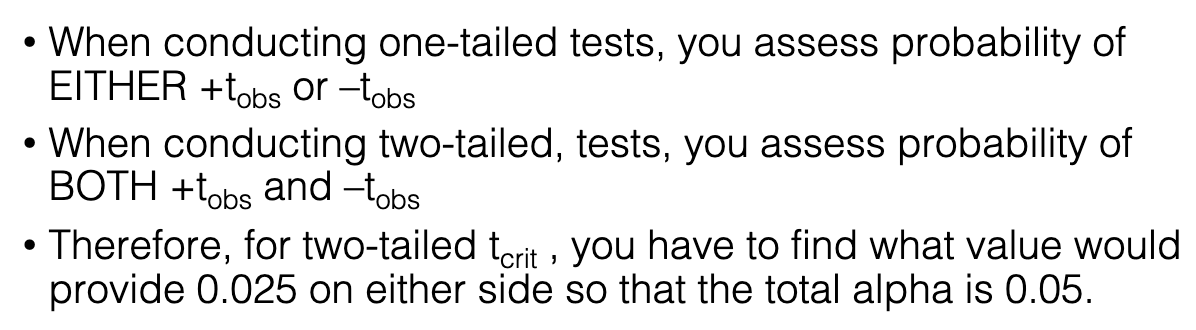
What’s the difference between one-tailed and two-tailed tests?
One-tailed: only test one direction (positive OR negative difference).
Two-tailed: test both directions (positive AND negative).
Two-tailed: need tcrit values at 0.025 each side (total alpha = 0.05).
What did the confidence interval show in the Face Inversion Effect?
CI included 0 → fail to reject H₀.
Conclude: no significant difference in RT between upright and inverted faces.
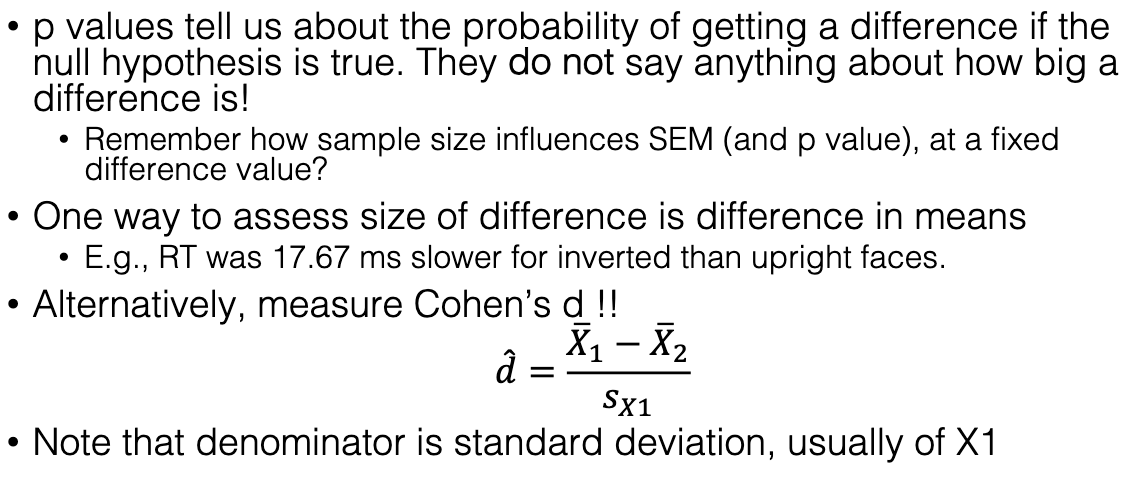
Why use effect size in addition to p-values?
p-value = probability of getting a difference if H₀ is true.
Does NOT measure size of effect.
Effect size (e.g., Cohen’s d) = standardized measure of difference magnitude.
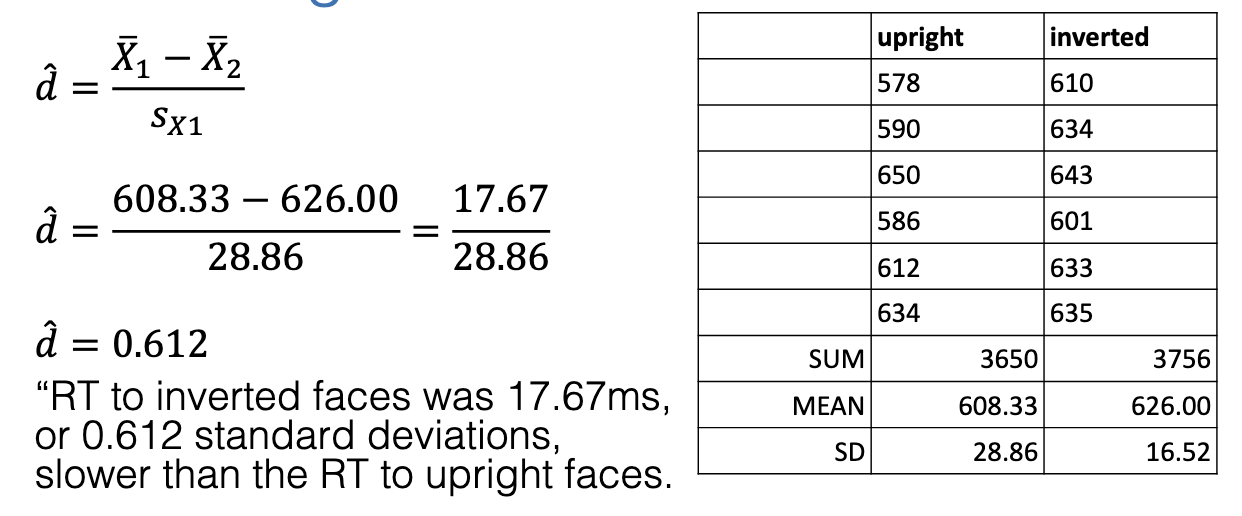
What was the effect size in the Face Inversion Effect?
Difference = 17.67 ms slower RT for inverted faces.
Cohen’s d = 0.612 (medium-large effect).
RT to inverted faces was 0.612 SD slower than the RT to upright faces.
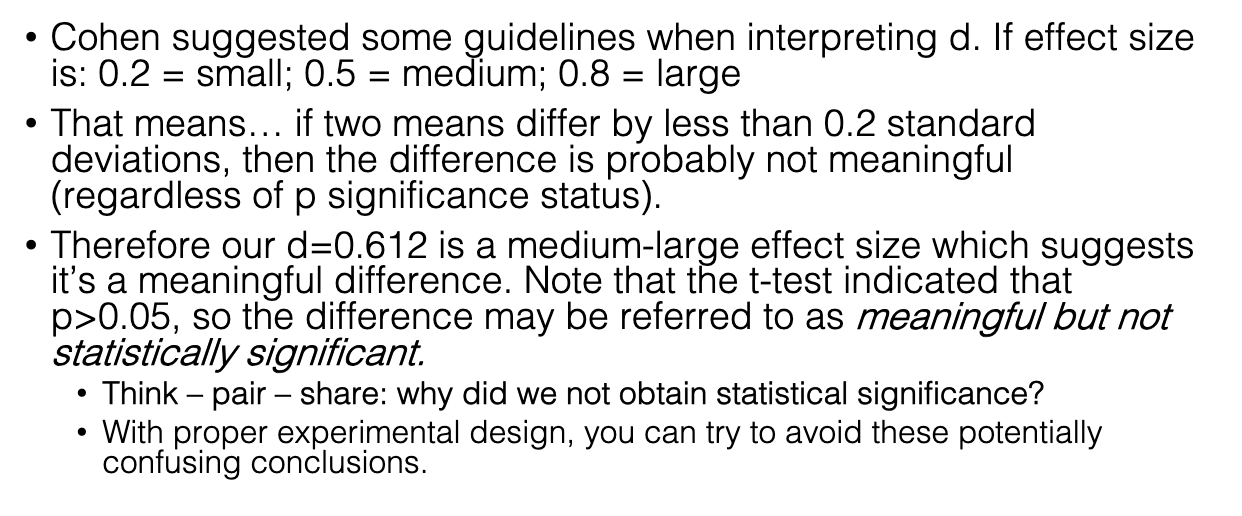
What are Cohen’s guidelines for interpreting d?
Small = 0.2, Medium = 0.5, Large = 0.8.
In example: d = 0.612 → medium-large, meaningful difference.
BUT p > 0.05 → meaningful, but not statistically sig