Decision Making to Improve Marketing Performance (3.3)
1/25
There's no tags or description
Looks like no tags are added yet.
Name | Mastery | Learn | Test | Matching | Spaced | Call with Kai |
|---|
No analytics yet
Send a link to your students to track their progress
26 Terms
Stratified Sample
Groups are taken into account and a proportion of each group will be sampled.
Marketing Mix Influences
Product lifecycle
Boston matrix
Type of product
Marketing objectives
Target market
Competition
Positioning
Extrapolation
Predicting future trends based on existing data.
Confidence Interval
% Probability that an estimated range of values has the actual value being estimated.
Marketing objectives
Sales volume and sales value
Market size
Market and sales growth
Market share
Brand loyalty
Primary Market Research
Collecting data yourself so that the business can get qualitive data and quantitative data.
Secondary Market Research
Collecting information that already exists can cost money or could be free. Usually quantitative data.
Qualitive Data
Words.
Quantitative Data
Numbers.
Random Sample
Selecting data randomly without any bias.
Quota Sample
Mimic the characteristics of a market, example sampling males who are over 50 years old.
PED
Price elasticity of demand (IGNORE MINUSES) - Measures the relationship between demand and price. (%change in demand/ %change in price)
Elastic: x>1 Example: Clothing, Explanation: As price increases people will buy different items as price decreases people will buy more of it.
Inelastic: x<1 Example: Fuel, Explanation: If there is a change in price people will still have to purchase the product so it would not affect demand.
Unitary: x=1
YED
Income elasticity of demand - Measures relationship between demand and change in real income. (%change in demand/ %change in income)
Necessities: 0<x<1 Example: Fresh fruit, Explanation: Nothing will happen as income rises due to people still needing fresh fruit.
Luxury: x>1 Example: Cars, Explanation: As income rises people will buy more luxury cars.
Inferior: x<0 Example: Own brand items, Explanation: As income rises people will buy more branded goods then own branded.
7P's
Price - Skimming, penetration, cost-plus, loss leader, competitive pricing
Promotion - Promotional mix
Place - Distribution decisions
Physical environment - What customer senses
Product - Boston matrix, product lifecycle
People - Staff
Process - What the customer has to do from start to end
Price Skimming
Start high then go lower.
Price Penetration
Start low.
Cost-Plus Pricing
% Mark up of the cost.
Loss Leader Pricing
Set low price to attract customers to other products.
Competitive Pricing
Match the price of other competitors.
Promotional Mix
Advertising
Sales promotion + Merchandising - Discounts/Incentives
Personal selling
Public relations/Publicity/Sponsorship - Activities that build reputation
Direct marketing - Mail/E-Mail/Phone
Segmentation
Demographic - Age, gender,...
Geographic - Where consumers live.
Income - Disposable income
Behavioural segmentation - Behaviour patterns
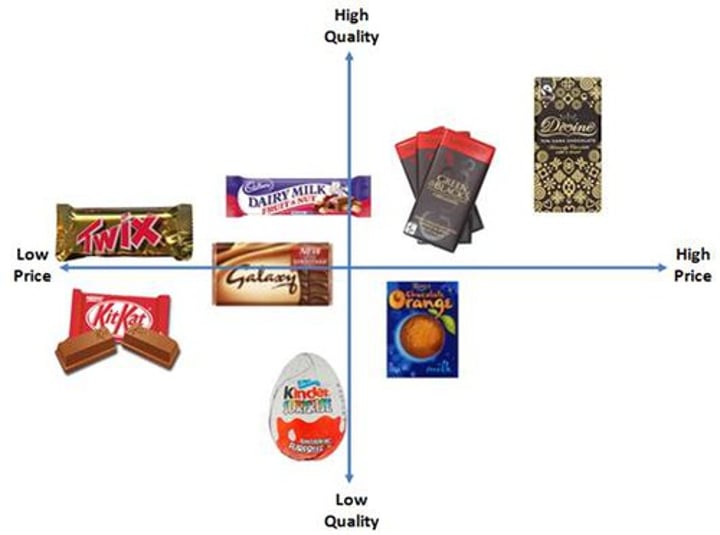
Positioning
Making the product clear, distinctive, and desirable place relative to competing products in the minds of target consumers.
Market Mapping
Used when the business is positioning its product.
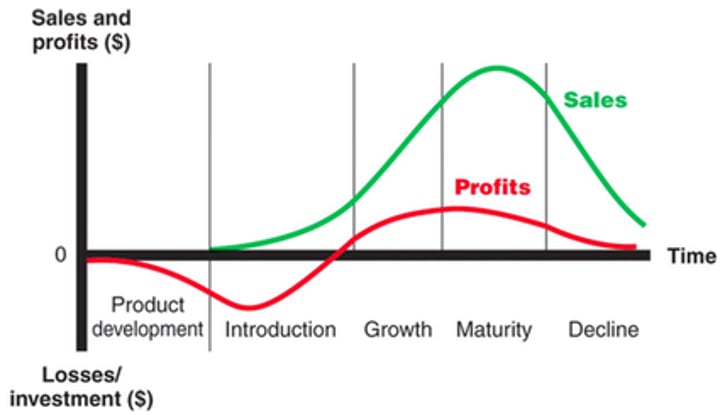
Product Life Cycle
E-Commerce
Buying/Selling goods over the internet.
Multichannel Distribution
Producer sells their products in other ways than directly to the customer such as apple having retail stores, online stores, and retail partners.