Biostats- Study design
1/20
There's no tags or description
Looks like no tags are added yet.
Name | Mastery | Learn | Test | Matching | Spaced | Call with Kai |
|---|
No analytics yet
Send a link to your students to track their progress
21 Terms
What are the two categories of study design ?
Observational and experimental studies
What are experimental studies ?
Exposure/treatment is controlled by researcher
Replication: same treatments assigned to diff samplings units to asses variation in responses
Control (placebo): experimental unitsg iven no treatment or a standard treatment for comparison purposes.
Blinding: participants or researchers are unaware of treatment assignments to reduce bias
Desirable but not always possible
Randomization: random assignment of participants to different groups to ensure comparability between them to asses casuality
*strong case for causation
What are observational studies >
Exposure/treatment not controlled by researcher, rather collected data from existing situation (does not interfere w processes/system)
-no randomization needed
-imbalances btwn exposure/treatment groups done through data analysis
*strong case for confounding
What is confouder ?
A variable that is related to both the exposure and outcome, potentially leading to a spurious association in observational studies.
Intervening variable: only associated w one or the other
What are variables needed to take into account when determining causality ?
association due to chance (sampling variability)
bias
confounding
Bradford hill for inferring causality
o Strength of association: too strong to be explained otherwise?
o Consistency: is it consistent with other studies?
o Specificity: Is exposure associated with specific, expected outcomes versus numerous outcomes?
o Temporality: Is the time sequence consistent with causality?
o Biological gradient: Is there evidence of a dose-response relationship?
o Plausibility: Is it biologically plausible?
o Coherence: agreement between epidemiological and laboratory findings
o Analogy: agrees with observed effects of similar risk factors
o Reversibility: does removing exposure remove the disease?
Rank study designs from highest to lowest level of evidence ?
Systematic reviews and meta-analyses
Randomized controlled trials (RCTs)
Cohort studies
Case-control studies
Cross-sectional studies
Ecologic studies
Case reports and series
Case report studies
Detailed reports of the characteristics (symptoms, diagnosis, treatment, and follow-ups) of individual patients. Used to highlight novel diseases, unique cases, or unexpected outcomes.
CONS: no controls, no replicates, cannot make causal inference, small numbers means insignificant patterns
PROS: described new disease/phenomenon, first step to a better designed study
Ecologic studies
Studies that investigate relationships bwtn exposure & outcome at the population level (NOT individual level) using aggregate data.
CONS: relates data about distinct populations, can’t compare individuals so we cannot accurately reflect correlations
PROS: compare larger units, uses existing data to evaluate hypothesis, can find links btwn risk factors and health outcomes in advance to laboratory approaches
Cross-sectional studies
Analyzes data from a specific population at a single point in time. These studies assess the prevalence of outcomes and compares exposures but do not establish cause-and-effect relationships.
CONS: shows association, not causation, outcome & exposure measured at same time so hard to tell whether exposure preceded outcome
PROS: relatively quick and inexpensive to conduct, useful for generating hypotheses, and can assess multiple outcomes at once
Case control studies
Observational studies that compare individuals with a specific outcome (cases) to those without it (controls) to identify risk factors or causes.
CONS: cannot estimate prevalence/risk, often has more controls than cases, possible bias in terms of evaluating exposure
PROS: minimizes confounding, allows for exploration of multiple exposures, efficient for rare outcomes, low cost
What can/cannot be estimated from case control studies
Cannot: prevalence or incidence rates
Can: risk exposure associated btwn exposures and outcomes, odds of exposure associated btwn exposures and outcomes, A VALID ODDS RATIO
What are odds ? Statistical odds ?
Chance of winning/ chance of losing
Statistics: odds: p / (1-p)
Chance of probability of event = p
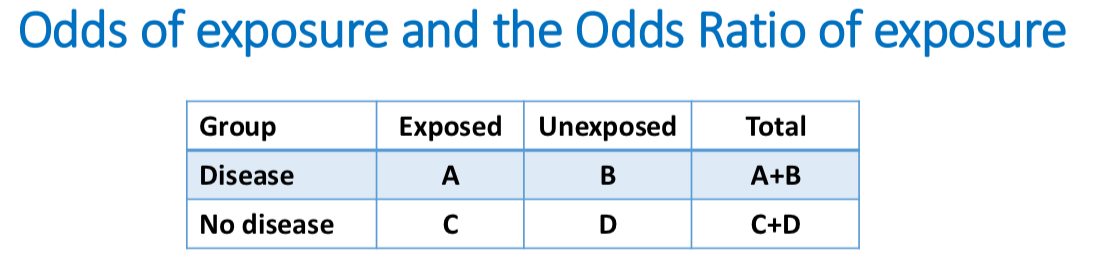
ODDS RATIO: odds of exposure among those w disease/ odds of exposure among those without disease
Odds ration EX
Odds of exposure among those with disease = 𝐴/(𝐴+𝐵) / 1− (𝐴/(𝐴+𝐵))= A/B
Odds of exposure among those without disease = 𝐶/ (𝐶+𝐷)/ 1 − (𝐶/(𝐶+𝐷)) = C/D
Odds ratio of exposure, comparing disease to no disease = (𝐴/𝐵)/ (𝐶/𝐷) = (𝐴/𝐵) / (𝐶/𝐷) = 𝐴/𝐵×𝐷/𝐶
Odds ratio (of exposure) = A×D/B×C (odds ratio is also called the cross-product ratio)
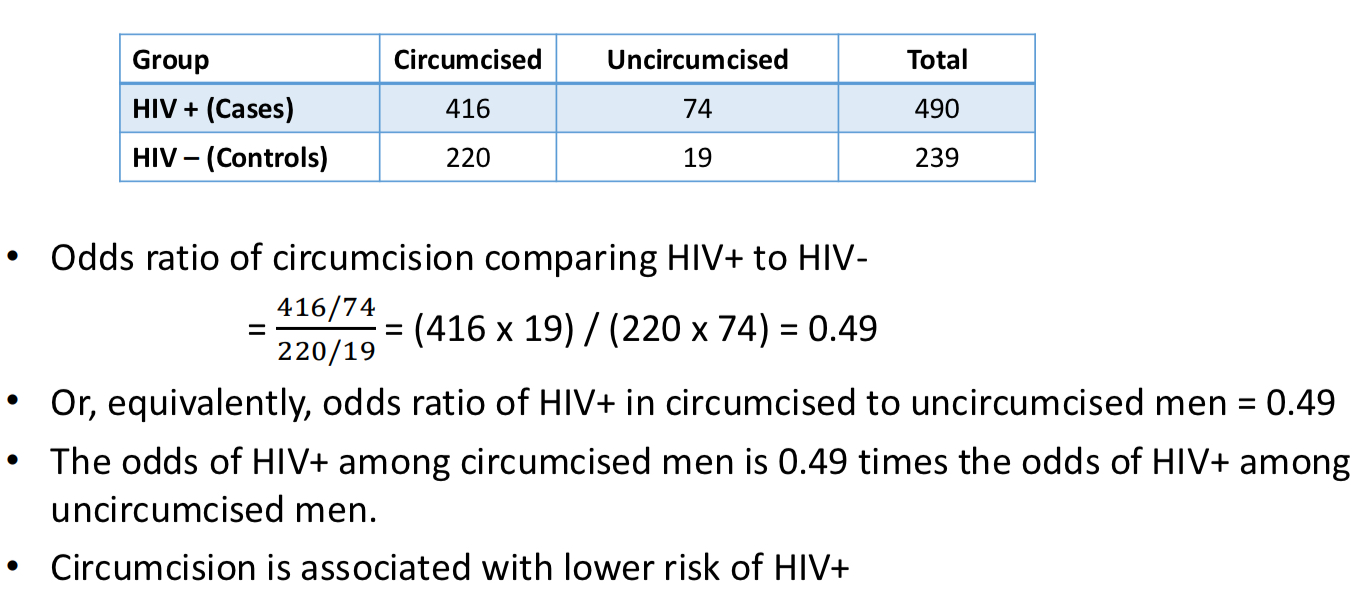
Case control odds ration example
Odds ration vs relative risk
o OR < 1 if and only if RR < 1
o OR > 1 if and only if RR > 1
o OR = 1 if and only if RR = 1
if RR < 1, then OR ≤ RR < 1
if RR > 1, then 1 < RR ≤ OR
*if outcome is rare, odds ration approximates relative risk
Cohort studies
Subjects are followed(follow-ups) over time to determine the outcome based on exposure status. Participants are grouped based on whether they were exposed to a particular risk factor.
PROS: reduced bias in exposure, time of exposure/disease is clear
CONS: more time-consuming, expensive to conduct, potential for loss to follow-up, inefficient for rare diseases, potential for confounding
Randomized clinical trials
A study design where participants are randomly assigned to receive either the treatment or a placebo/control. This method reduces bias and allows for direct comparisons of treatment effects.
PROS: more complex analyses can be done(IR & CI), protects against confounding being associated w exposure, can examine multiple outcomes, allows for casual inference, timing of exposure and outcome is clear
CONS: high cost, ethical concerns, participant bias/recruitment may limit, cannot do an RCT to show harm
Why have randomized clinical trials failed before ?
Poorly concealed randomization, lack of blinding, poor deliver of intervention, loss to follow-up
Meta analysis studies
A statistical technique that combines results from multiple studies to identify patterns, trends, or effects. It provides a more comprehensive understanding of an effect or outcome by aggregating data across various studies.
PROS: provides more precise estimates, understands sources of variation in study results
CONS: possible publication bias, subjectivity in decided which studies to include
What is a forest plot ?
A graphical representation used in meta-analysis to display the point estimates and confidence intervals of individual studies, as well as the overall pooled estimate.