Financial Statement Analysis [LECTURE]
1/39
There's no tags or description
Looks like no tags are added yet.
Name | Mastery | Learn | Test | Matching | Spaced | Call with Kai |
|---|
No analytics yet
Send a link to your students to track their progress
40 Terms
Generally about Ratio Analysis
A further step after basic financial document analysis, based on examining relationships among balance sheet and profit/loss account elements.
Drawback of Ratio Analysis
Balanced and purposeful selection of indicators can often be troublesome,
A full picture of the situation requires enriching it with other analytical instruments,
Based solely on past enterprise data.
Classification of ratios
Financial Liquidity Ratios, Debt Analysis, Activity Analysis, Profitability Analysis
Financial Liquidity Ratios
provides information on the coverage of current liabilities of the enterprise by current assets
Generally about Debt Analysis
Indicates the extent to which an enterprise finances itself versus using external sources, highlighting long-term solvency and supplementing financial liquidity analysis. It also reflects the company's ability to service debt (pay interest).
Activity Analysis
determines the ability of an enterprise's assets to generate sales revenues
Profitability Analysis
measures the relation between the profit generated by a company and its revenues, assets and capital invested
Financial Liquidity Analysis
Maintaining financial liquidity is crucial, as a profitable enterprise without it risks quick market elimination.
Financial Liquidity Analysis can be described as:
a positive money balance, a property of assets to be converted back into money, the ratio of covering liabilities with assets, a possibility to cover the company's liabilities at any time.
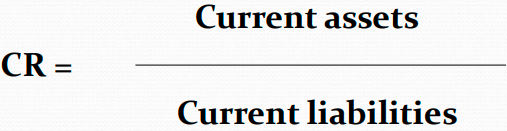
Current Ratio
It ranges <1.5; 2.,0>, everything below the lowest value is considered a serious risk.
Current assets should exceed the value of current liabilities but still be in a range of <0.5; 0.75>
Current Ratio Interpretation
At the end of [YEAR_1], in the analysed company current assets covered current liabilities by [NUMBER_1].
At the end of [YEAR_2], current assets covered current liabilities by almost [NUMBER_2].
This is called excess liquidity. In 2018 the value was almost 2 times too high. it's an unfavourable phenomenon of excessive freezing of assets in their current part (inventory, cash) increasing from year to year.
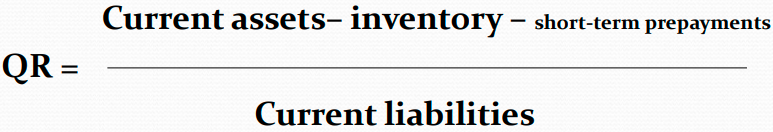
Quick Ratio
Its main range is recognised as <1.0>.
Indicates whether or not the company can pay its current liabilities.
The optimal value may differ depending on the industry.
Quick Ratio Interpretation
“At the end of [YEAR_1], we could repay [NUMBER_1] of current liabilities with cash and equivalents (approx. 2.8 times).
At the end of [YEAR_2], [NUMBER_2] of current liabilities could be repaid using more liquid assets.
The value was about [% of NUMBER_1/NUMBER_2] times higher than the reference value in both periods and increasing, which was unfavourable.“
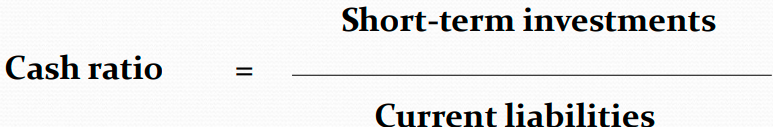
Cash Ratio
It represents the relation of assets with the highest degree of liquidity to current liabilities
It expresses how much of the company's short-term liabilities can be paid off immediately if there is a need to settle at short notice.
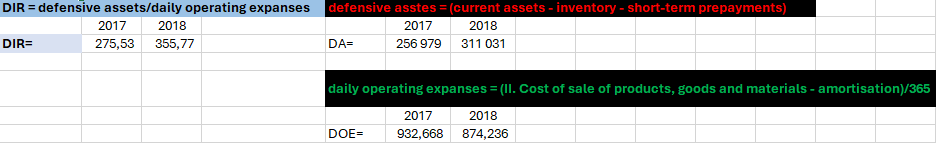
Diverse Internal Ratio
Interpretation:
"The company could operate without using its non-current assets for 276 days in 2017 and 356 days in 2018. The company became more independent in short-term financing."
Generally about Financing Ratios
used to identify the sources of financing of an enterprise - their structure, level of debt, debt service ability, and thus assessing creditworthiness
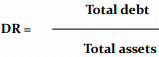
Debt Ratio
It shows the ratio of total liabilities to total assets, indicating the share of debt in financing the company's assets.
Safe in 0.5 <0.57 - 0/67>, danger > 0.75
A higher ratio is better, but only if increased debt improves return on equity.
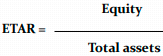
Equity to Total Assets Ratio
A safe situation here means a ratio value of about 0.5 (sometimes 0.6 is given),
The risk of insolvency is too high when it reaches 0.25
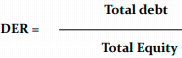
Debt to Equity Ratio
The value of the above ratio is equal to one, it means that the balance of the company's own and debt sources of financing (compliance with the 'golden rule of financing').
However, in small companies is considered as too risky - it is recommended to maintain proportions within <1; 2>, and even <1; 3>
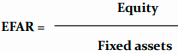
Equity to Fixed Assets Ratio
The value of the ratio meed to be at least 1
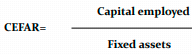
Capital Employed to Fixed Assets Ratio
Capital employed = equity + long-term liabilities
Ratio value greater than 1, which corresponds to a broader - more modern approach to the golden balance sheet rule, also known as the silver balance sheet rule
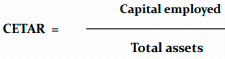
Capital Employed to Total Assets Ratio
Capital employed = equity + long-term liabilities
It shows what is the share of long-term capital in financing an enterprise’s assets.
The higher the share of capital employed in financing, the higher the level of financial security
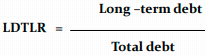
Long-term Liabilities (DEBT) to Total Liabilities Ratio
It should increase over time, which means later need for repayment of liabilities on average
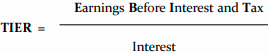
Time Interest Earned Ratio or Interest Coverage Ratio
Its high value, increasing over time, demonstrates the large and growing potential of the company to take new loans (one of the most important ratios of creditworthiness).
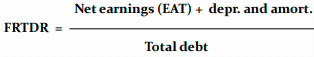
Financial Results to Total Debt Ratio
Other name for it Coverage of Liabilities from Financial Surplus
Shows the extent to which the company would be able to repay its debt with an actual financial surplus – a higher value of the ratio indicates a higher potential in terms of debt repayment
Turnover Ratios
Also called activity, rotation, efficiency or effectiveness ratios
Useful in short-term financial management of an enterprise due to the possibility of obtaining information about the length of cycles of individual components of current assets and current liabilities
They can also provide us with information on the effectiveness of managing all assets And its two main parts
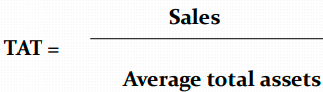
Total Assets Turnover Ratio
Also called the total asset productivity ratio
The value of this ratio says how many euros of income is generated by each euro of the company's assets.
The higher the value, the "faster" asset turnover (better use, higher productivity)
“In 2017, each euro of assets generated 81 cents of sales, in 2018 only 74 cents. Assets productivity decreased, negative trend.“
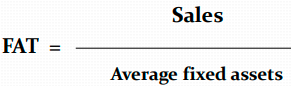
Fixed Assets Turnover
The efficiency of fixed asset utilization.
SALES = Net product sales (income statement) AND
AVERAGE FIXED ASSETS = (assets_n-1 + assets_n)/2
"In 2017, each Euro of fixed assets generated 1.49 cents in sales, dropping to 1.38 cents in 2018. A decline in fixed asset productivity indicates a negative trend."
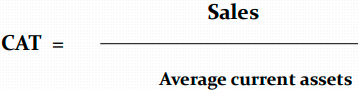
Current Assets Turnover Ratio
“In 2017, each Euro of current assets accounted for 1.76 cents of sales income, and in 2018 only 1.61. A decline in current assets productivity, turnover slowed down, a negative trend.“
Average Work Efficiency
After calculating the value of this ratio, one can find out how many euros of sales revenue is generated on average by one employee.
“In 2017, each employee generated (worked out) 586,256.73 cents in sales on average, and in 2018 only 526,519.77 cents. Labour productivity dropped, a negative trend.“
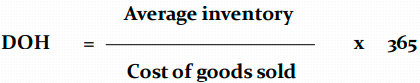
DAYS OF INVENTORY ON HAND
Provides information on how many days it takes for the company to replace its inventory.
The higher the value of the ratio, the slower the inventory turnover.
“In 2017, inventories were in stock on average for around 54 days, and in 2018 they exchanged completely on average every 66 days. The extension of inventory storage time means a decrease in inventory management efficiency - a negative trend.“
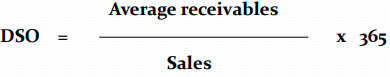
DAYS OF SALES OUTSTANDING (accounts receivables in days)
It's beneficial for an enterprise to collect receivables quickly.
"In 2017, the company collected receivables in about 122 days on average, and in 2018 in about 120 days. Shortening this time indicates improved efficiency in receivables management, a positive trend."
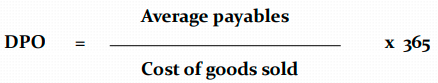
DAYS OF PAYABLES OUTSTANDING
Ideally, the company should negotiate the longest possible repayment period.
"In 2017 and 2018, the company repaid short-term liabilities after about 98 days, showing no change—a neutral trend."

CASH CONVERSION CYCLE
Working capital demand decreases as the liabilities cycle lengthens.
"In 2017, cash from sales tied up in materials was received after about 78 days, extending to 88 days in 2018. This 10-day increase indicates a decline in short-term financial management efficiency, a negative trend."
Profitability
A measure of economic efficiency.
Calculated as the ratio of profit to a given financial quantity of which profitability is determined.
The higher the profitability level, the better the company’s rating.
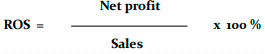
Return On Sales
Tells us what profit margin a given sales volume brings, which is why it is sometimes called the net profitability ratio.
“In 2017, each zloty of sales incomore generated over 20 groszy of net profit, while in 2018 only 14 groszy on the form of net profit remained from 1 zloty of sales. Decline in commericial profitability - negative trend.“
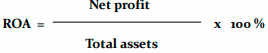
Return On Assets
The higher the value of the ratio, the more favourable the company's financial situation - the company manages its assets more effectively to generate profit
“In 2017, each zloty of assets generated approx. 15.5 groszy of net profit, while in 2018 only less than 10 groszy of net income, It's a decline in economic profitability - negative trend.“
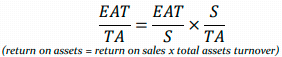
The equation shows that the same return on assets can occur as the result of a completely different sales policy:
quantity policy (low prices), characterised by low per-unit profitability, but correspondingly higher sales volume,
quality policy (high prices), characterised by high profitability and low asset turnover.
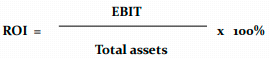
Return On Investment
This assesses the ability of assets to generate profit from core activities, excluding external factors like financing structure and taxes.
"In 2017, each zloty of assets generated over 0.12 PLN in operating profit, while in 2018, it was slightly over 0.12 PLN. Although the decline in operating profitability was less severe than the ROA, the trend remains negative."
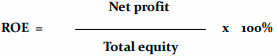
Return On Equity
A favourable trend is the increase in its value over time, demonstrating the good financial standing of the company.
The higher efficiency of equity creates opportunities for a higher dividend and further dynamic development of an enterprise.
“In 2017, the rate of return on capital engaged by the woners was 17.97%, and in 2018 only over 11.53%. Decrease in return on equity was quite significant - negtive trend.“