Unit 2- Demand and Supply
1/83
There's no tags or description
Looks like no tags are added yet.
Name | Mastery | Learn | Test | Matching | Spaced | Call with Kai |
|---|
No analytics yet
Send a link to your students to track their progress
84 Terms
Demand
Relationship between the various possible prices of a product and the quantities consumers are willing and able to buy.
Demand Schedule
A table showing how much of a good or service customers want to buy at different prices.
Demand Curve
A graph showing how much of a good or service consumers want at different prices; it is downward sloping.
Law of Demand
An inverse relationship between a product's Price (P) and the Quantity Demanded (Qd): as price increases, quantity demanded decreases (assuming all other factors are constant).
What are the reasons for the Law of Demand?
Substitution Effect
Income Effect
Law of Diminishing Marginal Utility
Substitution Effect
If the price of a product increases, consumers buy less of that product and more of a relatively cheaper alternative.
Income Effect
If the price of a product decreases, the consumer's purchasing power increases, allowing them to buy more.
Law of Diminishing Marginal Utility
As you consume more of one thing, the additional satisfaction (marginal utility) you get will decrease.
Ceteris Paribus
The assumption when reading a demand or supply curve that all outside factors are held constant.
Market Demand
The sum of all quantity demanded by all individual consumers in a market.
Change in Quantity Demanded
A movement along the existing demand curve, caused ONLY by a change in the product's price.
Change in Demand
A shift of the entire demand curve (left or right), caused by a change in one of the Determinants/Shifters of Demand.
What are the Determinants (Shifters) of Demand?
Prices of Related Goods (Substitutes, Complements),
Income,
Consumer Tastes,
Consumer Expectations,
Number of Consumers.
Substitute Goods
Two goods that are used in place of one another (e.g., Coke and Pepsi); if the price of one rises, the demand for the other increases.
Complementary Goods
Two goods that are bought and used TOGETHER (e.g., Buns and Hot-dogs); if the price of one increases, the demand for the other falls.
Normal Goods
As consumer income increases, demand increases; as income falls, demand falls (e.g., Cars, Seafood).
Inferior Goods
As consumer income increases, demand falls; as income falls, demand increases (e.g., Instant noodles, cheap goods).
Effect of an increase in the number of consumers on demand
An increase in the number of consumers increases demand (shifts the demand curve to the right).
Effect of expectations of a future price drop on demand today
Expectations of a future drop in price lead to a decrease in demand today.
Supply
Relationship between the various possible prices of a product and the quantities businesses are willing to supply.
POSITIVE RELATIONSHIP
Law of Supply
A positive (direct) correlation between a product's Price (P) and Quantity Supplied (Qs): as price increases, supply will also increase (because of more profit incentive).
Supply Curve
A graph showing the relationship between price and quantity supplied; it is upward sloping.
Change in Quantity Supplied
A movement along the existing supply curve, caused ONLY by a change in the product's price.
Change in Supply
A shift of the entire supply curve (left or right), caused by a change in one of the Determinants/Shifters of Supply.
What are the Determinants (Shifters) of Supply?
Changes in Price of Inputs (Resources),
Changes in Seller Expectations,
Changes in Technology,
Government Actions (Taxes/Subsidies),
Number of Suppliers,
Changes in Price of Other Goods.
Effect of a decrease in input prices on supply
If the price of ingredients (inputs) decreases, it's cheaper to produce, which increases supply (shifts the supply curve to the right).
Effect of a government subsidy on supply
A government subsidy (payment supporting a business) increases supply (shifts the supply curve to the right).
Market Equilibrium
The point where the demand and supply curves intersect, and the Quantity Demanded (Qd) equals the Quantity Supplied (Qs).
Equilibrium Price (Market-Clearing Price)
The price where the intentions of buyers and sellers match, so the quantity demanded equals the quantity supplied.
Surplus
Occurs when the price is too high (above equilibrium), leading to excess supply (Qs>Qd).
Shortage
Occurs when the price is too low (below equilibrium), leading to excess demand (Qd>Qs).
Effect of an Increase in Demand (single shift)
Increases both the Equilibrium Price and Quantity.
Effect of an Decrease in Demand (single shift)
Decreases both the Equilibrium Price and Quantity.
Effect of an Increase in Supply (single shift)
Causes Equilibrium Price to decrease and Equilibrium Quantity to increase.
Effect of an Decrease in Supply (single shift)
Causes Equilibrium Price to increase and Equilibrium Quantity to decrease.
Double-Shift Rule
If both demand and supply curves shift simultaneously, either the equilibrium price or quantity will be indeterminate (unclear/depends on the relative size of the shifts).
Effect of Increase in Demand and Increase in Supply (double shift)
Equilibrium Price is indeterminate, Equilibrium Quantity increases.
Effect of Increase in Demand and Decrease in Supply (double shift)
Equilibrium Price increases, Equilibrium Quantity is indeterminate.
Elasticity
How sensitive a quantity (demanded or supplied) is to a change in price.
Price Elasticity of Demand (PED) Coefficient Formula
(% Change in Demand) /(% Change in Price)
Only look at the absolute value
Inelastic Demand
Quantity is insensitive to a change in price; consumers continue to buy; Coefficient is less than 1; steep demand curve.
Characteristics of Inelastic Goods
Few substitutes, necessities (e.g., gasoline, medicine), small portion of income, required now rather than later.
Elastic Demand
Quantity is very sensitive to a change in price; consumers buy much less if the price increases; Coefficient is greater than 1; flatter demand curve.
Characteristics of Elastic Goods
Many substitutes, luxuries, expensive goods (large portion of income), more time to decide.
How does an inelastic good's price change affect Total Revenue?
Price increase causes Total Revenue to increase; Price decrease causes Total Revenue to decrease (positive correlation).
How does an elastic good's price change affect Total Revenue?
Price increase causes Total Revenue to decrease; Price decrease causes Total Revenue to increase (opposite correlation).
Cross-Price Elasticity of Demand (Exy) and FORMULA
Measures how sensitive the quantity purchased of product X is to a change in the price of product Y.

Cross-Price Elasticity Coefficient Sign for Substitutes
Positive coefficient (direct relationship).
Cross-Price Elasticity Coefficient Sign for Complements
Negative coefficient (inverse relationship).
Income Elasticity of Demand (Ei) & Formula
Shows how sensitive a product's quantity is to a change in consumer income.
Income Elasticity Coefficient Sign for Normal Goods
Positive coefficient (direct relationship: income ↑, quantity ↑).
Income Elasticity Coefficient Sign for Inferior Goods
Negative coefficient (inverse relationship: income ↑, quantity ↓).
Price Elasticity of Supply (Es) Determinant
The key determinant is the TIME it takes suppliers to change the quantity supplied once the good's price changes → HOW FAST CHANGE PRODUCTION
Price Elasticity of Supply in the Short Run
Supply is typically inelastic because producers need time to adjust production.
Price Elasticity of Supply in the Long Run
Supply is typically elastic because producers have enough time to make adjustments to production.
Price Control
Government-set legal restrictions on how high or low market prices can go.
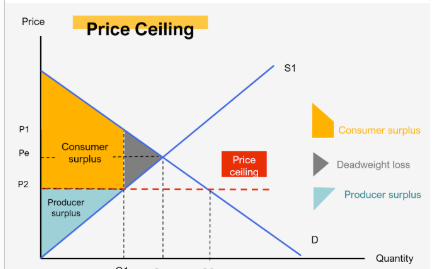
Price Ceiling
A MAXIMUM price sellers are allowed to charge; set BELOW equilibrium to be effective; creates a shortage; benefits buyers (theoretically).
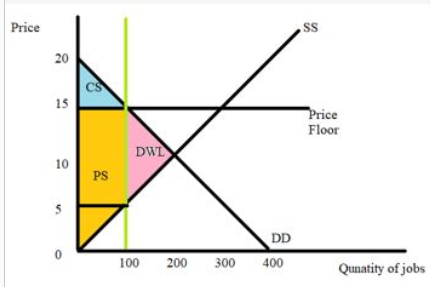
Price Floor
A MINIMUM price buyers must pay; set ABOVE equilibrium to be effective; creates a surplus; benefits sellers (theoretically).
Problem created by an effective Price Ceiling
A shortage (Qd>Qs), inefficient allocation of resources, and black markets.
INEFFICIENT RESOURCE: Too little being produced, people can’t get product
LOW QUALITY: Less incentive to innovate and maintain high quality
Problem created by an effective Price Floor
A surplus (Qs>Qd), inefficient allocation of sales among sellers, wasted resources, and black markets.
INEFFICIENT allocation of sales → Too many people making one thing and not other stuff people want
Consumer Surplus
The difference between what a consumer is willing to pay and what they actually pay.
Consumer Surplus = (Maximum Willing Price)-(Price Paid) → Area of Triangle
Producer Surplus
The difference between the actual price received and the minimum acceptable price they were willing to sell for.
Producer Surplus = (Price Received/ Revenue)- (Minimum Acceptable Price) → TRIANGLE AREA
Total Surplus (Welfare)
The sum of Consumer Surplus (CS) + Producer Surplus (PS); maximized at market equilibrium.
Deadweight Loss (DWL)
The loss of efficiency (and total surplus) when the market produces at any level other than the equilibrium quantity, often due to price controls or other inefficiencies.
Determinant of Elasticity of Demand
Substitutability
Proportion of Income
Luxuries vs Necessities
Time
Substitutability (Elasticity Demand)
People have option to buy other stuff
The more NARROWLY a product is defined, the GREATER ELASTICITY
COKE has lots of substitutes but POP has little
TIDE has other detergents to substitute but DETERGENT has little
Proportion of Income (Elasticity Demand)
Higher price of a good relative to consumers income means greater elasticity
Car Vs Coffee → If a car increases like 50% in price, you probably won't but it
Luxuries vs Necessities (Elasticity Demand)
The more the good is a LUXURY, greater Elasticity
People don’t need it so if its like a lot more expensive → Do u really need it
Time (Elasticity Demand)
Demand is more elastic the LONGER the time period under consideration
LONG-TERM: People have more time to adjust to price changes & have more options → Elastic
SHORT-TERM: People have less time to make choices and seek alternatives → Inelastic
Price Elasticity of Supply
Shows how sensitive producers are to a change in price
Based on time limitations → Producers need time to produce more

Deadweight Loss & Price Ceilings
Price ceiling sets (Qc) →Intersection with Suppl
At that price, only a certain amount is supplied → Deadweight loss is the people who couldn't buy
Surplus that is LOST DUE TO PRICE CONTROL
Deadweight Loss & Price Floor
Price Floor sets Quantity Consumed (Qf)
At that price only a certain amount gets Traded
Only a certain amount gets SOLD to the consumer → Not enough people buy
Amount not sold is deadweight loss
Characteristics of Elastic and Inelastic SUPPLY
Characteristics of Inelastic Supply | Characteristics of Elastic Supply |
|
|