evolution exam 4
1/77
There's no tags or description
Looks like no tags are added yet.
Name | Mastery | Learn | Test | Matching | Spaced | Call with Kai |
|---|
No analytics yet
Send a link to your students to track their progress
78 Terms
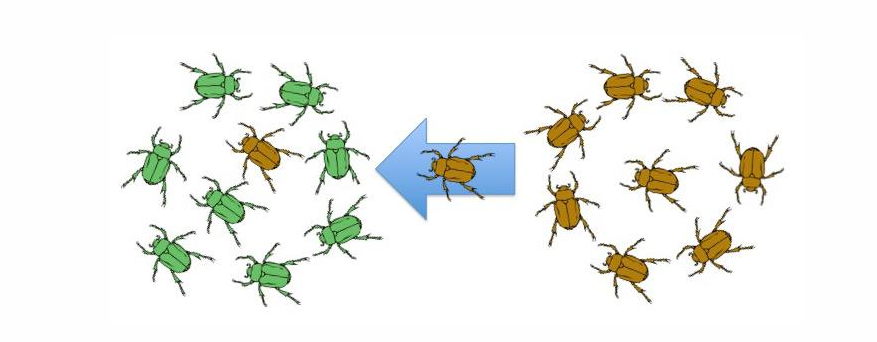
gene flow
transfer of genetic material between pops
migration, pollen, horizontal gene transfer
gene flow/migration allele frequencies
calculate initial (pre-migration) genotype/allele frequencies
calculate post migration genotype/allele frequencies based on # of migrants and their genotype frequencies
continent-island model
assume one way movement from a large population to a smaller population on an island
continent-island migration equation
frequency of A1 on island = p
frequency of A1 on continent = pm
proportion of island pop who are migrants from the continent (migration rate) = m
frequency of A1 on the island after migration = p*
p*= mpm + (1-m)p
change on island from one generation to the next
Δp = p* - p = mpm + (1-m)p-p
Δp = m(pm-p)
equilibrium
allele frequency on the island will be the same as it is on the continent
p = pm
clines
continuous change in allele frequency in space
hardy-weinberg principle
allele/genotype frequencies in a population will remain the same from one gen to gen in the absence of other evolutionary influences
gene flow homogenizing populations
gene flow includes exchange of alleles
equalization of frequencies across different populations
counteracting divergence like genetic drift and natural selection
FST , allele frequencies and variance
FST = 0 means no genetic differentiation between populations (interbreeding and share genetic material)
FST = 1 means complete genetic differentiation (pops are completely isolated, share no genetic diversity)
dispersal reasons
ephemeral (TW) habitat
get away from relatives (competition or inbreeding)
no dispersal
not possible
no suitable habitat
energetic costs
random factors in evolution
mass extinction
mutation
genetic drift
mass extinction
results from random occurrences (asteroid and volcanoes)
mutation
random process that gives rise to new alleles each generation at constant rate
adds allelic diversity; affects alleles frequencies at a given locus
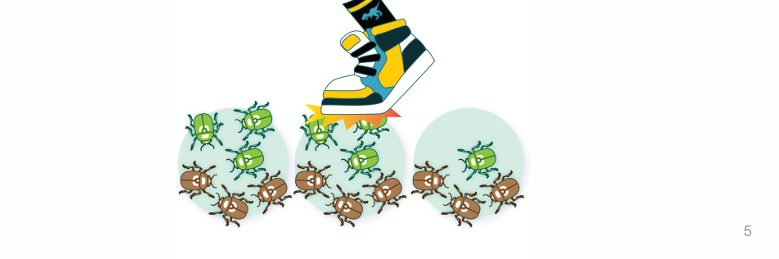
genetic drift
random changes in allele frequencies or genotypes within a population due to sampling from a limited population
reduces allelic diversity; affects allele frequencies at all loci in the genome
why does a genetic drift happen?
population are not infinite, sampling error randomly changes allele frequencies
does genetic drift work better in small or larger pops?
it is faster, more efficient small pops
with more time, it can be drastic in large pops
can genetic drift fix/lose alleles
in the absence of other evolutionary forces, drift causes the eventual fixation or loss of allele
the probability that an allele will eventually go to fixation is the same as the frequency of that allele in the current pop
allele fixation probability equation
N = pop size
2N = number of alleles at locus A
x = initial number of copies of A1
what is the probability any 1 copy of these alleles will go to fixation? = 1/2N
what is the probability that allele A1 will go to fixation? = x(1/2N) = x/2N
equations for proportion of frequencies after generations
Hg+1 = Hg (1-(1/2N))
Hg+1 = expected heterozygosity in next gen
Hg = observed heterozygosity in current gen
Ht = H0 (1-(1/2N))t
effective population size (Ne)
smaller than census size
fewer individuals contribute to next generation’s genes than could
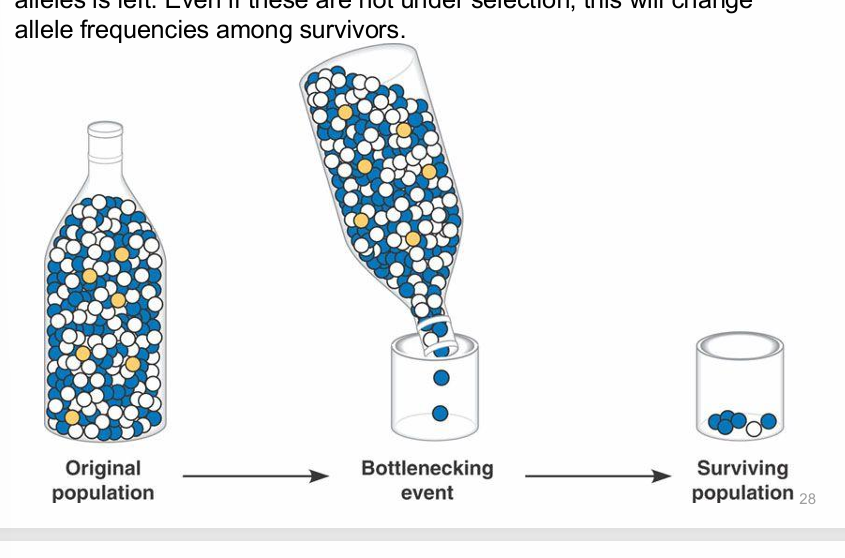
bottleneck effect
drastic reduction in the pop size due to random event, leaving a small sample of alleles left
founder effects
if a pop is founded by a smaller group of individuals, chance alone causes different allele frequencies in the new population
gene flow vs genetic drift
opposite effects on allele frequencies: drift lowers diversity and gene flow increases diversity
gene flow makes pops more similar to one another; drift makes them different
estimate allele frequency variation across populations
FST = (Het - Hes)/Het
Het is expected total heterozygotes
Hes expected heterozygotes from combined subpops
understand the balance between migration and drift
FST = 1/(4Nem+1)
Nem = ((1/FST) -1)/4
discrete genetics
traits with a limited number of phenotypes that fall into distinct categories
ex one gene with 2 alleles
quantitative traits
combined effects of many loci produce quantitative traits and a continuous distribution
standard quantitative genetic model
framework for understanding complex traits influenced by many genes and the environment
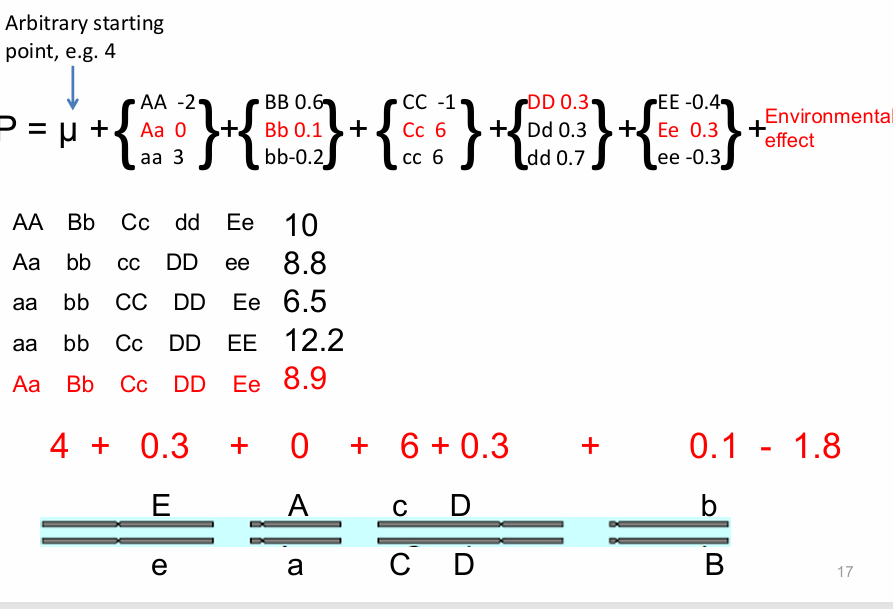
quantitative genetics
statistical analysis of traits controlled by many loci
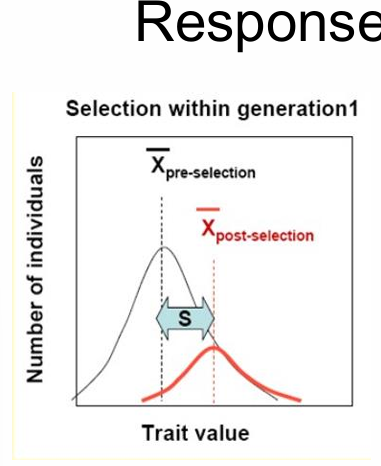
S, selection differential
trait mean of pop after selection - trait mean of pop before selection
quantifies how trait distribution of the current population is affected by selection
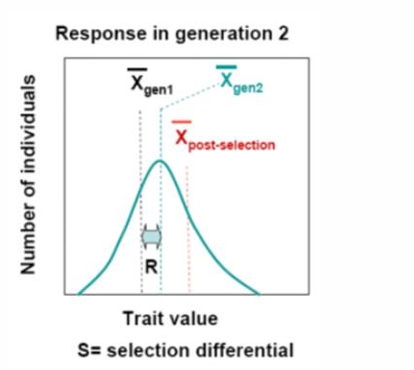
R, response to selection
R=S x H2
quantifies the difference between the phenotypic distribution of the original population and the next generation
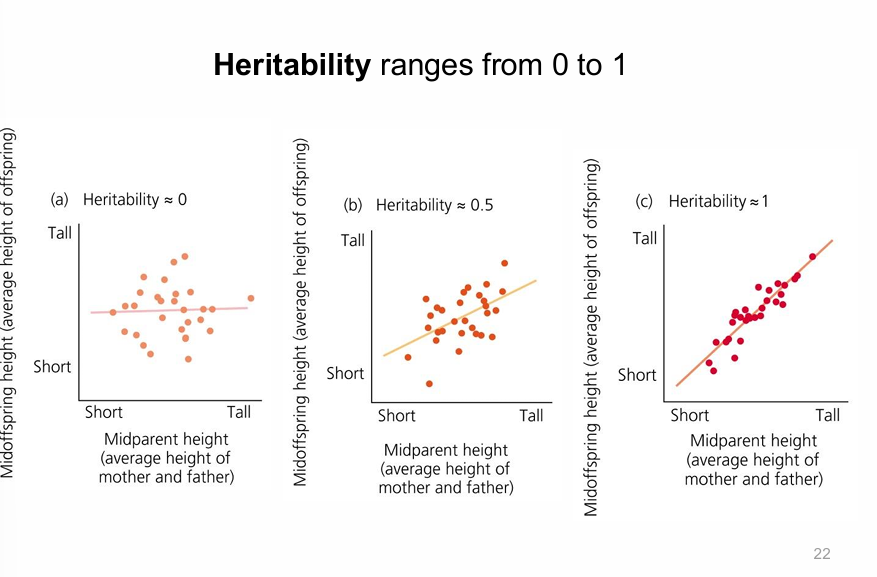
how to measure heritability?
common garden experiment
parent offspring regression and slope line
heritability range
H2=0 means no heritability
H2=0.5 means little heritability
H2=1 means strong heritability
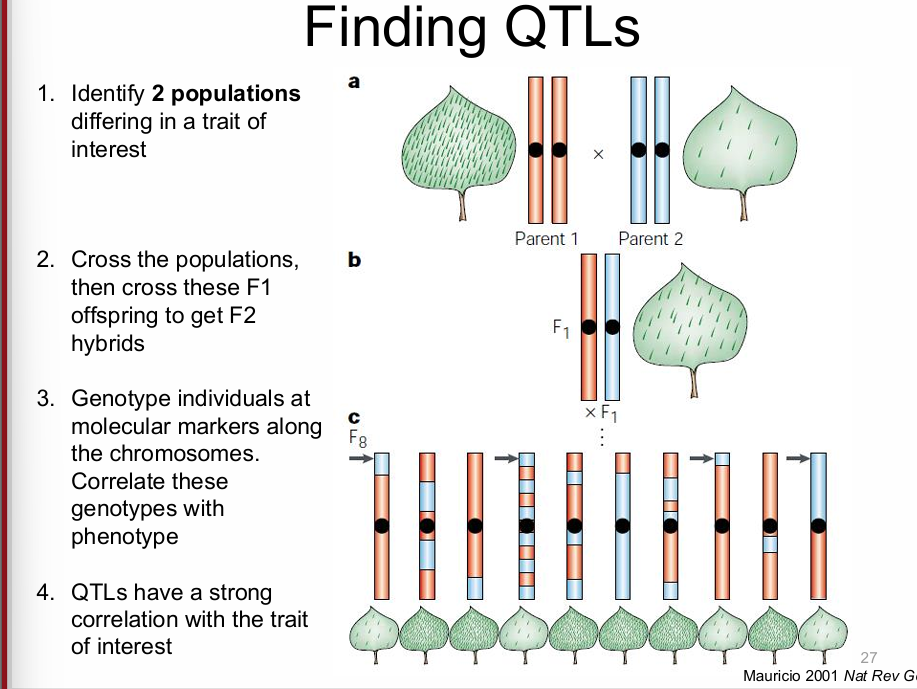
quantitative trait loci (QTL)
regions of the genome that affect a quantitative trait
finding QTL’s
identify 2 pops with differing traits
cross the pops, then cross F1 offsprings to get F2 hybrids
genotype individuals at molecular markers along the chromosomes, correlate genotypes with phenotype
QTL’s have a strong correlation with the trait of interest
genome-wide association study (GWAS)
similar to QTL, but looks at variation within a population and requires a large sample size
hardy-weinberg assumptions
no selection
effects of natural selection on allele/genotype frequencies
advantageous alleles become more common
disadvantageous alleles are less common
how do heterozygotes impede evolution?
natural selection, recessive deleterious alleles hide in heterozygotes
slows as fixation approaches
mutation-selection balance
conditions under which the mutation rate at a given locus = the strength of selection against deleterious alleles at that locus
majority of new mutations are weakly deleterious
natural selection in large populations will remove deleterious mutations
equilibrium frequency
state of allele and genotype frequencies in a population that remain constant from one gen to gen
equilibrium frequency of a deleterious allele, q
q=Mu/s
Mu is mutation rate (directly proportional)
s is selection (inversely proportional)
gene flow and selection
gene flow can hinder local adaptation by swamping a pop with alleles that are beneficial in other environments but not the current one. If selection isn’t strong enough, gene flow prevents good alleles from reaching high frequencies
genetic drift and selection
when genetic drift is the stronger force, alleles are eventually lost/fixed (s<1/4Ne)
when selection is stronger, beneficial alleles rise to high frequency and deleterious stay low (s>1/4Ne)
primates:
most recent common ancestor of all primates lived 80MYA
stereoscopic color vision, large brain
new world monkeys
platyrrhine
prehensile tail, flat nosed
old world monkeys
catarrhine
non grasping tail, downward facing nose
hominoidea (apes)
split from the old world monkeys 28-30 MYA
no tail
large brains
erect posture
hominidea (great apes)
elongated skulls
short canine
enlarged ovaries/mammary glands
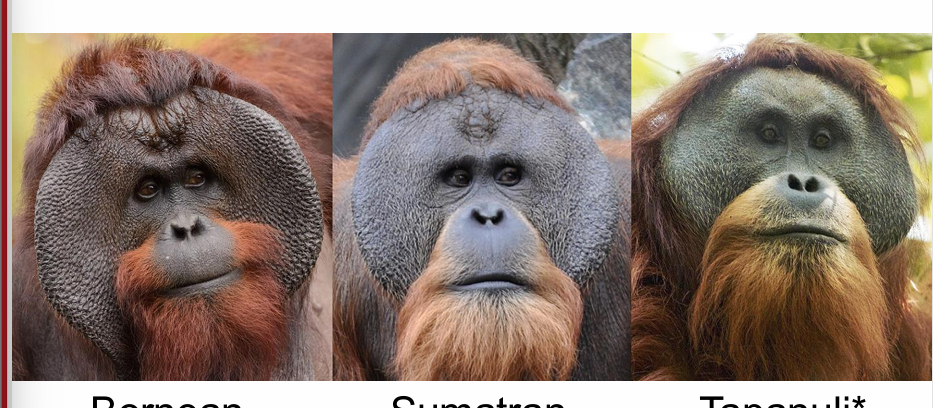
orangutans (Pongo)
bornean, sumatran, tapanuli
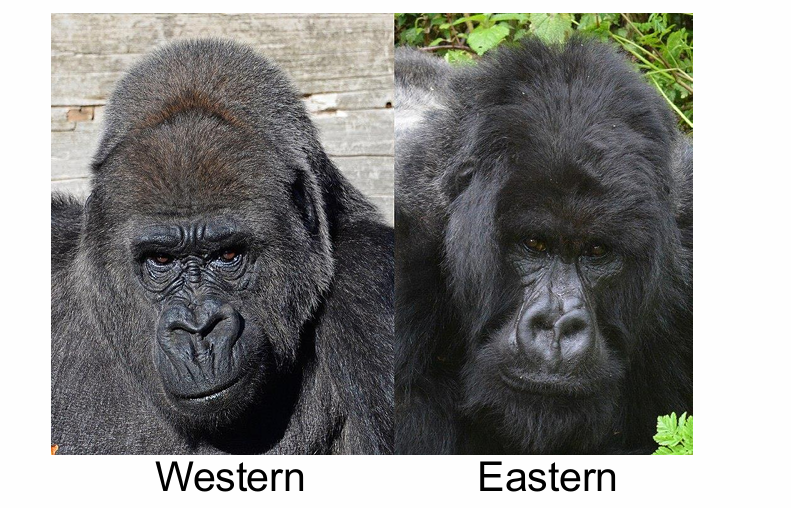
gorillas (Gorilla)
western, eastern
lives in small groups led by male silverback
males 2x size of females
chimpanzees (Pan troglodyte)
extensive tool use
extended child care
prolonged adolescence
poly (promiscuity) and highly social
Bonobos (Pan paniscus)
less violent than chimps
female form hierarchy
tool use
which apes are most closely related to humans?
chimps and bonobos
split 5.5 million years ago
human -like history
bipedal (evolved to walk and run)
large brains
language, culture
evolution of human features
bipedal
larger brains and smaller teeth
homo evolution
australopithecus
homo habilis
homo erectus
homo sapiens
hominin
any species more closely related to humans than to chimps
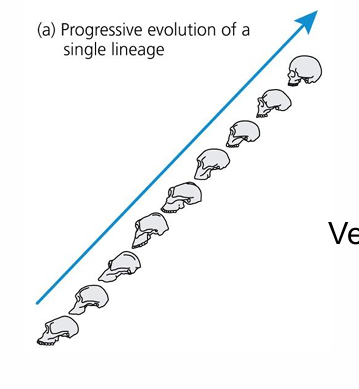
progressive evolution
linear path and directional process of evolution
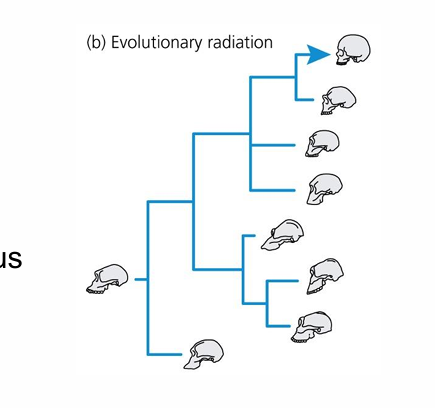
evolutionary radiation
taxonomic diversity of a lineage from common ancestors and new species, ecological niches
ardipithecus ramidus
chimp-like traits: long arms and fingers, grasping feet, long snout
human-like traits: open pelvis, small canines, neck attached to bottom of skulls
adapted for bipedal walking and arboreal life
early hominin species
australopithecus africanus, australopithecus afarensis, kenyathropus platyops
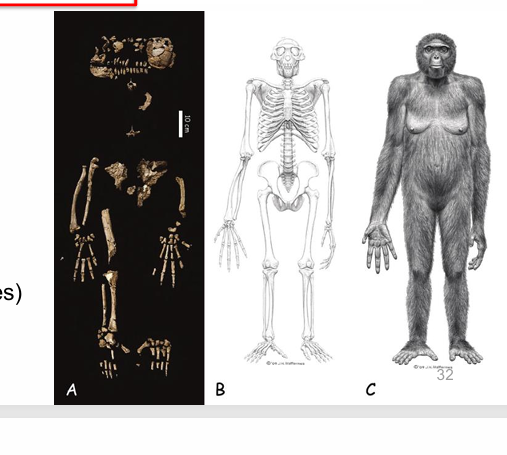
Lucy
Australopithecus afarensis
3 MYA
lack of splayed big toe
mix of traits for walking and climbing
appearance of Homo
2.5 million years ago, transitional hominins in Africa
larger braincase, flatter face, stone tools, greater height, longer legs
migration out of Africa
migration out of Africa 1.7 mya
first migration out of Africa did not include the modern human lineage
the wanderers
fossils of first human ancestors to trek out of africa reveal primitive features and brutal way of life
Homo erectus
built for walking and endurance running
first hominin to leave Africa and colonize Europe/Asia
how long ago did modern humans exist
0.2 million years ago
two hypotheses for transition from archaic to modern humans
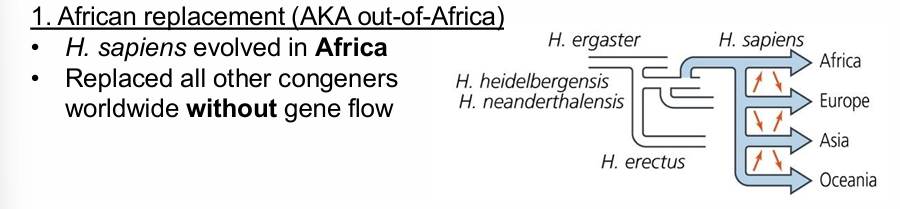
african replacement
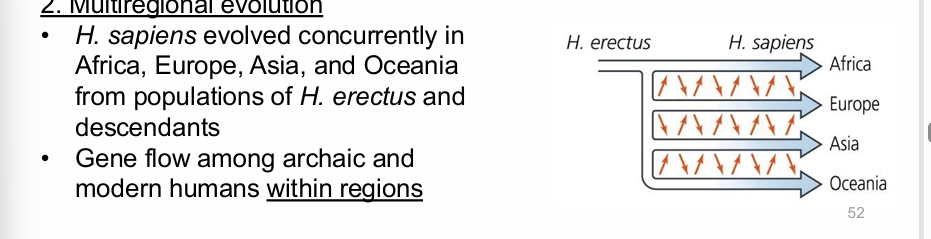
multiregional evolution
african replacement
“out-of-africa”
-Homo sapiens evolved in africa
-replaced all other congeners worldwide without gene flow
multiregional evolution
-homo sapiens evolved concurrently in africa, europe, asia, oceania from populations of homo erectus
-gene flow among archaic and modern humans within regions
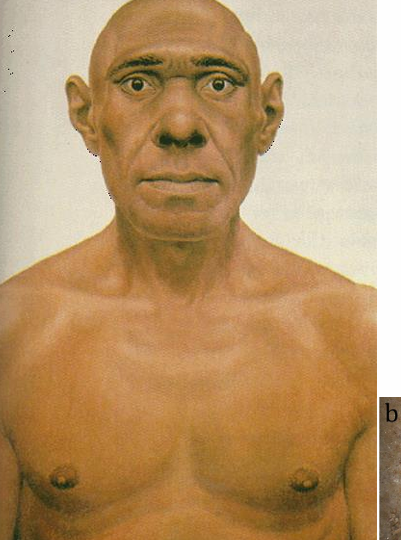
neanderthals
found from 400,000 to 30,000 years ago
prominent brow ridge, larger bulbous nose, powerful build
denisovans
group of hominids first detected by DNA analyses
denisovan and neanderthal
all modern humans are more closely related to each other than neanderthals or denisovans
BUT ancestors of modern humans hybridized with both neanderthals and denisovans after initial expansion out of africa
is there more human genetic diversity within or across populations?
there is more diversity within pops than across
do deleterious mutation occur more often closer or farther from Africa?
deleterious mutation occurs more often the further from Southern Africa you go