Psychology: Research methods 18 (Presentation of Quantitative data)
1/12
There's no tags or description
Looks like no tags are added yet.
Name | Mastery | Learn | Test | Matching | Spaced | Call with Kai |
|---|
No analytics yet
Send a link to your students to track their progress
13 Terms
Graphs and tables should be simple so they can be easily read. What 3 things should they be
They should clearly show the findings from a study
They should have an informative title
In a graph both axes should be labelled fully, including units
What are tables
Tables are used to summarise data as descriptive statistics. These summary tables are helpful for interpreting data. They may include the measure of central tendency and the measure of dispersion.
What are the different types of graphs
Scattergrams
Bar charts
Histogram
Line graphs
What are scattergrams
They are used to show the relationship between co-variables in a correlation study. Either of the co-variables goes on the x and y axis
What are bar charts
When data is divided into discrete. They are useful to compare the mean or median values of two conditions. Bars must not touch.
What are histograms
They are used when data is continuous. Bars should touch.
What are line graphs
In a line graph the IV on the x-axis and the DV on the y-axis. Line graphs show causation
What is data distribution
When the frequency of a large set of data is plotted the overall pattern is called the distribution
What is normal distribution
Normal distribution is a classic bell shaped curve which is how many human characteristics (e.g., shoe size and intelligence) are distributed.
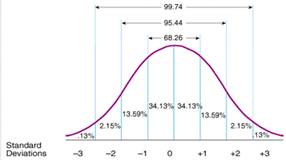
What are the 4 characteristics of a normal distribution
The mean, mode and median are at the same mid-point
The distribution is symmetrical around the mid-point
The dispersion of scores either side of the mid-point is consistent and is expressed as standard deviations.
68% of scores will lie within in one standard deviation above or below the mean & 95% will lie within two standard deviations of the mean
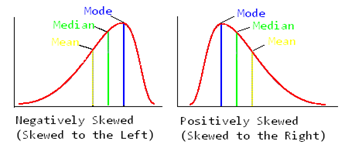
What is skewed distribution
a distribution which is not symmetrical but leans to one side:
What is positive skew
A posItive skew is when a distribution has very few high scores (such as a very hard exam) so the distribution is skewed to the rIght. In this situation the mean is always hIgher than the median or the mode
What is a negative skew
A nEgative skew is when a distribution has very few low scores (such as a very easy exam) so the distribution is skewed to the lEft. In this situation the mean is always lEss than the median or the mode.