Chapter One Ask the Question: Using Data Analytics to Address Accounting Questions
 Call Kai
 Learn
Learn Practice Test
 Spaced Repetition
 Match
Match Flashcards
 Knowt Play
1/16

There's no tags or description
Looks like no tags are added yet.
Name | Mastery | Learn | Test | Matching | Spaced | Call with Kai | Chat |
|---|
No analytics yet
Send a link to your students to track their progress
17 Terms
Bloom’s Taxonomy provides a
hierarchical view of
critical thinking skills.

The basic academic accounting curriculum most directly addresses to the three
lowest levels of Bloom’s taxonomy (that is,
remember, understand, and apply).
Data analytics moves us into the higher order thinking skills of
analyze, evaluate,
and ultimately, create
The AMPS Model provides a process for evaluating data
analytics.
Ask the Question.
Master the Data.
Perform the Analysis.
Share the Story.
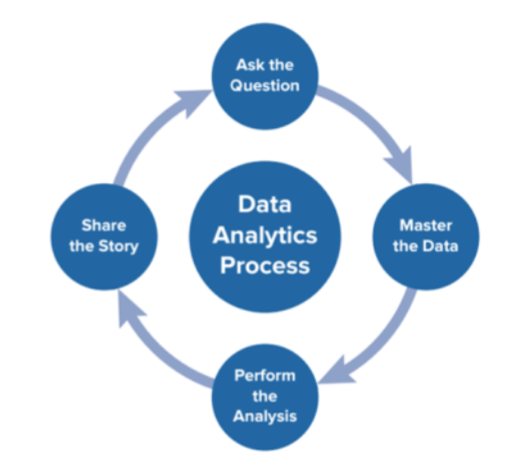
AMPS: Ask the Question
Data Analytics help answer these questions:
What happened? What is happening? (Descriptive Analytics).
Why did it happen? What are the root causes of past results? (Diagnostic
Analytics).
Will it happen in the future? What is the probability something will happen? Is it
forecastable? (Predictive Analytics).
What should we do, based on what we expect will happen? How do we
optimize our performance based on potential constraints? (Prescriptive Analytics)
AMPS: Master the Data 1
What issues exist in data we want to analyze?
Can the data answer/address the question?
Does the data exhibit data integrity (accurate, valid and consistent)?
• Does the data have errors?
• Is data missing?
• Is the data biased?
Type of Data: Categorical versus Numerical.
• What type of analysis does the data allow us to do?
Cost of Acquiring versus Benefit of Using the Data.
• Who owns the data?
• Is the data hard to access?
AMPS: Perform the Analysis
A PivotTable might be used to summarize the accounts receivable aging or post
journal entries to a trial balance.
A cash flow analysis (including use of internal rate of return or net present
value) might be used to evaluate capital investments made by the firm or equity
investments made by a potential investor.
A data visualization, such as a histogram or a scatterplot might be used to help
evaluate journal entries that are excessively big or excessively small (or negative)
with the testing of internal controls.
Regression analysis might be used to evaluate cost behavior by segregating
total costs into fixed and variable cost components.
Identifying shifts and outliers informs decision-making:
A What-If/Goal Seek analysis might be used to perform an analysis of how
changing costs and other factors affect the breakeven level for a new product.
Benford’s law might be used to find and evaluate unusual and potentially
fraudulent transactio
AMPS: Share the Story
What is the best way to communicate what we’ve found in our data
analysis?
Static Visualizations are created as one-off analyses.
• Reports.
• Graphs.
• Tables
Dynamic Visualizations update on a continuous basis.
• Dashboards.
Bar Chart
Comparison of values
Did Toyota or Tesla have greater sales last year?
Pie Chart
Composition of values
What proportion of sales comes from each division of the company?
Histogram
Distribution of values
How many days did it take to fulfill the recent set of 20,000 orders?
Line Graph
Trends of values over time
How has Google’s ad revenue changed over the last five years?
Scatterplot
Relationships between values
What is the relationship between advertising expense and sales revenue for Costco?
These tools help prepare data for analysis:
• Excel (basic).
• SQL (Structured Query Language) - used to access specific data from very
large datasets.
• Alteryx.
• Tableau Prep.
• Power BI (Power Query).
These tools analyze data interactively:
Excel (basic analysis) - Analysis tools available in Excel include:
• PivotTables — often a very functional tool for many types of
summarizations; also serves to help organize the data. We define
PivotTables as a tool that allows reorganization and summarization of certain
data using crosstabulations without changing the underlying spreadsheet (or
data).
• Data Analysis Toolpak — access to specific analysis techniques, including
descriptive statistics, histograms, correlation, and regression.
These tools analyze data programmatically:
SAS, SPSS, Stata - software analysis tools that emphasize statistics.
R and Python - programming software tool used to perform advanced data
analysis (covered in advanced data analysis course).GenAI - ChatGPT, Gemini, Claude, Copilot, or other GenAI tools—with the right guidance and natural language prompts, these tools can perform analyses, create visualizations, and explain relationships in the data.
These tools help create visualizations:
• Excel.
• Tableau Desktop.
• Power BI.
• GenAI