karl henke, Intro Stats with Computations, Midterm I terms
1/115
There's no tags or description
Looks like no tags are added yet.
Name | Mastery | Learn | Test | Matching | Spaced |
|---|
No study sessions yet.
116 Terms
Data
Any collection of numbers, characters, images, or other items that provide information about something.
They are values along with their content.
The Field of Statistics
The study and use of theories and methods for the analysis of data arising from random processes or phenomena.
It is how we make sense of data.
Statistic
A numerical quantity computed from the sample data.
Mathematical Statistics
The study and development of statistical theory and methods in the abstract.
Applied Statistics
The application of statistical methods to solve real problems involving randomly generated data and the development of new statistical methodology motivated by real problems.
Population
The entire group of individuals or instances about whom we hope to learn.
Sample
A subset of a population, used to make inferences about the population.
This should be representative of the population.
Statistical Inference
The procedure used to reach a conclusion about a population based on the information derived from a sample that has been drawn from that population.
Categorical Data
A type of data that tells us what group or category an individual belongs to.
Quantitative Data
A type of data that contains measured numerical values with measurement units.
This data typically records the amount or degree of something.
Nominal Variable
A form of categorial data that is “named,” or classified into one or more qualities that define the characteristic of interest.
Ordinal Variable
A form of categorical data that has an inherent order to the relationship among the different categories.
Binary Categorical Data
A form of categorical data where there are only two possible levels.
Continuous Variable
A form of quantitative data that is measured in each individual within the data set.
Discrete Variable
A form of quantitative data referring to a numerical variable that is measured within each individual in the data set. But, it can only be measured in whole numbers.
Observational Study
A type of research study in which individuals are observed or certain outcomes are measured.
No affect is made to affect the outcome on these kinds of studies.
Retrospective Study
An observational study containing participants who already have had a disease or condition.
These cases have already happened before the study begins.
Prospective Study
An observational study that watches for outcomes, like the development of a disease, during the study and relates this to other factors.
Experiments
A study which - contrary to observational studies - explicitly do try to influence results.
Confounding Variable
A variable not measured in the study that may affect the relationship between the response and explanatory variables.
Bias
The tendency of a sample statistic to systematically over or under-estimate a population parameter.
Voluntary Response Sample
A form of sample where a large group of individuals are invited to respond, and those that choose to respond are counted.
Convenience Sampling
A form of sample where the most convenient people to sample are chosen.
Probability Sampling
A form of sample where individuals or units are randomly selected.
This helps the sampling field be more unbiased.
Sample Size
The number of subjects in the sample.
Simple Random Sample
A sample that is completely made up of randomly selected individuals. Each person has the same probability of being in the sample.
Stratified Sampling
A form of sampling that involves dividing the population into homogeneous groups called strata. From there, proportionate amounts from each group are selected from the sample.
Multistage Sampling
A form of sampling that selects samples by stages, by sampling a sample within a sample.
Cluster Sampling
A form of sample that splits the population into representative clusters, and then selects every individual from a few of these clusters.
Systematic Sampling
A form of sampling that involves choosing every nth individual in the study.
Pilot Survey
A small trial run of the survey that will eventually be given to a larger group.
Undercoverage
A survey challenge that occurs when some members of the population are inadequately represented in the sample.
Nonresponse Bias
A survey challenge that occurs because some people choose not to answer or participate.
Response Bias
A survey challenge that occurs when people deliberately lie or forget the truth during it.
Treatment
Any specific experimental condition applied to the subjects.
Replicability
The ability to obtain the same result when an experiment is repeated.
Blinding
An instance in an experiment when a subject does not know what treatment they receive.
Double-Blinding
An instance in an experiment when neither the subjects nor the experimenters know which individuals received which treatment until the experiment is completed.
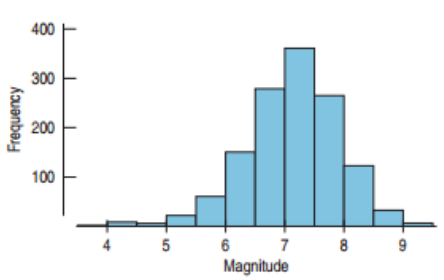
Histogram
A chart that displays quantitative data.
It is great for seeing the distribution of the data, as the height of each bar highlights the number of cases in each bin.
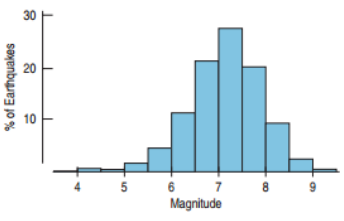
Relative Frequency Histogram
A histogram where the vertical axis represents the relative frequency (percentage), while the horizontal axis remains the same from a regular histogram.
Unimodal Histogram
A histogram that has one mode, or high-frequency bin.
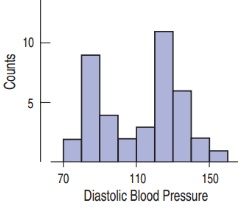
Bimodal Histogram
A histogram that has two modes, or high-frequency bins.
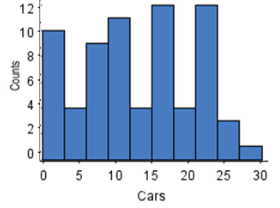
Multimodal Histogram
A histogram that has three or more modes, or high-frequency bins.
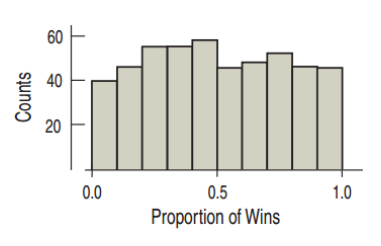
Uniform Distribution
A histogram where all the bins have a similar frequency.
In this case, the histogram would then be flat.
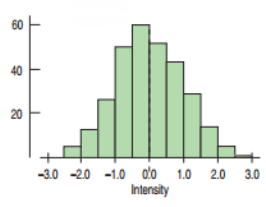
Symmetric Distribution
A histogram whose distribution looks the same on the left and right sides from the center.
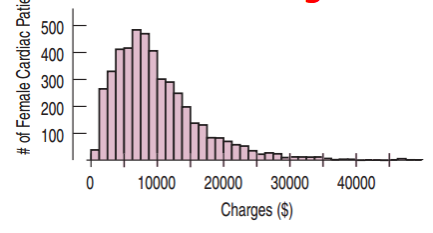
Right-Skewed Distribution
A histogram whose distribution has a longer tail on the right side of the mode
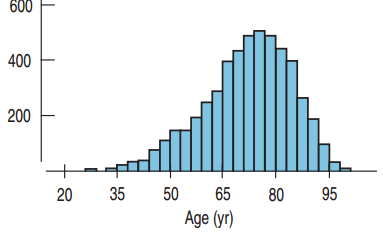
Left-Skewed Distribution
A histogram whose distribution has a longer tail on the left side of the mode.
Outlier
A data value that lies outside the overall pattern of a distribution.
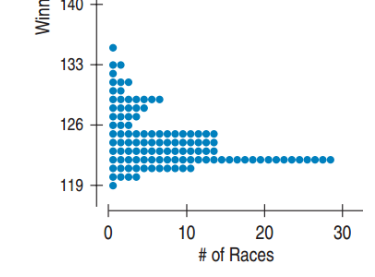
Dotplot
A display that shows dots to describe the shape of the distribution.
These displays are better for smaller data sets.
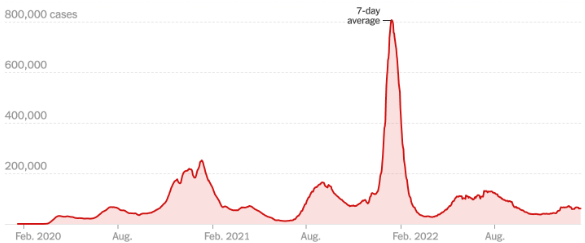
Time Plot
A display depicting data collected over time, often with time on the X-axis and the variable tested on the Y-axis.
These displays look for trends and potential cyclical variations.
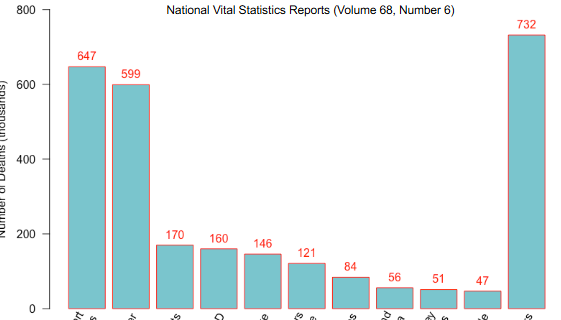
Bar Graph
A display where each characteristic is represented by a bar. The height of a bar either represents the variable’s frequency or relative frequency.
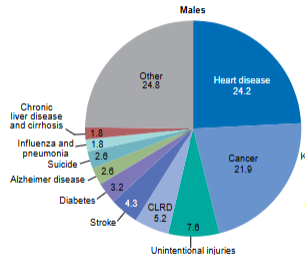
Pie Chart
A display that represents how one categorical variable is broken into components. Each “slice” represents what percent of the variable is made up by that characteristic.
Mean
The average of a data set.
To calculate this value, add all values, then divide by the numbers of individuals
Median
The midpoint of the distribution - or where half the observations are smaller and half are larger.
To calculate this value, sort all data from smallest to largest. The location of the median is (n + 1)/2 in this list, where n refers to the number of operations.
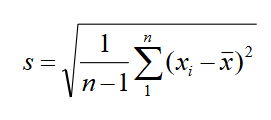
Standard Deviation
A measurement used to describe the variation around the mean.
It measures spread by looking at how far the observations are from the mean. The closer the data values are from the mean, the smaller this measurement is, and vice versa.
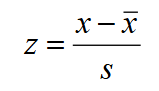
Z Score
The distance between the value and the mean in standard deviations.
The further this value is from the mean, the more unusual it is.
Percentile
The nth measurement of this is the data value such that n percent of the data lies below that value.
The median is measured when n = 50. The first quartile is measured when n = 25, and the third is measured when n = 75.
5-Number Summary
A numerical description of the data, consisting of its minimum, first quartile, median, third quartile, and maximum.
Interquartile Range
The distance between the first and third quartiles.
This value is measured by the difference between the third and first quartiles.
Outlier
An individual value that falls outside of the overall pattern. This includes values that are less than quartile 1 minus 1.5 x the interquartile range, or those that are greater than quartile 3 plus 1.5 x the interquartile range.
Frequency Table
A table whose first column displays each distinct outcome, while the second displays that outcome’s frequency.
Contingency Table
A table that displays two categorical variables and their relationships.
Conditional Distribution
The percent of one variable satisfying the conditions of another.
Explanatory Variable
A variable that can be used to explain or can be said to cause differences in another variable.
Response Variable
The variable in which the difference are observed.
This is often the focus of a question in a study or experiment.
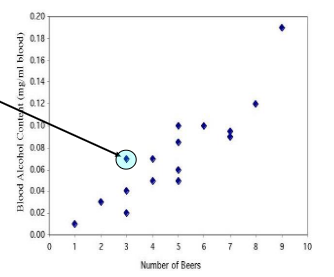
Scatterplot
A display used to show quantitative bivariate data.
Each variable makes up one of the two axes, while each individual is a part on the graph. Usually, the explanatory variable will be on the x-axis while the response variable will be on the y-axis.
Form
The overall pattern between two quantitative variables on a scatter plot. They are often referred to as linear, curved, or having no relationship.
Correlation
A bivariate analysis that measures the strength of association between two quantitative variables and the direction of the relationship.
This measurement is depicted by the correlation coefficient. This value is between -1 and 1, with the relationship being weaker as the coefficient gets closer to 1.
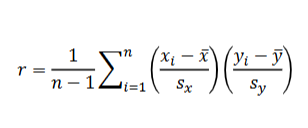
Pearson Correlation Coefficient
A measure of the direction and strength of a linear relationship.
It is calculated using the mean and standard deviation of both the x and y variables.
Fundamental Principle of Counting
Suppose k selections can be made independently, the first having n1 possible choices, the second having n2 possible choices… …and the kth having nk possible choices. Then, taken together, the total possible number of choices is n1 x n2 x … x nk.
Permutations
An ordered arrangement of the objects without repetition.
Using Pn to denote the number of permutations of a set of n objects, then Pn = n(n - 1)(n - 2) … x 1, or n!
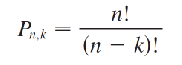
Permutations of n Objects when Taken k at a Time
To find Pn,k , where n is the number of objects taken k at a time, then Pn,k= n! / (n - k)!
Combination
An unordered subset of the objects without repetition.
With them, all that matters is the identity of the objects.
Using Cn,k to denote this value, when n is the set of objects taken k at a time, then Cn,k = n! / k!(n - k)!
This is read as “n choose k.”
Probability
A theory regarding the study of uncertainty.
Experiment (Probability)
Any procedure that can be repeated an indefinite number of times under identical conditions (in principle, at least), and that has a set of distinct possible outcomes.
Trial
Each repeated instance of an experiment.
Sample Space
The set of all possible outcomes of an experiment.
This is usually depicted by the Greek symbol omega.
On the contrary, the set containing no outcome is called the empty set.
Event
Any subset of the sample space.
Compound Event
An event consisting of more than one outcome.
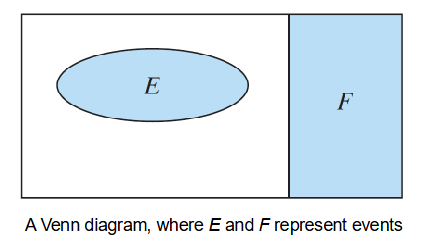
Venn Diagram
A pictoral description of the sample space.
Complement of an Event E
Denoted by E’, this is the event consisting of all outcomes that are not in E.
Union of Two Events E and F
Denoted by E ∪ F, this is the event consisting of all outcomes that are either in E, F, or both.
Intersection of Two Events E and F
Denoted by E ∩ F, this is the event consisting of all outcomes that are both in E and F.
Disjoint
When E and F are mutually exclusive - or their intersection is empty.
Commutative Law
For any events E and F, E ∪ F = F ∪ E, and E ∩ F = F ∩ E.

Associative Law
For any events E, F, and G, (E ∪ F) ∪ G = E ∪ (F ∪ G), and (E ∩ F) ∩ G = E ∩ (F ∩ G).

Distributive Property
For any events E, F, and G, (E ∪ F) ∩ G = (E ∩ G) ∪ (F ∩ G), and (E ∩ F) ∪ G = (E ∪ G) ∩ (F ∪ G).

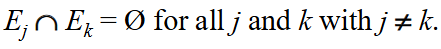
Pairwise Disjoint
An instance when no two events have any outcome in common.
Probability
Referred to as P(E), this is the chance that an event E will occur during the trial of an experiment.
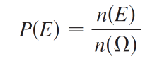
Probability when Outcomes are Equally Likely
If the sample space F has n(F) equally likely outcomes, and E is an event consisting of n(E) equally likely outcomes, then P(E) = n(E) / n(F).
P(E) must be between 0 and one, while P(F) must be equal to 1.
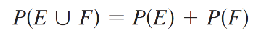
Probability of Mutually Exclusive Events
If all outcomes of an experiment are equally likely, and E and F are two mutually exclusive events, then P (E ∪ F) = P(E) + P(F).
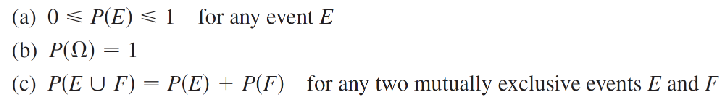
Probability Axioms
Suppose F is the sample space of an experiment with a finite number of outcomes (not necessarily equally likely). A function P(E) is called a probability function if it satisfies the following conditions:
0 <= P(E) <= 1, for any event E.
P(F) = 1.
P(E ∪ G) = P(E) + P(G), for any mutually exclusive events E and F.
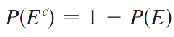
Complement Rule
For any event E, P(EC) = 1 - P(E).
Union Rule
For any two events E and F, P(E ∪ F) = P(E) + P(F) - P(E ∩ F)
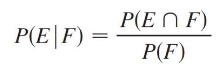
Conditional Probability
The instance of restricting the sample space of an environment by imposing some condition.
This is also referred to as P(E | F), or “the probability of E given F.”
The equation for this is given by P(E | F) = P(E ∩ F)/P(F)
Complement Rule for Conditional Probability
Consider two events E and F with P(F) > 0. Then, P(EC|F) = 1 - P(E|F).
General Multiplication Rule for Conditional Probability.
The probability that two events, E and F, both occur is either P(E ∩ F) = P(F|E)P(E) or P(E ∩ F) = P(F|E)P(F).

Independence
An instance when two events do not impact the outcome of one another.
Regarding two events E and F, this would be when P(E ∩ F) = P(E)P(F).
Mutual Independence
An instance where the probability of the intersection of all subsets of the events is equal to the product of the probability of these events.
In the cases of the events A, B, and C, this would require that P(A ∩ B ∩ C) = P(A)P(B)P(C), P(A) ∩ P(B) = P(A)P(B), P(A) ∩ P(C) = P(A)P(C), and P(B ∩ C) = P(B)P(C).
Exhaustive
A series of events if their union consists of the entire sample space.