UMD CHEM425
1/110
Earn XP
Description and Tags
Natalia White F2025
Name | Mastery | Learn | Test | Matching | Spaced |
|---|
No study sessions yet.
111 Terms
Parameters that describe separation efficiency in chromatography and their relationship:
K: Distribution coefficient. K=C_{s}/C_{m} , where C_s is the concentration of solute in the stationary phase and C_m is the concentratin of solute in the mobile phase. A large K value means the solute prefers the stationary phase and has a longer retention time, and a small K value means the solue prefers the mobile phase and has a shorter retention time.
k’: Capacity factor. k’=K\frac{V_s}{V_m}. A higher k’ value indicates a longer retention time. Also k’=\frac{t_R-t_M}{t_M} , where t_R is the retention time and t_M is the void time.
\mu: Linear velocity of mobile phase. \mu=\frac{L}{t_M}, where L is the length of the column. Higher \mu value indicates shorter retention time.
\alpha: Selectivity/separation factor. \alpha=\frac{k’_1}{k’_2}, where k’_1 and k’_2 are capacity factors for two different compounds. Also \alpha=\frac{K_1}{K_2}. When \alpha>1, the higher the \alpha value the greater the difference in retention, and the better the potential separation.
N: number of theoretical plates. N=16(\frac{t_R}{W})², where W is the base width of the peak. Also N=\frac{L}{H}, where H is the plate height. A larger N indicates narrower peaks and better separation.
H: Height of column plate. Measures how efficient a column is per unit length. A smaller H means the column is more efficient.
R_s: Resolution. Measures how well two peaks are separated relative to their widths. The two resolution equations are R_{s}=\frac{2(t_{R2}-t_{R1})}{W_2+W_1} and R_s=(\frac{\sqrt{N}}{4})(\frac{\alpha-1}{\alpha})(\frac{k’_2}{1+k’_2}).
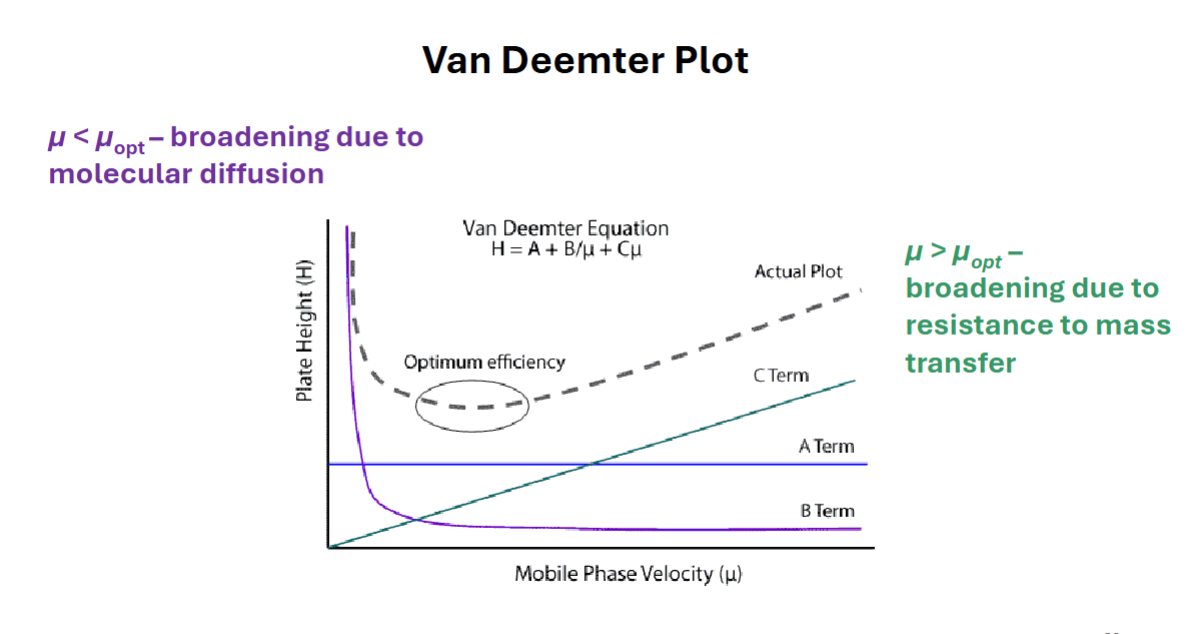
Van Deemter Equation
H=A+\frac{B}{\mu}+C\mu
H= plate height
A= eddy diffusion
\frac{B}{\mu}= longitudinal diffusion
C\mu=mass transfer
Eddy diffusion (multipath effect) (A)
Unequal flow paths through packing material that causes multiple channels and path-length differences. Causes band broadening in chromatography.
A \propto 2\lambda d_p, where \lambda=packing factor (how uniformly and ordered the packing is) and d_p=particle diameter of stationary phase.
Longitudinal diffusion (\frac{B}{\mu})
Solute molecules spread along the length of the column, due to molecular diffusion and differences in concentration. Molecules at the center of the band are at a higher concentration, than molecules at the edge of the band, causing the molecules to spread out towards the edges. Causes band broadening in chromatography.
\frac{B}{\mu} \propto \frac{2\gamma D_M}{\mu} ,where \gamma=path winding and D_M=molecular diffusion coefficient of the solute in the mobile phase.
Resistance to mass transfer (C\mu )
Time lag involved when solute molecules move between stationary and mobile phases to reach equilibrium. Higher linear velocity results in more resistance to mass transfer. Causes band broadening in chromatography.
C\mu = C_m\mu + C_s\mu, where C_m\mu \propto band broadening at leading edge due to resistance to mass transfer in mobile phase and C_s\mu \propto band broadening at trailing edge due to resistance to mass transfer in stationary phase.
C_m\mu=\frac{f_1(k’)d²_p}{D_m} \mu
C_{s}\mu=\frac{f_2(k’)d^{2}_{f}}{D_{m}}\mu
Van Deemter Plot
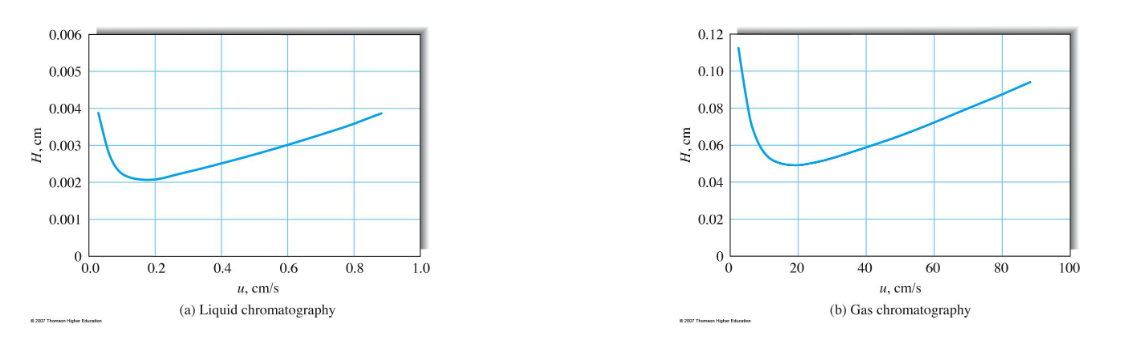
Van Deemter Plot for LC vs GC
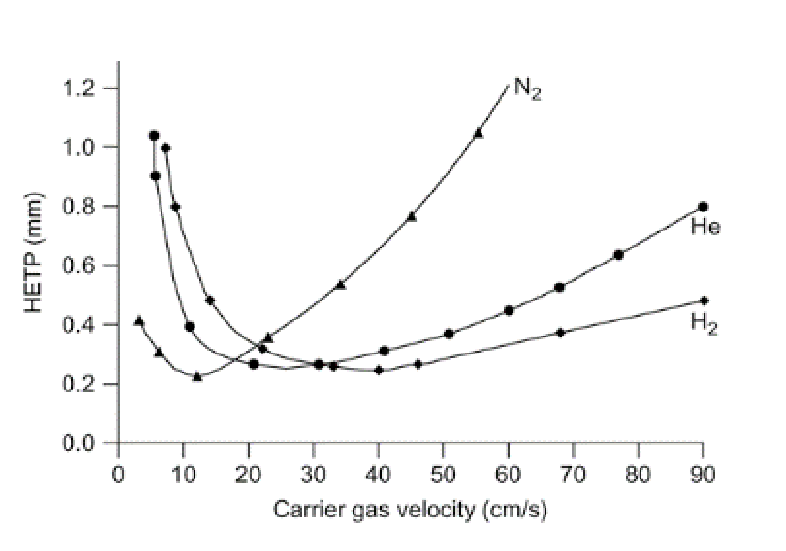
Variation in GC Van Deemter Plot depending on choice of carrier gas
General Elution Problem and ways of overcoming it
The inability to find a single set of chromatographic conditions (such as temperature, mobile phase composition, and flow rate) that ensures good separation of a compound with a wide range of polarities/volatilities.
The effects of the general elution problem can be reduced through a gradient elution (slowly changing the mobile phase) in HPLC and a temperature ramp in GC, which will optimize the k’ value.
Deviations from Gaussian Peaks in Chromatogram
Happens when K\neq \frac{[C_s]}{[C_m]}. Fronting happens due to overloading and improper injection. Tailing happens due to secondary interactions and column issues.
Nature of separation in gas chromatography
Retention is dictated by the temperature (boiling point) and polarity of the analytes.
Role of mobile phase in gas chromatography
The mobile phase is an inert carrier gas with the sole purpose of carrying the vaporized analyte through the column. The mobile phase does not interact with the analyte.
Isothermal vs ramp separation in gas chromatography
Isothermal (constant temperature): Volatile compounds with lower boiling points elute quicker than less volatile compounds with higher boiling points. Best used for simple mixtures where compounds have similar boiling points.
Temperature ramp: Temperature is gradually increased during the GC. The run starts at a low temperature so that volatile compounds separate well, and then temperature increases so that compounds with a higher boiling point elute faster. Used for complex mixtures with a wider range of boiling points.
Mass spectrometry as a detector for gas chromatography
Identifies the compounds eluting from the GC column by analyzing their mass-to-charge ratios and fragmentation patterns, which also allows for estimation of molecular weight
Types of liquid chromatography
Partitioning: liquid-liquid
Adsorption: liquid-solid
Size Exclusion
Ion Exchange (separation of ionic species)
Affinity (separation of biomolecules)
Chiral (separation of enantiomers)
Reverse vs. normal phase partioning HPLC
Reverse phase: more common, nonpolar stationary phase, more polar mobile phase, more polar compounds elute first
Normal phase: less common, polar stationary phase, nonpolar mobile phase, less polar compounds elute first
Nature of analytes and limitations of liquid chromatography
HPLC is usually used for non-volatile compounds that don’t vaporize easily, thermally unstable compounds that degrade at higher temperatures, or compounds high in polarity or molecular weight.
The main limitations of HPLC are that it gives lower resolution compared to GC, due to slower diffusion in liquid and slower run times. Also requires careful selection of mobile phase.
Adsorption liquid chromatography (liquid-solid)
Competition between analyte and mobile phase molecules for surface sites of the adsorbent. The adsorbent is the solid stationary phase, which is usually silica gel or alumina. Generally good for separating geometric isomers.
Size-exclusion liquid chromatography
Typically used for compounds with large molecular weight, macromolecules, or to separate high MW and low MW compounds. There is no chemical or physical interaction between the analyte and the stationary phase. Separates via sieving rather than partioning. Compounds with higher molecular weight elute first.
The main limitations of size-exclusion liquid chromatography are that there is no way to sharpen bands, columns need to be calibrated, at least 10% MW difference, and number of peaks capped to ~10.
Detectors for liquid chromatography
UV-Vis (most common), fluorescence, MS, voltammetry, refractive index.
UV-Vis is used the most due to being inexpensive, temperature independent, inexpensive, compatible with gradient elution, and sensitive to a large number of organic compounds.
What carrier gas is used for GC separations in the 425 lab?
He
What other gasses are employed in the GC and for what purpose
Compressed air acts as the oxidant and H2 gas is the fuel for the flame ionization detector.
What stationary phase do we employ for LC separations in the CHEM 425 laboratory?
Silica powder
How would you change the mobile phase to increase retention of analytes on the LC in the 425 lab? Should this increase or decrease resolution?
Since the 425 lab LC uses a reverse phase column, we would need to change the composition of the mobile phase to make it more polar. This should increase resolution.
What would you change to decrease the retention of analytes on the GC? Would this increase or decrease resolution?
We would have to increase the temperature of the column so that the compounds vaporize faster. This would decrease resolution.
What two detectors are employed on the LC in the 425 lab?
Uv-vis and MS
What two detectors are employed on the GC’s in the 425 lab?
Why is smaller better for high efficiency separations (e.g., small particle sizes, small column diameters (GC), thin stationary phase film thicknesses)?
Reduces A, B, and C values in Van Deemter equation.
Beer’s Law
A(\lambda)=\epsilon(\lambda)bc
Range of UV-vis: 190-800 nm
Wavelength of transmission (\lambda) corresponds with energy of transition/electronic structure
Intensity of absorbance (A) corresponds with sample concentration and allowance of transition
Transmittance and absorbance relation
Transmittance: T=\frac{P}{P_0}, where P and P_0 are beam intensity.
Absorbance: A=-log\left(T_{}\right)=log\frac{P_0}{P}
Beer’s Law for multicomponent system
A(\lambda)_{total} = A_1 + A_2 + … = {\epsilon}_1(\lambda)bc_1 + {\epsilon}_2(\lambda)bc_2 + …
Beer’s Law- real deviations and limitations
-Beer’s Law only successfully describes dilute solutions
-At >0.01 M the interactions between absorbing particles affect absorbing characteristics of the analyte and change charge distribution
-Very low concentrations result in limited resolution
-Beer’s Law assumes that absorbing species act independently, \epsilon remains constant, and light is monochromatic/uniform
Beer’s Law- chemical deviations and limitations
-Absorbance may be affected by concentration-dependent association/dissociation or reactions with the solvent.
Solution for association-dissociation: take readings at wavelength of isosbestic point (where both species have same molar absorptivity)
Solution for reaction with solvent: high dilution/high acidity
Beer’s Law- instrumental deviations and limitations
-Polychromatic radiation
-Stray radiation- reflecting/scattering by the surfaces of the optical system
-Mismatched cells cause a nonzero intercept
Solution to mismatched cells: use same cell for all solutions, and for double beam instruments blank both cells
What does it mean if Beer’s Law plot doesn’t go through zero?
-Problems w/ blanking
-Instrumental error/random error with absorbance readings or sample preparation
Nature of absorbing species for different transitions
\sigma \rightarrow \sigma*: \lambda < 200 nm
n \rightarrow \sigma*: \lambda = 150-250 nm, \epsilon ~ 10²
\pi \rightarrow \pi* (aromatic): \lambda = 177-700 nm, \epsilon ~ 10³-10^4
n \rightarrow \pi*: \lambda = 200-700 nm, \epsilon ~ 10-10²
Effect of conjugation on UV-vis absorbance bands
-more conjugation \rightarrow longer \lambda_{max} because less energy is required for the \pi \rightarrow \pi* transition
-more conjugation \rightarrow generally higher \epsilon because more electrons are delocalized
Effect of metal and charge transfer complexes on UV-vis absorbance bands
-Stronger field ligands \rightarrow shorter \lambda_{max}
-Weaker field ligands \rightarrow longer \lambda_{max}
-d\rightarrow d transitions \rightarrow weak (\epsilon < 100)
-LMCT (ligand \rightarrow metal charge transfer) and MLCT (metal \rightarrow ligand charge transfer) \rightarrow strong (\epsilon > 10000)
-d \rightarrow d transitions broaden bands
Applications of UV-vis spectroscopy
Qualitative: Identification of molecules, provides info on electronic structure of molecule, detecting impurities, used in junction with other systems of LC and CE
Quantitative: good sensitivity, good accuracy (1-3% error), \epsilon and b detection limit are in the range A ~ 0.002, and used to obtain reaction rates in kinetics.
Photometric titrations
-used for endpoint reactions with no clear visual indicator
-measures absorbance with volume of titrant added
-can be used to study \epsilon values for analyte, titrant, and product
Components of mass spectrometer in order
sample, inlet system, ion source, mass analyzer, detector, signal processor, readout
*the inlet system, ion source, mass analyzer, and detector are in a vacuum system
Mass spectrometry- inlet system
-Introduces sample without overwhelming the vacuum
-Converts the sample so that it can be ionized (vaporization, nebulization, etc)
-Batch type inlet system: used for gases/liquids with high vapor pressure, delivers a single fixed quantity of sample
-Chromatographic inlet system: used for complex mixtures that can be analyzed separately as they elute
-CE inlet system: separates analytes by charge-to-size ratio
-Direct probe: used for solids, non-volatile liquids, and thermally unstable compounds
Mass spectrometry ionization sources- EI
-Electronic ionization
-Electronic bombardment of gas/vapor molecules
-The only hard ionization source (causes extension fragmentation)
-Energetic electrons used as ionizing agent
-Gas/liquid analyte state
-Advantages: convenient, reproducible, predictable fragmentation, compatible with GC
-Disadvantages: lots of fragmentation, sample must be volatile, no molecular ion, poor for large MW molecules
Mass spectrometry ionization sources- CI
-Chemical ionization
-Uses reagent gas to ionize analyte
-Reagent gaseous ions used as ionizing agent
-Gas/liquid analyte state
-Advantages: Soft ionization, strong molecular ion, easy MW determination, compatible with GC and LC
-Disadvantages: no spectral library, less structural information, requires reagent gas, limited to volatile compounds
Mass spectrometry ionization sources- FI
-Field ionization
-Uses high-electric field to remove electrons from gas-phase species
-High-potential electrode used as ionizing agent
-Gas/liquid analyte state
-Advantages: soft ionization, strong molecular ion, good for volatile samples
-Disadvantages: low sensitivity, limited to volatile compounds, poor structural information
Mass spectrometry ionization sources- FD
-Field desorption
-Sample is deposited onto a surface and ionized by electric field through desorption
-High-potential electrode used as ionizing agent
-Non-volatile liquid/solid analyte state
-Advantages: soft ionization, molecular ion intact, good for non-volatile compounds, uses small sample amount
-Disadvantages: low sensitivity, poor quantification, not ideal for large MW compounds
Mass spectrometry ionization sources- FAB
-Fast atom bombardment
-Sample is dissolved in viscous matrix and bombarded with a beam of high-energy neutral atoms, causing ionization through sputtering
-Beams of energetic atoms used as ionizing agent
-Non-volatile liquid/solid analyte state
-Advantages: soft ionization, good for polar/ionic compounds, no volatility required, easy MW determination
-Disadvantages: low sensitivity, limited MW range, sensitive to salts/impurities, baseline noise
Mass spectrometry ionization sources- SIMS
-Secondary ion mass spectrometry
-Solid sample is bombarded with a high-energy primary ion beam, causing some of the molecular fragments to be ionized through sputtering
-Beam of energetic ion used as ionizing agent
-Non-volatile liquid/solid analyte state
-Advantages: surface sensitive, high-sensitivity, useful for conductive materials
-Disadvantages: destructive, complex spectra, limited molecular ion information
Mass spectrometry ionization sources- LD
-Laser desorption
-Sample is vaporized by high-energy laser pulses and is then directly ionized either by the laser itself, through heat, or through other ion-molecule reactions such as a matrix (which absorbs the laser energy and produces singly charged ions through proton/cation transfer)
-Laser beam used as ionizing agent
-Non-volatile liquid/solid analyte state
-Advantages: fast/simple, works with TOF (time-of-flight) spectrometers
-Disadvantages: limited MW range, poor sensitivity, messy spectra, low ionization efficiency
Mass spectrometry ionization sources- ESI
-Electrospray
-Electric field produces charged droplets of the sample, which are then evaporated by the solvent, producing gas-phase ions
-High electrical field used as ionizing agent
-Non-volatile liquid-solid analyte state
-Advantages: soft ionization, produces multiply charged ions, compatible with LC and CE, good for large thermally fragile molecules
-Disadvantages: limited to nonpolar compounds, sensitive to impurities
Mass spectrometry ionization sources- gas-phase sources vs desorption sources
Gas-phase ionization sources ionize molecules already in the gas phase, while desorption sources first vaporize or eject molecules from a solid or liquid sample into the gas phase before ionization.
Gas phase sources: EI, CI, FI
Desorption sources: FD, FAB, SIMS, LD, ESI
Mass spectrometry mass analyzers- magnetic sectors
-Separates ions based on mass-to-charge ratio using a magnetic field
-Used for isotopic ratio analysis
-Advantages: high resolution/accuracy, reproducible, high ion transmission efficiency
-Disadvantages: slow, expensive, hard to operate
Mass spectrometry mass analyzers- quadrupole mass filters
-Separates ions based on mass-to-charge ratio using oscillating electric fields
-Most common mass analyzer
-Used for GC and LC
-Advantages: small, cheap, efficient, good sensitivity, easy to operate, and fast acquisition (<100 ms for the entire spectrum)
-Disadvantages: lower resolution (R_{max}<500) and limited mass range (m/z~4000 max)
Mass spectrometry mass analyzers- time of flight (TOF) analyzers
-Separates ions based on the time it takes ions to travel a fixed distance after being given the same kinetic energy
-Used with MALDI
-Advantages: unlimited mass range, fast data acquisition, high sensitivity
-Disadvantages: limited mass accuracy, requires pulsed ion sources
Mass spectrometry mass analyzers- double focusing analyzers
-Uses electrostatic sector to remove kinetic energy, then separates ions by mass-to-charge ratio using magnetic sectors
-Used for isotope ratio analysis
-Advantages: very high resolution/accuracy, reproducible
-Disadvantages: large, complex, expensive
Mass spectrometry- detector
Captures the ions that have been separated by the mass analyzer and converts to electrical signal
Mass spectrometry- vacuum system
Creates a low-pressure environment that allows ions to travel freely through the instrument without colliding with gas molecules
Resolution in mass spectrometry
A measure of how well an instrument can distinguish between two ions with similar mass-to-charge (m/z) ratios
R=\frac{m/z}{\Delta m/z}, where the number is the m/z value of the ion of interest, and the denominator is the smallest mass difference between two peaks that the instrument can separate at that m/z value.
Example: R=5000, m/z = 500, and \Delta m/z = 0.1. This means that the instrument can distinguish masses around m/z = 500 that differ by 0.1.
What is fluorescence?
-Relaxation mechanism by which a molecule returns to the ground state upon absorbing radiation
-Happens at longer wavelength than wavelength of excitation
Fluorescence vs phosphorescence
Fluorescence is from the ground vibrational state of the S1 electronic state to various vibrational states of the ground electronic state (S0).
Phosphorescence is from the ground vibrational state of the T1 electronic state to various vibrational states of the ground electronic state (S0).
Intersystem crossing in fluorescence
Transitions between triplet and singlet state
Internal conversion in fluorescence
Transition between electronic states of the same spin multiplicity (S1 \rightarrow S0, etc)
Vibrational relaxation in fluorescence
Loss of excess vibrational energy within the electronic state
How does molecular structure affect fluorescence?
-Conjugation, aromaticity, planarity, and electron donating groups increase fluorescence
-Heavy atoms and carbon/nitro groups decrease fluorescence
Excitation vs emission fluorescence spectrum
Excitation spectrum: fluorescence intensity vs excitation wavelength, emission wavelength remains constant, generally identical to absorption spectrum
Emission spectrum: fluorescence intensity vs emission wavelength, excitation wavelength remains constant, reveals fluorescence color
Stokes’ shift
-Different between wavelength of maximum emission and wavelength of maximum excitation
-\lambdaemission > \lambdaexcitation, because vibrational relaxation causes the molecule to lose energy, making the wavelength longer
Fluorescence quantum yield (\phi)
-Fluorescence efficiency (fraction of excited molecules that relax through fluorescence)
\phi = # of photons emitted / # of photons absorbed
\phi = \frac{k_f}{k_f + k_{ic} + k_{is} + k_p + k_q [Q]} , where
k_f= rate constant of fluorescence
k_{ic}= rate constant of internal conversion
k_{is}= rate constant of intersystem crossing
k_p= rate constant of photochemistry
k_q= rate constant of quenching
Fluorescence lifetime (\tau)
\tau = \frac{1}{k_f + k_{ic} + k_{is} + k_p + k_q [Q]}
k_{NR} = k_{ic}+k_{is}+k_{p}+k_{q}[Q]
Environmental effects on fluorescence
Temperature: higher temperature \rightarrow faster vibrational relaxation and more collisions \rightarrow fluroescence intensity decreases
Solvent viscosity: higher viscosity \rightarrow less collisions \rightarrow fluorescence intensity increases
Solvent polarity: changes energy of both absorption and emission
Heavy atom effect: heavy atoms \rightarrow fluorescence intensity decreases
pH: affects fluorescence intensity by changing the protonation state and electronic structure of the fluorophore
Effect of concentration on fluorescence
-At low concentrations (optically thin conditions), fluorescence increases linearly with concentration
-At high concentrations (optically thick conditions), fluorescence deviates from linearity and eventually decreases due to inner filter effects
Inner filter effects in fluorescence
Loss of fluorescence caused by absorption of excitation light (primary inner filter) or re-absorption of fluorescence (secondary inner filter)
Why is fluorescence more sensitive than UV-vis absorption?
-Fluorescence measures emitted light against a dark background, and UV-vis measures the difference between two large light intensities
Why are fluorescence measurements taken in the ratio mode?
To correct for fluctuations in lamp intensity and instrumental drift
Why is the emission spectrum taken before the excitation spectrum?
An emission spectrum is taken to identify the wavelength of maximum fluorescence, which is used to determine the optimal excitation wavelength
Analytical applications of molecular fluorescence
-Detection of metal ions
-Chemiluminescence (chemical reaction that yields excitated species that emit light)
-Used for wide range of organic compounds, such as green fluorescent protein
-Fluorescence resonance energy transfer (FRET): excitated fluorophore transfers energy to nearby acceptor chromophore
What is electrophoresis?
-Separation of charged particles based on differential mobility in an electric field
-Separated by charge, size, shape
-Able to separate charged macromolecules
Planar vs. Capillary Electrophoresis
Planar electrophoresis
-large cross-sectional area, short length
-low electrical resistance, high current
-Vmax<1000 V
-Low resolution (N=100-1000)
Capillary electrophoresis
-small cross-sectional area, long length
-high resistance, low currents
-Vmax=20-100 kV
-very high resolution (N=100,000 - 10,000,000)
Slab (gel) electrophoresis
-Separates charged molecules by size
-Planar
-Gel is a cross-linked polymer and serves as a permeable matrix which molecules can travel through when an electric current is passed through it
-Buffer provides ions that carry current and maintain pH
Advantages: simple, large quantities
Disadvantages: slow, cannot apply high voltage
Capillary electrophoresis (CE)
-Separation occurs in capillary
-Facilitated by high voltages that create a flow of buffer solution and ionic species within the capillary
-Requires small amount of sample and reagents
Advantages: high precision/accuracy, high efficiency, can separate small molecules, compatible with modern detector technology
Disadvantages: complex instrumentation
Modes of CE
-Capillary zone electrophoresis (CZE)
-Micellar electrokinetic chromatography (MEKC)
-Isoelectric focusing (IEF)
-Capillary gel electrophoresis (CGE)
CE Terminology
t_m- migration time
v- electrophoretic velocity (cm/s)
E- field strength (V/cm)
\mu_e- electrophoretic mobility (cm2/Vs)
Useful equations:
t_m = L/v
v=\mu_e \times E = \mu_e \times V/L
v= {L_d}/t_m
E=V/{L_t}
L_t= entire length of capillary
L_d= length to detector window
(L_t - L_d)= excess length
V= voltage
Often, migration rate v=(\mu_e + \mu_{eo})E
Electroosmotic flow in CE
Plug-shaped flow that carries analytes through the capillary while their electrophoretic mobilies determine separation. Electroosmotic flow separates electrophoretic mobility. Uses an electric field to move the ions on the capillary wall, dragging the solution towards the cathode.
-EO is proportional to voltage and surface charge
-Degree of ionization controlled by buffer pH
Separation Efficiency of CE
-Only ions separated, only one mobile phase involved
-N=\frac{{\mu_e}V}{2D}, with D = diffusion coefficient of solute
-t_m = {L_d}/v = {L²}/{{\mu_e}V}
-N=16(\frac{t_m}{W})²
Band broadening due to
-longitudinal diffusion
-temperature effects
-injection technique
Joule Heating in CE
The heat released as electric current passes through the conductor
Rate of heat generation: \frac{d(heat)}{dt} = iV/LA
L= capillary length
A= cross- sectional area of capillary
i= current
V= applied potential
Useful equations
i=V/R
R= L/kA
k= conductivity
Why is joule heating an issue in CE
-Temperature gradient across capillary
-Temperature changes over time due to ineffective heat dissipation
Solution- narrower capillary
Tradeoff- clogging and poor detection limits
Detectors for CE
UV vis
-uses special cells (bubble cell and multi-reflection cell)
Fluorescence (laser induced)
-most popular
Electrochemical methods- conductivity and amperometry
MS- electrospray ionization
CZE
Capillary zone electrophoresis
-Separates analytes by charge-to-size ratio using electric field
-Used for proteins/peptides, inorganic cations/anions, and small charged molecules
-Requires homogeneous buffer solution and constant field strength
Limitations- pH sensitive (proteins precipitate at low pH and high pH leads to incomplete separation)
Important equations
\mu_e = \frac{q}{6} \pi \eta R
\mu_e= electrophoretic mobility, q=net charge, R= Stokes radius, \eta= viscosity of medium
\mu_{eo} = \epsilon \frac{\zeta}{4} \pi \eta
\epsilon=dielectric constant
\zeta=potential in interfacial double layer
MEKC
Micellar Electrokinetic Capillary Chromatography
-Uses controllable EOF and surfactant micelles to separate both neutral and charged analytes
Advantages- separates both charged and neutral analytes, small sample volume
Limitations- not compatible with MS, complex
IEF
Isoelectric focusing
-separates amphoteric molecules (proteins/peptides/amino acids) by establishing a pH gradient in an electric field so each species migrates until it reaches the pH where its net charge is zero and then focuses into a sharp band.
- H+= cathode and OH-=anode
-Ions migrate towards their opposite charge
Advantages- extremely high resolution, good for peptides/proteins
Disadvantages- limited to amphoteric molecules, complex
CGE
Capillary gel electrophoresis
-Uses molecular sieving to separate analytes based on size
-Perfomed in a porous gel polymer matrix inside a capillary, with molecules driven by electric field
-small molecules pass quicker than large molecules
Advantages- used for DNA fragments and oligonucleotides
Disadvantages- inefficient and complex
How does atomic spectroscopy work?
-Based on the absorption, emission, or fluorescence of light by gasses
-Involves electronic transitions between orbitals
-Each element has unique eneergy transitions
Types of atomic spectroscopy
AES (Atomic Emission)
-Emission of photon from excited state to ground state
-Excited states are thermally populated
-Qualitative and quantitative
AAS (Atomic Absorption)
-Promotion of an electron from ground state to higher energy state through light absorption
-Quantitative
Atomic Fluorescence (AFS)
-Photon emission induced by resonant absorption
-Excited state populated by light absorption
Causes of line broadening in AS spectra
-Uncertainty principle
-Doppler effect
-Pressure broadening
-Temperature effects
Uncertainty broadening in AS
Consequence of Heisenberg’s uncertainty principle: the energy of a particle can only be known with certainty if it is observed for an infinite period
Doppler broadening in AS
Atoms moving towards/away from the light source experience shifting frequencies, which affects thermal motion
Pressure broadening in AS
Caused by collisions between absorbing/emitting particles, which lead to changes in ground state energy levels
Temperature effects on broadening in AS
As temperature increases, atoms move faster on average, widening the distribution of Doppler shifts and therefore broadening the spectral lines in atomic spectroscopy.
Atomic absorption spectroscopy
-Most popular quantitative method ffor elemental analysis
-Uses Beer’s Law and calibration curves
Advantages: simple, high elemental selectivity, minimal interference
Disadvantages: narrow linear dynamic range
Atomization in AAS
Continuous sample introduction methods:
Nebulization- samples converted to fine aerosol, and then carried to a heat source where the solvent is evaporated and the sample is atomized
Discrete sample introduction methods:
-Temperature is raised rapidly to evaporate solvent and atomize sample
-Higher sensitivity due to being atomized in a short period
Types of atomizers in AS
-Flame
-Inductively coupled argon plasma
-Electrothermal
-Electric arc
-Electric spark
Structure of flame in AAS
Secondary combustion zone- where products are converted into stable oxides and dispersed
Interzonal region- where free atoms are prevalant
Primal combustion zone- no thermal equilibrium, not useful for AAS