Chapter 8 Econ
 Call Kai
 Learn
Learn Practice Test
 Spaced Repetition
 Match
Match Flashcards
 Knowt Play
1/46

There's no tags or description
Looks like no tags are added yet.
Name | Mastery | Learn | Test | Matching | Spaced | Call with Kai | Chat |
|---|
No analytics yet
Send a link to your students to track their progress
47 Terms
National Income Accounting
Measurement of an economy’s national income and output, as well as other measures of economic performance, by specialised statistical services in every country.
National Output (Aggregate Output)
Total output produced by an economy, also known as aggregate output, is often measured by real GDP.
National Income
The total income of an economy, consisting of factor payments or the sum of wages, interest, rent, plus profit, is often used interchangeably with the value of aggregate output, particularly in the context of macroeconomic models.
Three Ways to Measure the Value of National Output
- Expenditure approach
- Income approach
- Output approach
Expenditure Approach
A method used to measure the value of aggregate output of an economy, which adds up all spending on final goods and services produced within a country within a given time period (C + I + G + (X - M)).
Income Approach
A method used to measure the value of aggregate output of an economy, which adds up all income earned by the factors of production in the course of producing all goods and services within a country in a given time period.
Output Approach
A method used to measure the value of aggregate output of an economy, which calculates the value of all final goods and services produced in the country within a given time period.
4 Components of Total Spending
- Consumption spending (C)
- Investment spending (I)
- Government spending (G)
- Net exports (X-M)
Consumption Spending (C)
Includes all purchases by households of final goods and services in a year. Consumption spending is often referred to as consumption for short.
Investment Spending (I)
Includes spending by firms on capital goods and spending on new construction. Investment spending is often referred to as investment for short.
Government Spending (G)
Refers to spending by governments within a country. Includes purchases by the government of factors of production and includes government investment (roads, airports, power generators, and buildings).
Net Exports (X - M)
Refers to the value of all exports (X) minus the value of all imports (M). Exports are produced within a country, while imports aren’t, which is why they must be subtracted from expenditures measuring domestic output.
Gross Domestic Product (GDP)
A measure of the value of aggregate output of an economy, it is the market value of all final goods and services produced within a country during a given time period.
Gross National Income (GNI)
A measure of the total income received by the residents of a country, equal to the value of all final goods and services produced by the factors of production supplied by the country’s residents, regardless of where the factors are located. (GNI = GDP + (income from abroad - income sent abroad))
Difference Between GDP and GNI
GDP = The total value of all final goods and services produced within a country over a time period (usually a year), regardless of who owns the factors of production.
While
GNI = The total income received by the residents of a country, equal to the value of all final goods and services produced by the factors of production supplied by the country's residents, regardless of where the factors are located.
Nominal Value
Value that is in monetary terms, measured in terms of prices that prevail at the time of measurement, and that does not account for changes in the price level.
Nominal GDP / GNI
GDP / GNI measured in terms of current (or nominal) prices, which are prices prevailing at the time of measurement. Does not account for changes in the price level.
Real Value
Value that has eliminated the influence of changes in the price level.
Real GDP / GNI
GDP / GNI measured in constant prices. This is useful for making comparisons of changes in GDP / GNI over time that have taken into account the influence of changing prices.
Per Capita
A Latin expression that means per person.
GDP Per Capita
GDP divided by the number of people in the population is an indicator of the amount of domestic output per person in the population.
Price Level
The average price of all goods and services in an economy.
Purchasing Power Parities (PPPs)
Special exchange rates between currencies that make the buying power of each currency equal to the buying power of US$1, and therefore equal to each other. They eliminate the influence of price level differences across countries.
Calculating GDP
GDP = C + I + G + (X-M)
Calculating GNI
GNI = GDP + income from abroad - income sent abroad
or
GNI = GDP + net income from abroad
Price Deflator (GDP Deflator)
A price index used to convert nominal values into real values, such as nominal GDP into real GDP, known as the ‘GDP deflator’.
GDP deflator = (nominal GDP ÷ real GDP) × 100
Can be used to calculate real GDP =
Business Cycle
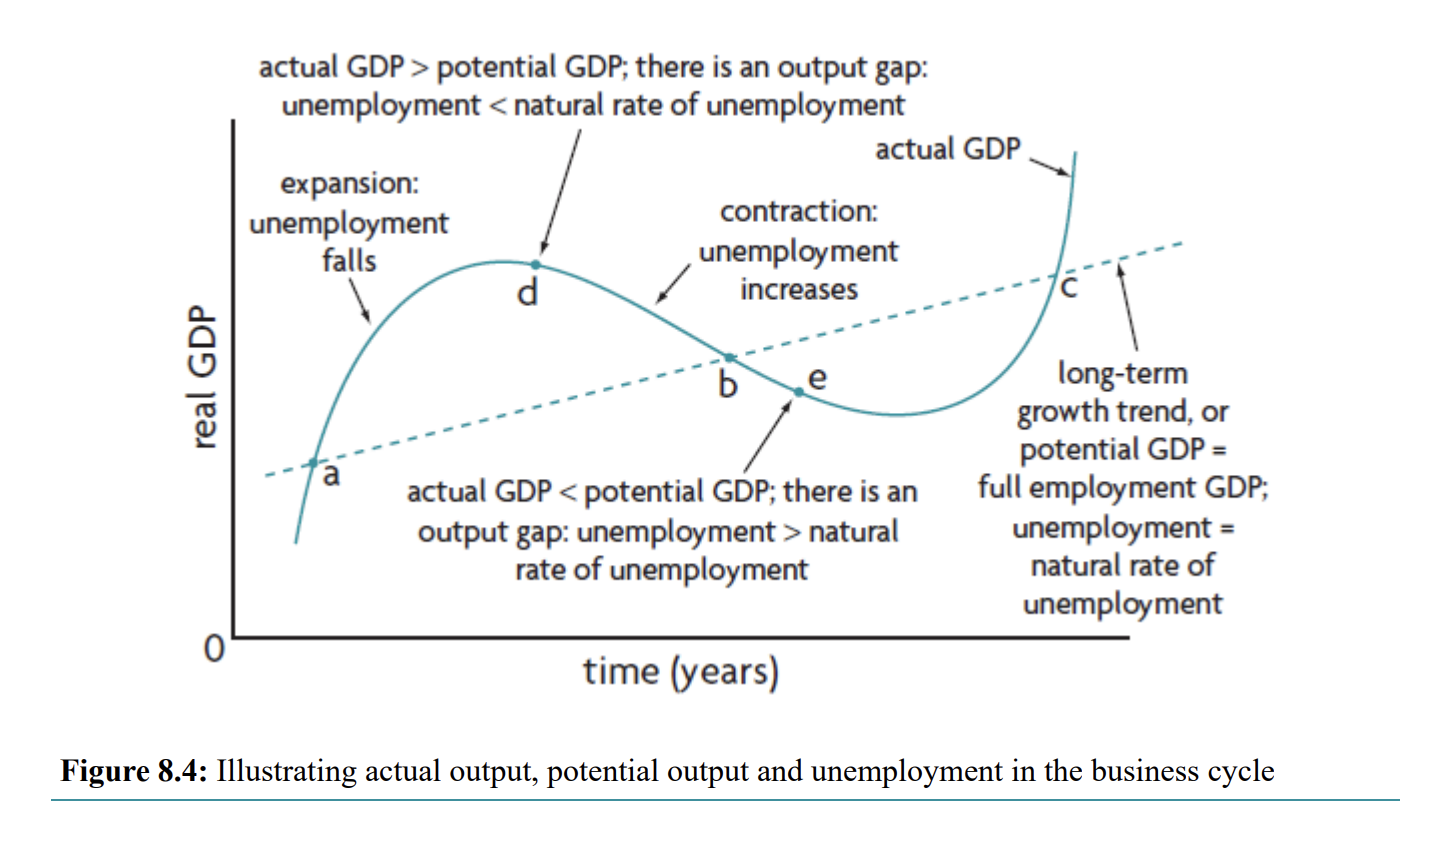
Fluctuations in the growth of real GDP, consisting of alternating periods of expansion (increasing real GDP) and contraction (decreasing real GDP).
Short-Term Fluctuations
Alternating periods of expansion (increasing real GDP) and contraction (decreasing real GDP), which occur in the business cycle.
Phases of Each Business Cycle
- Expansion
- Peak
- Contraction
- Trough
Expansion
Occurs when there is positive growth in real GDP, with resource utilization increasing and the economy's general price level usually rising more rapidly.
Peak
Represents the cycle’s maximum real GDP, and marks the end of the expansion, where the unemployment of resources has fallen substantially, and the general price level may be rising quite rapidly, meaning the economy is likely to be experiencing inflation.
Contraction
Following the peak, the economy begins to experience falling real GDP (negative growth). If it lasts six months or more, it is termed a recession, characterised by falling real GDP and unemployment of resources. Increases in the price level may slow down a lot, and prices in some sectors may begin to fall.
Recession
An economic contraction, when there is falling real GDP (negative growth) and increasing unemployment of resources, which lasts six months or more.
Trough
Represents the cycle’s minimum level of GDP, or the end of the contraction. There may now be widespread unemployment. It is followed by a new period of expansion (also known as a recovery), marking the beginning of a new cycle.
Long-Term Growth Trend
Refers to the line that runs through the business cycle curve, representing average growth over long periods of time; it shows how output grows over time when cyclical fluctuations are ironed out. The output represented by this is known as potential output.
The Business Cycle Diagram

Potential Output
The level of real GDP that can be produced when there is ‘full employment’, meaning that unemployment is equal to the natural rate of unemployment; also known as the full employment level of output.
Full Employment
The level of real GDP at which unemployment is equal ot the natural rate of unemployment; the level of real GDP where there is no deflationary or recessionary gap. Also known as potential output.
GDP Gap (Output Gap)
Results when actual GDP lies above or below potential GDP. It is simply actual GDP minus potential GDP, and may be positive, negative, or zero.
Natural Rate of Unemployment
Unemployment that occurs when the economy is producing at its potential or full employment level of output (real GDP), and is equal to the sum of structural, frictional plus seasonal unemployment.
Illustrating Actual Output, Potential Output, and Unemployment in the Business Cycle
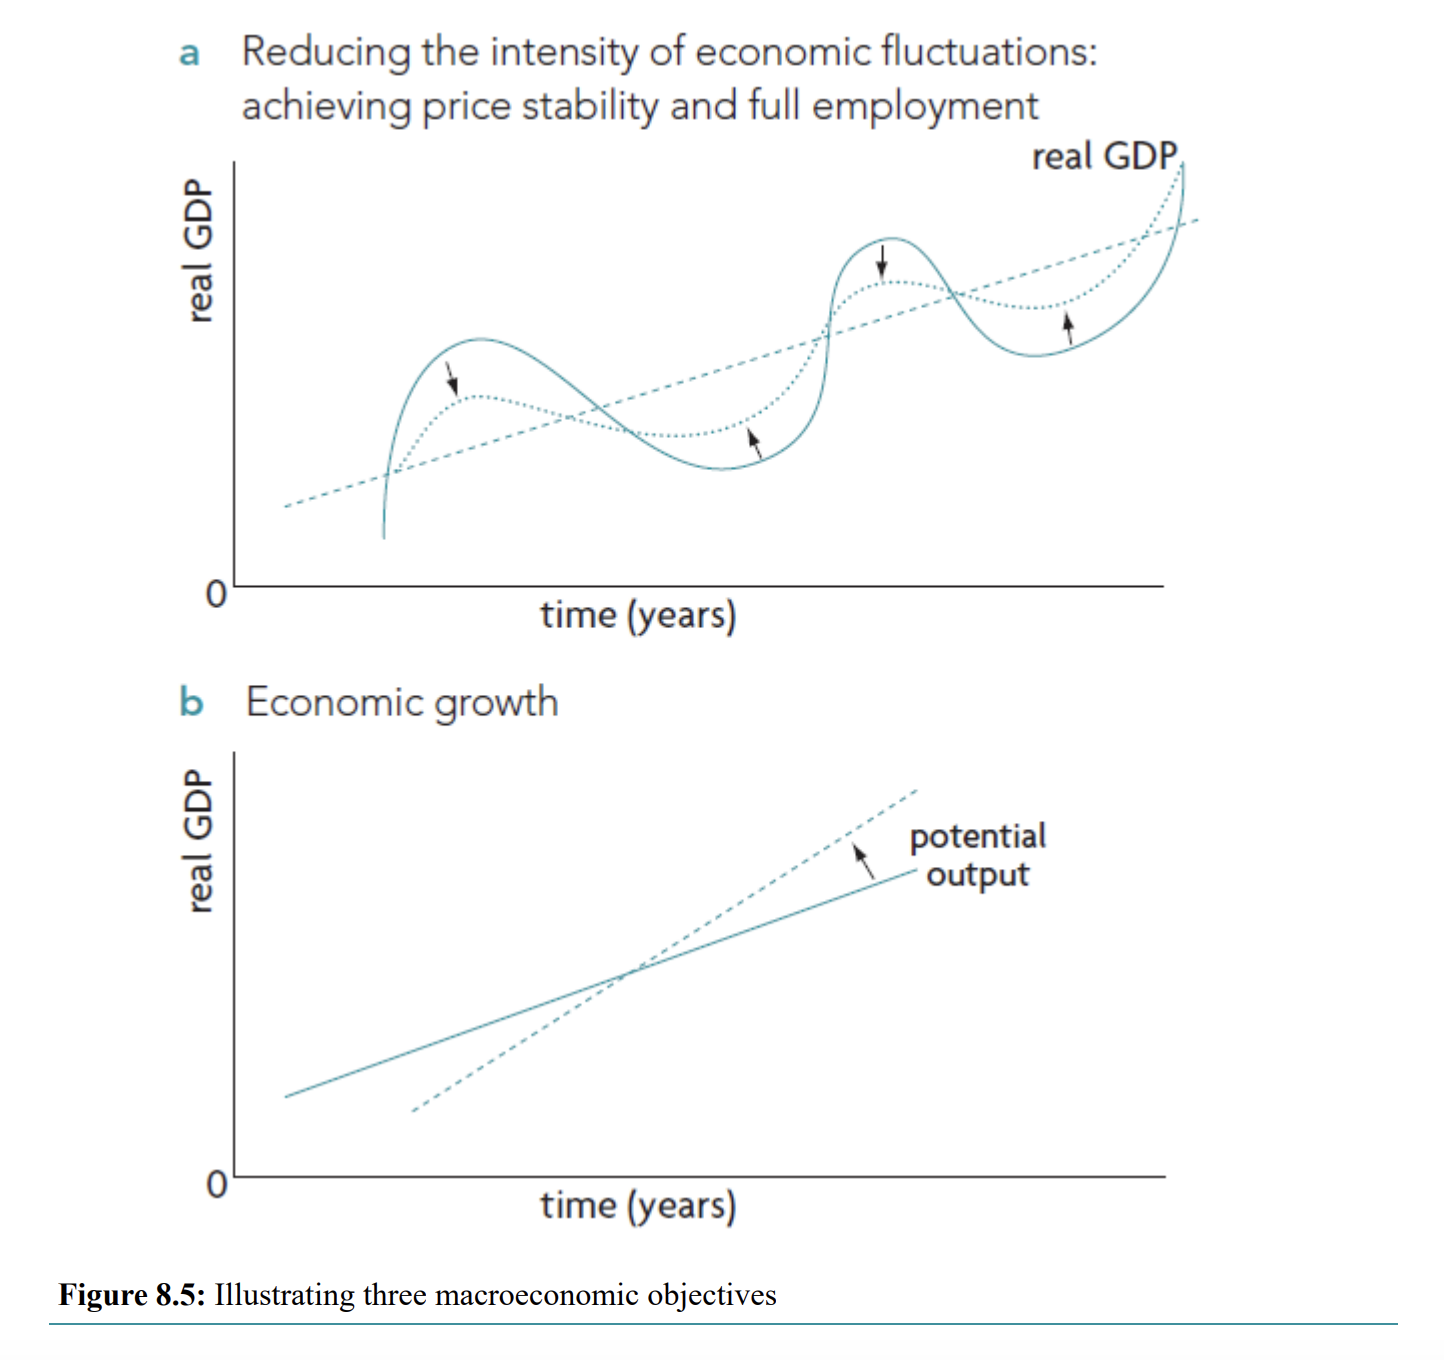
Three Key Macroeconomic Objectives
1. Economic Growth: Increase in real GDP over time
2. Low Unemployment: Efficient use of labor (close to natural rate)
3. Price Stability: Low and stable inflation
Illustrating Three Macroeconomic Objectives
National Income Statistics
Statistical data used to measure national income and output, and other measures of economic performance.
OECD Better Life Index
An alternative measure to standard national income accounting that measures economic well-being in several dimensions that take into account quality of life.
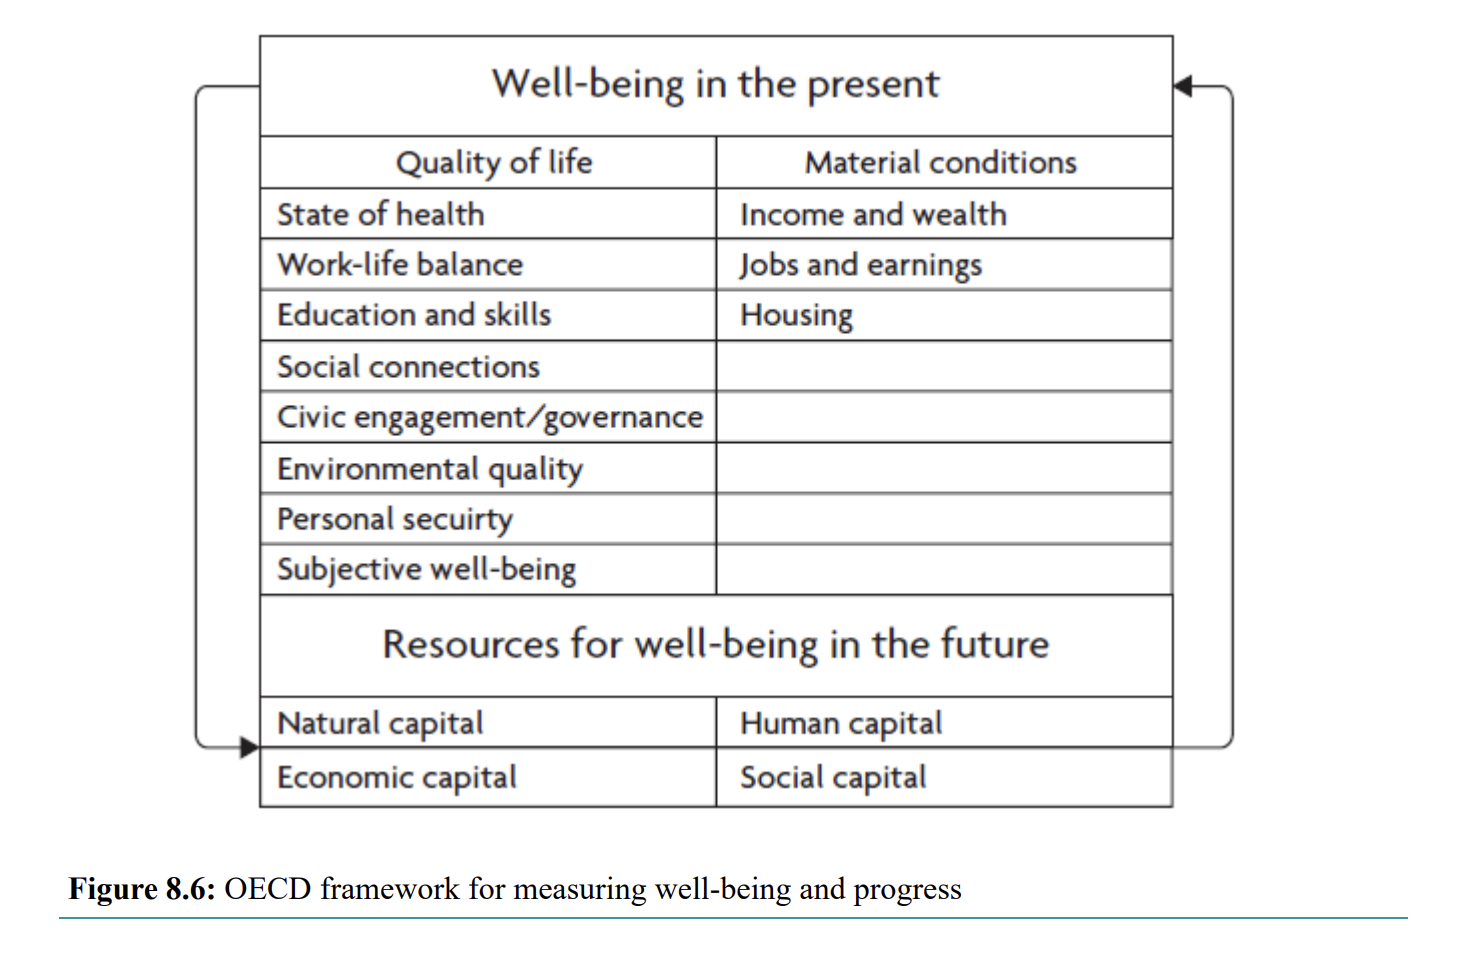
Happiness Index
An alternative method to standard national income accounting that measures economic well-being using numerous quality of life dimensions in addition to real GDP per capita.
Happy Planet Index
An alternative method to standard national income accounting that takes into account environmental sustainability and inequalities. It is a measure of sustainable well-being based on four dimensions: life expectancy, well-being, inequality of outcomes, and ecological footprint.
HPI = (life expectancy × well-being × inequality of outcomes) ÷ ecological footprint