CEMENT HYDRATION AND MICROSTRUCTURE
1/18
There's no tags or description
Looks like no tags are added yet.
Name | Mastery | Learn | Test | Matching | Spaced |
|---|
No study sessions yet.
19 Terms
what is stage 1 of cement hydration
initial hydrolsis (15 minutes) is the process which changes the pH from 7 to 12.5
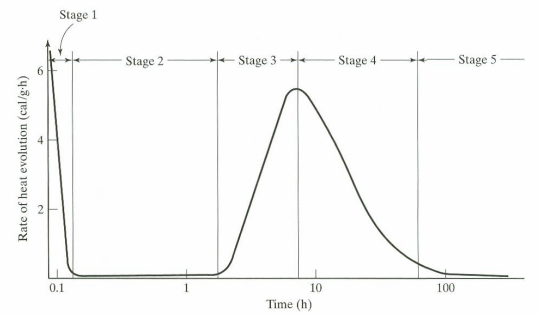
label all stages in this photo
initial hydrolsis, domant/induction period, acceleration, deceleration, steady state
what is stage 2 of the cement hydration process
the dormant/induction period where the gel begins to interlock and form a weak framework
what is stage 3 of the cement hydration process
acceleration stage where the gel forms a stronger skeletal framework and particle movement stops
what is stage 4 of the cement hydration process
the decleration stage where the rate of early strength gain is determined
what is stage 5 of the cement hydration process
the steady state phase which determines the long-term strength and durability of the cement.
in stages 4 and 5 the reaction at the cement grain boundary, water must diffuse through the CSH gel to the reactive surface making…
the reation slows as hydration advances
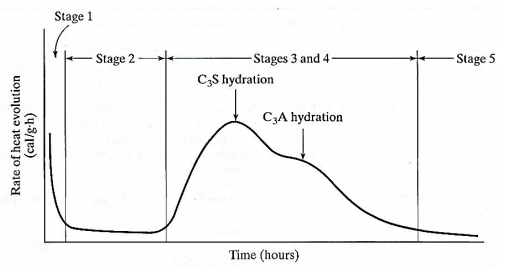
what does the heat evolution graph look like for portland cement
C3S and C3A hydration are used in stages 3 and 4
disucss about the devlopment of microstructure from the inital mix to 90 days
the progression of the cement microstructure evolves significantly as hydration continues, transitioning from poorly connected flocs and unreacted grains at early ages to a denser, more interconnected network of hydration products by 90 days, enhancing mechanical properties and durability.
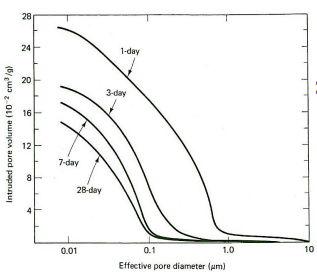
what does the delvopment of microstructure graph look like
this
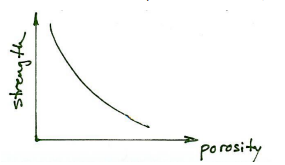
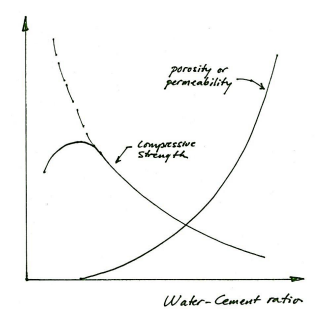
what does the graph of strength vs. porosity look like
as porosity increases, the strength decreases
how is the inital proxmity of the cement grains in the concrete mixture measured
by the water/cement (w/c) ratio
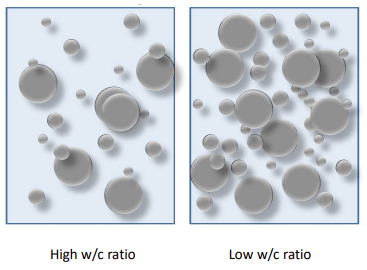
can you draw the graph relating w/c ratio to the compressive strength
The graph typically shows that as the water/cement (w/c) ratio increases, the compressive strength of concrete decreases. It often exhibits a nonlinear relationship, indicating significantly reduced strength at higher w/c ratios.

can you draw the graph of w/c ratio vs. porosity or permeability
The graph illustrates that as the water/cement (w/c) ratio increases, both porosity and permeability typically increase, demonstrating a positive correlation between these two properties.
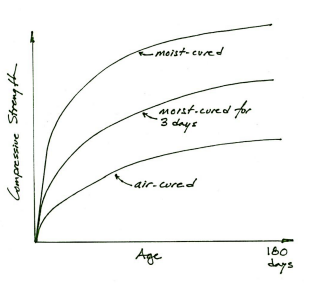
what is the effect of temperature on hydration
higher temperatures accelerate the hydration process, leading to increased strength devlopment
draw the effective moisture on hydration graph
what are the 4 components of hydrated cement paste to consider
CSH
Porosity (and water)
Calcium hydroxide
Ettringite
what are the physical features of CSH
not well crystallized materal and is compromised of extremely small irrecgular particles