Test 2 Review Operations Management
1/101
There's no tags or description
Looks like no tags are added yet.
Name | Mastery | Learn | Test | Matching | Spaced |
|---|
No study sessions yet.
102 Terms
Quality
The ability of a product or service to meet customer needs.
ISO 9000
A set of quality standards developed by the International Organization for Standardization (ISO).
ISO 14000
A series of environmental management standards established by the International Organization for Standardization (ISO).
Cost of quality (COQ)
The cost of doing things wrong—that is, the price of nonconformance.
Total quality management (TQM)
Management of an entire organization so that it excels in all aspects of products and services that are important to the customer.
PDCA (PLAN–DO–CHECK–ACT)
A continuous improvement model that involves four stages: plan, do, check, and act.
Six Sigma
A program to save time, improve quality, and lower costs.
Employee empowerment
Enlarging employee jobs so that the added responsibility and authority is moved to the lowest level possible in the organization.
Quality circle
A group of employees meeting regularly with a facilitator to solve work-related problems in their work area.
Benchmarking
Selecting a demonstrated standard of performance that represents the very best performance for a process or an activity.
INTERNAL BENCHMARKING
When an organization is large enough to have many divisions or business units, a natural approach is the internal benchmark. Data are usually much more accessible than from outside firms. Typically, one internal unit has superior performance worth learning from.
Quality robust (Taguchi)
Products that are consistently built to meet customer needs in spite of adverse conditions in the production process.
Quality loss function (QLF) (Taguchi)
A mathematical function that identifies all costs connected with poor quality and shows how these costs increase as product quality moves from what the customer wants: L= D2xC.
Just in Time Philosophy (JIT)
The philosophy behind just-in-time (JIT) is one of continuing improvement and enforced problem solving. JIT systems are designed to produce or deliver goods just as they are needed.
Taguchi Concepts (Three)
An approach developed by Dr. Genichi Taguchi that emphasizes the importance of quality in design and manufacturing, aiming to reduce variation and improve product robustness.
The three concepts include: Quality Robust, Quality Loss Function, and Target Oriented Quality.
Target-oriented quality (Taguchi)
A philosophy of continuous improvement to bring a product exactly on target.
Total Quality Management tools (seven)
The Seven TQM tools are essential techniques used to improve quality and streamline processes in organizations.
1.Check Sheets 2. Scatter Diagrams 3. Cause and Effect Diagrams 4. Pareto Charts 5. Flow Charts 6. Histograms 7.Statistical Process Control
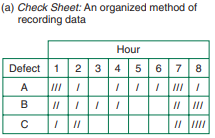
Check Sheet
Any kind of form that is designed for recording data. In many cases, the recording is done so the patterns are easily seen while the data are being taken
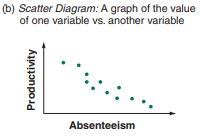
Scatter Diagram
Show the relationship between two measurements. An example is the positive relationship between length of a service call and the number of trips a repair person makes back to the truck for parts.
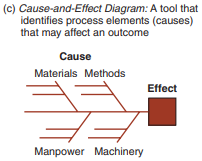
Cause and Effect Diagram
Another tool for identifying quality issues and inspection points is the cause-and-effect diagram, also known as an Ishikawa diagram or a fish-bone chart
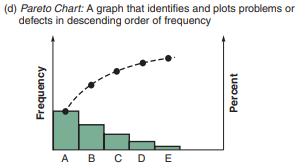
Pareto Chart
Graphics that identify the few critical items as opposed to many less important ones. It’s a method of organizing errors, problems, or defects to help focus on problem-solving efforts
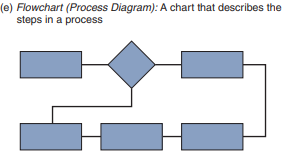
Flow Chart
Block diagrams that graphically describe a process or system.
They graphically present a process or system using annotated boxes and interconnected lines
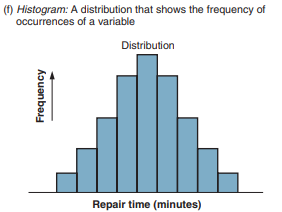
Histogram
Show the range of values of a measurement and the frequency with which each value occurs.
They show the most frequently occurring readings as well as the variations in the measurements. Descriptive statistics, such as the average and standard deviation, may be calculated to describe the distribution. However, the data should always be plotted so the shape of the distribution can be “seen”. A visual presentation of the distribution may also provide insight into the cause of the variation.
Statistical process control (SPC)
A process used to monitor standards, make measurements, and take corrective action as a product or service is being produced.
It monitors standards, makes measurements, and takes corrective action as a product or service is being produced. Samples of process outputs are examined; if they are within acceptable limits, the process is permitted to continue.
Control charts
Graphic presentations of process data over time, with predetermined control limits.
They are graphic presentations of data over time that show upper and lower limits for the process we want to control. Control charts are constructed in such a way that new data can be quickly compared with past performance data. We take samples of the process output and plot the average of each of these samples on a chart that has the limits on it. The upper and lower limits in a control chart can be in units of temperature, pressure, weight, length, and so on.
Inspection
A means of ensuring that an operation is producing at the quality level expected.
To make sure a system is producing at the expected quality level, control of the process is needed. The best processes have little variation from the standard expected. The operations manager’s task is to build such systems and to verify, often by inspection, that they are performing to standard. This inspection can involve measurement, tasting, touching, weighing, or testing of the product
What are the Implications of Quality?
Company Reputation: An organization can expect its reputation for quality—be it good or bad—to follow it. Quality will show up in perceptions about the firm’s new products, employment practices, and supplier relations. Self-promotion is not a substitute for quality products.
Product Liability: The courts increasingly hold organizations that design, produce, or distribute faulty products or services liable for damages or injuries resulting from their use. Legislation such as the Canadian Consumer Product Safety Act (CCPSA) sets and enforces product standards by banning products that do not reach those standards.
Global Implications: In this technological age, quality is an international, as well as OM, concern. For both a company and a country to compete effectively in the global economy, products must meet global quality, design, and price expectations.
Describe the Costs of Quality
Prevention Costs: costs associated with reducing the potential for defective parts or services
Appraisal Costs: costs related to evaluating products, processes, parts, and services
Internal Failure: costs that result from production of defective parts or services before delivery to customers
External Costs: costs that occur after delivery of defective parts or services
Natural Variation (SPC)
Variability that affects every production process to some degree and is to be expected; also known as common cause.
(Terms) affect almost every production process and are to be expected. (Term) is the many sources of variation that occur within a process that is in statistical control.
Assignable variation
Variation in a production process that can be traced to specific causes.
(Term) in a process can be traced to a specific reason. Factors such as machine wear, misadjusted equipment, fatigued or untrained workers, or new batches of raw material are all potential sources of assignable variation.
Process Capability
Statistical process control means keeping a process in control. This means that the natural variation of the process must be stable. But a process that is in statistical control may not yield goods or services that meet their design specifications (tolerances). The ability of a process to meet design specifications, which are set by engineering design or customer requirements, is called (Term)
Acceptance sampling
A method of measuring random samples of lots or batches of products against predetermined standards.
a form of testing that involves taking random samples of “lots,” or batches, of finished products and measuring them against predetermined standards. Sampling is more economical than 100% inspection.
Producer’s risk
The mistake of having a producer’s good lot rejected through sampling
Consumer’s risk
The mistake of a customer’s acceptance of a bad lot overlooked through sampling.
Acceptable quality level (AQL)
The quality level of a lot considered good.
Lot tolerance percentage defective (LTPD)
The quality level of a lot considered bad.
Type I error
Statistically, the probability of rejecting a good lot.
Type II error
Statistically, the probability of accepting a bad lot.
Average outgoing quality (AOQ)
The percentage defective in an average lot of goods inspected through acceptance sampling.
Tangible costs
Readily identifiable costs that can be measured with some precision.
Intangible costs
A category of location costs that cannot be easily quantified, such as quality of life and government.
Clustering
The location of competing companies near each other, often because of a critical mass of information, talent, venture capital, or natural resources.
Factor rating method
A location method that instils objectivity into the process of identifying hard-to-evaluate costs.
Locational break-even analysis
A cost–volume analysis to make an economic comparison of location alternatives.
is the use of cost–volume analysis to make an economic comparison of location alternatives. By identifying fixed and variable costs and graphing them for each location, we can determine which one provides the lowest cost. Locational break-even analysis can be done mathematically or graphically. The graphic approach has the advantage of providing the range of volume over which each location is preferable.
Centre-of-gravity method
A mathematical technique used for finding the best location for a single distribution point that services several stores or areas.
a mathematical technique used for finding the location of a distribution centre that will minimize distribution costs. The method takes into account the location of markets, the volume of goods shipped to those markets, and shipping costs in finding the best location for a distribution centre.
Transportation model
A technique for solving a class of linear programming problems.
to determine the best pattern of shipments from several points of supply (sources) to several points of demand (destinations) so as to minimize total production and transportation costs. Every firm with a network of supply-and-demand points faces such a problem.
Geographic information system (GIS)
A system that stores and displays information that can be linked to a geographic location.
stores and displays information that can be linked to a geographical location. For instance, retailers, banks, food chains, gas stations, and print shop franchises can all use geographically coded files from a (Term) to conduct demographic analyses. By combining population, age, income, traffic flow, and density figures with geography, a retailer can pinpoint the best location for a new store or restaurant.
The Strategic Importance of Layout Decisions
The objective of layout strategy is to develop an effective and efficient layout that will meet the firm’s competitive requirements.
• Higher utilization of space, equipment, and people.
• Improved flow of information, materials, or people.
• Improved employee morale and safer working conditions.
• Improved customer/client interaction.
• Flexibility (whatever the layout is now, it will need to change).
Office Layout
Positions workers, their equipment, and spaces/offices to provide for movement of information.
The grouping of workers, their equipment, and spaces/offices to provide for comfort, safety, and movement of information.
The main distinction of (Term) layouts is the importance placed on the flow of information. (Term) layouts are in constant flux as the technological change sweeping society alters the way offices function
Retail layout
Allocates shelf space and responds to customer behaviour.
An approach that addresses flow, allocates space, and responds to customer behaviour.
is based on the idea that sales and profitability vary directly with customer exposure to products. Thus, most operations managers try to expose customers to as many products as possible. Studies do show that the greater the rate of exposure, the greater the sales and the higher the return on investment
Warehouse layout
Addresses trade-offs between space and material handling.
A design that attempts to minimize total cost by addressing trade-offs between space and material handling.
The objective of (Term) is to find the optimum trade-off between handling costs and costs associated with warehouse space. Consequently, management’s task is to maximize the utilization of the total “cube” of the warehouse—that is, utilize its full volume while maintaining low material handling costs. We define material handling costs as all the costs related to the transaction. This consists of incoming transport, storage, and outgoing transport of the materials to be warehoused.
Fixed-position layout
Addresses the layout requirements of large, bulky projects such as ships and buildings.
A system that addresses the layout requirements of stationary projects.
In a (Term) layout, the project remains in one place, and workers and equipment come to that one work area. Examples of this type of project are a ship, a highway, a bridge, a house, and an operating table in a hospital operating room. The techniques for addressing the fixed-position layout are complicated by three factors. First, there is limited space at virtually all sites. Second, at different stages of a project, different materials are needed; therefore, different items become critical as the project develops. Third, the volume of materials needed is dynamic.
Process-oriented layout
Deals with low-volume, high-variety production (also called job shop or intermittent production)
A layout that deals with low-volume, high-variety production in which like machines and equipment are grouped together.
A (Term) can simultaneously handle a wide variety of products or services. This is the traditional way to support a product differentiation strategy. It is most efficient when making products with different requirements or when handling customers, patients, or clients with different needs. A (Term) is typically a low-volume, high-variety strategy
Work-cell layout
Arranges machinery and equipment to focus on production of a single product or group of related products.
An arrangement of machines and personnel that focuses on making a single product or family of related products.
A (Term) reorganizes people and machines that would ordinarily be dispersed in various departments into a group so that they can focus on making a single product or a group of related products. (Term) arrangements are used when volume warrants a special arrangement of machinery and equipment.
Product-oriented layout (repetitive)
Seeks the best personnel and machine utilization in repetitive or continuous production.
(Term) are organized around products or families of similar high-volume, low-variety products. Repetitive production and continuous production, use (Term) layouts. The assumptions are that:
1. Volume is adequate for high equipment utilization.
2. Product demand is stable enough to justify high investment in specialized equipment.
3. Product is standardized or approaching a phase of its life cycle that justifies investment in specialized equipment.
4. Supplies of raw materials and components are adequate and of uniform quality (adequately standardized) to ensure that they will work with the specialized equipment.
Two types of (Term) are fabrication and assembly lines. The fabrication line builds components, such as automobile tires or metal parts for a refrigerator, on a series of machines, while an assembly line puts the fabricated parts together at a series of workstations. However, both are (Term) processes, and in both cases, the line must be “balanced”.
Material handling equipment
Managers must decide about equipment to be used, including conveyors, cranes, automated storage and retrieval systems, and automatic carts to deliver and store material.
Capacity and space requirements
Only when personnel, machines, and equipment requirements are known can managers proceed with layout and provide space for each component.
Supply chain management
Management of activities that procure materials and services, transform them into intermediate goods and final products, and deliver them through a distribution system.
(term) is the integration of the activities that procure materials and services, transform them into intermediate goods and final products, and deliver them to customers. These activities include purchasing and outsourcing activities, plus many other functions that are important to the relationship with suppliers and distributors.
Low Cost Strategy
Features of (Term) Strategy
Goal: Supply Demand at lowest possible cost
Selection: For Cost
Maintains High Utilization
Minimize inventory throughout the chain to hold down Costs
Shorten Lead time as long as costs are not increased by doing so
Maximize performance, minimize cost
Response Strategy
Features of (Term) Strategy:
Respond Quickly to Changing Requirements and demand to minimize stockouts
Select primarily for capacity, speed and flexibility
Invest in excess capacity, speed and flexibility
Develop responsive system, with buffer stocks positioned to ensure supply
Invest aggressively to reduce production lead time
Use product designs that lead to low setup time and rapid production ramp-up
Differentiation Strategy
Features of (Term) Strategy:
Share market research; jointly develop products and options
Select primarily for product development skills
Use modular processes that lend themselves to mass customization
Minimize inventory in the chain to avoid obsolescence
Invest aggressively to reduce development lead time
Use modular design to postpone product differentiation for as long as possible
Issues in an integrated supply chain
Three issues complicate development of an efficient, integrated supply chain: local optimization, incentives, and large lots.
Local Optimization
Members of the chain are inclined to focus on maximizing local profit or minimizing immediate cost based on their limited knowledge. Slight upturns in demand are overcompensated for because no one wants to be caught short. Similarly, slight downturns are overcompensated for because no one wants to be caught holding excess inventory. So fluctuations are magnified.
Incentives
Incentives push merchandise into the chain for sales that have not occurred. This generates fluctuations that are ultimately expensive to all members of the chain.
Large Lots
There is often a bias towards large lots because large lots tend to reduce unit costs. A logistics manager wants to ship large lots, preferably in full trucks, and a production manager wants long production runs. Both actions drive down unit shipping and production costs but fail to reflect actual sales and increased holding costs
Bullwhip Effect
The increasing fluctuation in orders that often occurs as orders move through the supply chain.
occurs as orders are relayed from retailers, to distributors, to wholesalers, to manufacturers, with fluctuations increasing at each step in the sequence. The “bullwhip” fluctuations in the supply chain increase the costs associated with inventory, transportation, shipping, and receiving, while decreasing customer service and profitability.
Accurate Pull Data (Opportunity in an integrated supply chain)
Accurate sales data that initiate transactions to “pull” product through the supply chain.
Single-stage control of replenishment (Opportunity in an integrated supply chain)
Fixing responsibility for monitoring and managing inventory for the retailer.
Opportunities in an integrated supply chain
Accurate Pull Data
Lot-Size Reduction
Single Stage Control of Replenishment
Vendor-Managed Inventory
Collaborative Planning, Forecasting and Replenishment
Blanket Orders
Standardization
Postponement
Drop Shipping and Special Packaging
Pass Through Facility
Channel Assembly
Lot Size Reduction
reduced through aggressive management. This may include (1) developing economical shipments of less than truckload lots; (2) providing discounts based on total annual volume rather than size of individual shipments; and (3) reducing the cost of ordering through techniques such as standing orders and various forms of electronic purchasing.
Vendor-Managed Inventory
A system in which a supplier maintains material for the buyer, often delivering directly to the buyer’s using department.
means the use of a local supplier (usually a distributor) to maintain inventory for the manufacturer or retailer. The supplier delivers directly to the purchaser’s using department rather than to a receiving dock or stockroom. If the supplier can maintain the stock of inventory for a variety of customers who use the same product or whose differences are very minor (say, at the packaging stage), then there should be a net savings. These systems work without the immediate direction of the purchaser.
Collaborative Planning, Forecasting and Replenishment
A joint effort of members of a supply chain to share information in order to reduce supply chain costs.
Like single-stage control and vendor-managed inventory, (Term) is another effort to manage inventory in the supply chain. With (Term), members of the supply chain share planning, forecasting, and inventory information. Partners in a (Term) effort begin with collaboration on product definition and a joint marketing plan. Promotion, advertising, forecasts, and timing of shipments are all included in the plan in a concerted effort to drive down inventory and related costs
Blanket Orders
A long-term purchase commitment to a supplier for items that are to be delivered against shortterm releases to ship
Standardization
The purchasing department should make special efforts to increase levels of standardization. That is, rather than obtaining a variety of similar components with labelling, colouring, packaging, or perhaps even slightly different engineering specifications, the purchasing agent should try to have those components standardized.
Postponement
Delaying any modifications or customization to a product as long as possible in the production process.
withholds any modification or customization to the product (keeping it generic) as long as possible. The concept is to minimize internal variety while maximizing external variety.
Drop shipping
Shipping directly from the supplier to the end consumer rather than from the seller, saving both time and reshipping costs.
means the supplier will ship directly to the end consumer, rather than to the seller, saving both time and reshipping costs. Other cost-saving measures include the use of special packaging, labels, and optimal placement of labels and barcodes on containers.
Pass-through facility
A facility that expedites shipment by holding merchandise and delivering from shipping hubs.
is a distribution centre where merchandise is held, but it functions less as a holding area and more as a shipping hub. These facilities, often run by logistics vendors, use the latest technology and automated systems to expedite orders.
Channel assembly
A system that postpones final assembly of a product so the distribution channel can assemble it.
is an extension of the pass-through facility. (Term) sends individual components and modules, rather than finished products, to the distributor. The distributor then assembles, tests, and ships. (Term) treats distributors more as manufacturing partners than as distributors. This technique has proven successful in industries where products are undergoing rapid change, such as personal computers. With this strategy, finished goods inventory is reduced because units are built to a shorter, more accurate forecast. Consequently, market response is better, with lower investment—a nice combination.
Eprocurement
Purchasing facilitated through the internet.
uses the internet to facilitate purchasing. (Term) speeds purchasing, reduces costs, and integrates the supply chain, enhancing an organization’s competitive advantage. The traditional supply chain is full of paper transactions, such as requisitions, requests for bids, bid evaluations, purchase orders, order releases, receiving documents, invoices, and the issuance of cheques. (Term) reduces this barrage of paperwork and at the same time provides purchasing personnel with an extensive database of vendor, delivery, and quality data. With this history, vendor selection has improved.
Electronic data interchange (EDI)
A standardized data-transmittal format for computerized communications between organizations.
which is a standardized data-transmittal format for computerized communications between organizations. EDI provides data transfer for virtually any business application, including purchasing. Under EDI, data for a purchase order—such as order date, due date, quantity, part number, purchase order number, address, and so forth—are fitted into the standard EDI format. EDI also provides for the use of advanced shipping notice (ASN),
Advanced shipping notice (ASN)
A shipping notice delivered directly from vendor to purchaser.
which notifies the purchaser that the vendor is ready to ship. Although some firms are still moving to EDI and ASN, the internet’s ease of use and lower cost is proving more popular.
Request for Quotation
When purchasing requirements are nonstandard, time spent preparing requests for quotes (RFQs) and the related bid package can be substantial. Consequently, eprocurement has now moved these often expensive parts of the purchasing process online, allowing purchasing agents to inexpensively attach electronic copies of the necessary drawings to RFQs.
Real Time Inventory Tracking
FedEx’s pioneering efforts at tracking packages from pickup to delivery have shown the way for operations managers to do the same for their shipments and inventory. Because tracking cars and trucks has been a chronic and embarrassingly inexact science, Ford has hired UPS to track millions of vehicles as they move from factory to dealers. Using barcodes and the internet, Ford dealers are now able to log onto a website and find out exactly where the ordered vehicles are in the distribution system.
Distribution Systems
Trucking
Railroads
Airfreight
Waterways
Pipelines
Multimodal
Trucking (Distribution System)
The vast majority of manufactured goods moves by t(Term). The flexibility of shipping by (Term) is only one of its many advantages. Companies that have adopted JIT programs in recent years have put increased pressure on (Term) to pick up and deliver on time, with no damage, with paperwork in order, and at low cost
Railroads (Distribution System)
Transport System Responsible for 70% of surface good movement. due to JIT, this transport method is Dying.
Airfreight (Distribution System)
Fastest growing method of shipping, for national and international shipping.
Waterways (Distribution System)
bulky, low-value cargo such as iron ore, grains, cement, coal, chemicals, limestone, and petroleum products. Internationally, millions of containers are shipped at very low cost via huge oceangoing (Term) each year.
Pipelines (Distribution System)
an important form of transport that transports crude oil, natural gas, and other petroleum and chemical products
Multimodal (Distribution System)
shipping combines shipping methods and is a common means of getting a product to its final destination, particularly for international shipments.
SCOR Model (Supply Chain Operations Reference Model)
The five parts are plan, source, make, deliver, and return
The council believes the model provides a structure for its processes, metrics, and best practices to be (1) implemented for competitive advantage; (2) defined and communicated precisely; (3) measured, managed, and controlled; and (4) fine-tuned as necessary to a specific application.
Functions of inventory
1. To “decouple” or separate various parts of the production process.
2. To decouple the firm from fluctuations in demand and provide a stock of goods that will provide a selection for customers.
3. To take advantage of quantity discounts, because purchases in larger quantities may reduce the cost of goods or their delivery.
4. To hedge against inflation and upward price changes
ABC Analysis
A method for dividing on-hand inventory into three classifications based on annual dollar volume.
analysis is an inventory application of what is known as the Pareto principle (named after Vilfredo Pareto, a 19th-century Italian economist). The Pareto principle states that there are a “critical few and trivial many”. The idea is to establish inventory policies that focus resources on the few critical inventory parts and not the many trivial ones. It is not realistic to monitor inexpensive items with the same intensity as very expensive items.
how to implement ABC Analysis
To determine annual dollar volume for ABC analysis, we measure the annual demand of each inventory item times the cost per unit. Class A items are those on which the annual dollar volume is high. Although such items may represent only about 15% of the total inventory items, they represent 70% to 80% of the total dollar usage. Class B items are those inventory items of medium annual dollar volume. These items may represent about 30% of inventory items and 15% to 25% of the total value. Those with low annual dollar volume are Class C, which may represent only 5% of the annual dollar volume but about 55% of the total inventory items.
Independent Versus Dependent Demand
Inventory control models assume that demand for an item is either independent of or dependent on the demand for other items. For example, the demand for refrigerators is independent of the demand for toaster ovens. However, the demand for toaster oven components is dependent on the requirements of toaster ovens.
Holding cost
The cost to keep or carry inventory in stock.
Therefore, holding cost also includes obsolescence and costs related to storage, such as insurance, extra staffing, and interest payments.
Ordering cost
The cost of the ordering process
costs of supplies, forms, order processing, purchasing, clerical support, and so forth. When orders are being manufactured, ordering costs also exist, but they are a part of what is called setup costs.
Setup cost
The cost to prepare a machine or process for production.
This includes time and labour to clean and change tools or holders. Operations managers can lower ordering costs by reducing setup costs and by using such efficient procedures as electronic ordering and payment
Economic Order Quantity Model
An inventory control technique that minimizes the total of ordering and holding costs.
This technique is relatively easy to use but is based on several assumptions: 1. Demand for an item is known, reasonably constant, and independent of decisions for other items.
2. Lead time—that is, the time between placement and receipt of the order—is known and consistent.
3. Receipt of inventory is instantaneous and complete. In other words, the inventory from an order arrives in one batch at one time.
4. Quantity discounts are not possible.
5. The only variable costs are the cost of setting up or placing an order (setup or ordering cost) and the cost of holding or storing inventory over time (holding or carrying cost). These costs were discussed in the previous section.
6. Stockouts (shortages) can be completely avoided if orders are placed at the right time.
Production Order Quantity Model
An economic order quantity technique applied to production orders.
It is useful when inventory continuously builds up over time, and traditional economic order quantity assumptions are valid.