PSYC2012 Intro to Null Hypothesis Significance Testing
 Call Kai
 Learn
Learn Practice Test
 Spaced Repetition
 Match
Match Flashcards
 Knowt Play
1/15

There's no tags or description
Looks like no tags are added yet.
Name | Mastery | Learn | Test | Matching | Spaced | Call with Kai | Chat |
|---|
No analytics yet
Send a link to your students to track their progress
16 Terms
Population
Refers to all cases with the target characteristic (e.g. people with chronic pain, women, people, age bracket)
> NOTE: study sample is considered population bc random sampling = representative
Sample
Subset of population used for study
Principles of Hypothesis Testing
Random Sampling = Representativeness
> Every member of target population has equal chance of selection
> Sample statistics reliably represent population parameters
> Sample mean (X-bar) roughly equivalent to population mean (Mu subscript x)
Descriptive vs. Inferential Stats
Inferential statistics makes predictions about a population based on a sample of data taken from the population in question.
> Descriptive still useful (e.g. in clinical practice to see whether patients are improving)
> Inferential = research focus (e.g. does intervention efficacy generalise to population?)
Method of Hypothesis Testing
Methodological Process of Hypothesis Testing
1. Devise intervention
- Operationalise independent variable
- Intervention is derived from theory
2. Determine how to assess dependent variable
- Operationalise dependent variable
- Consider outcome (e.g. pain interference or pain intensity)
3. Determine how to judge whether intervention was effective
- Select a comparator: effective compared to what? (usually alternative treatment because anything can be better than nothing)
- Compare single sample to normative data or pre- & post-test values
- Compare mean values in single-factor design with control & intervention group
4. Collect data
5. Run a statistical test
6. Make a statistical decision
7. Draw a conclusion (Statistical inference RE population based on sample)
Null Hypothesis
> Assume there is no effect/association
> Statement of population parameters
> Denoted as H subscript 0
> Logic = seek evidence against (falsifiability produces more reliable conclusions than seeking evidence of confirmation
> Basis of P-value
P-Value
P ( obs | H0)
> Probability of obtaining the sample mean if null is true.
> If probability is small, null hypothesis is rejected: p>.05 = retain null, if p<.05 reject.
> Measure of how reliable a result is to rule out possibility that result was random/product of chance.
Sampling Distribution
Probability Distribution: means taken by the statistic in all possible samples of the same size from the same population
> Shows experimental variability
> Shows likelihood of obtaining result if null is true (basis of p-value)
> Tends to be normal
Central Limit Theorem
Principle With a large enough sample size, sampling distribution becomes/tends normal even if data is skewed.
Outcome Inference can be made for n = 30+
Variance of Sampling Distribution
Calc: sample variance / sample size
NOTE: Don't overthink...
> Variance is a function of sample size (sample means have smaller variance)
Standard Error
The standard deviation of the sampling distribution NOT the raw score distribution.
> Calc: standard deviation / sample size
> Used to calculate p-value
> SE decreases among larger sample sizes because variability is less pronounced than compared with small sample
One-Sample Z-Test
Used to determine whether a sample mean differs significantly from a population mean.
> Assumes population variance is KNOWN.
> Requires large sample (n>30)
> Calc: sample mean - null hypothesis population mean / standard error
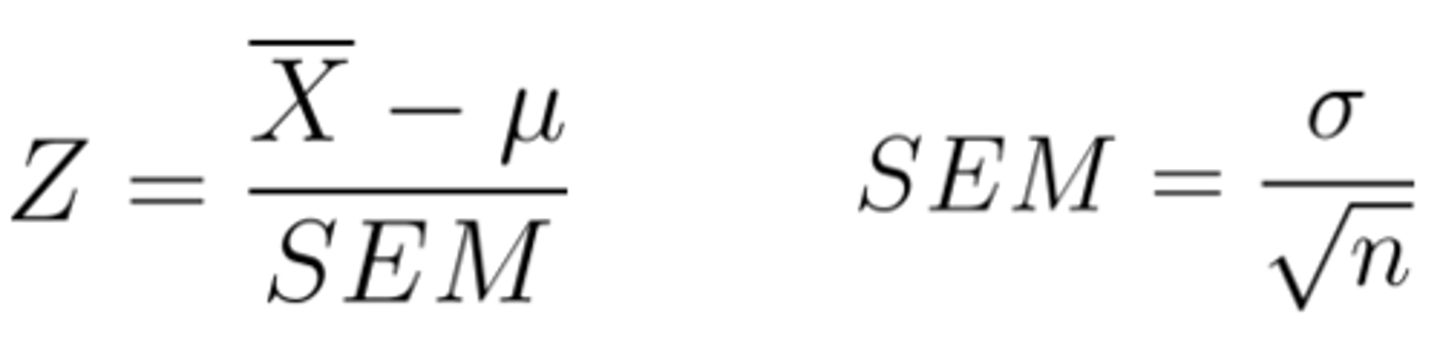
Critical Z Approach
Critical Z corresponds to significance threshold.
Alpha .05 (95% CI) = +-1.96
Alpha .01 (90% CI) = +-1.645
E.G.
Critical P Approach
Calculates P-value corresponding to observed Z-score & compares to significance threshold.
Examples When Z-Test is Appropriate
Scenario = standardised testing or quality control.
E.G. A factory produces light bulbs that are supposed to last an average of 1,000 hours, with a known standard deviation of 50 hours. A sample of 100 bulbs is tested to see if the average life is significantly different from 1,000 hours.
E.G. Testing if a new teaching method changes student IQ scores compared to the known national average of 100 (with a known population standard deviation of 15).
One- vs. Two-Tailed Z-Test
One Relationship in a specific direciton
Two Difference in either direction
(HA does not equal H0)
NOTE: Alpha for two-tailed test is split in two so each tail gets .025