3 Map abstraction and symbolization
 Call Kai
 Learn
Learn Practice Test
 Spaced Repetition
 Match
Match Flashcards
 Knowt Play
1/31

Earn XP
Description and Tags
VL: Week 3, Buch: Kap 4
Name | Mastery | Learn | Test | Matching | Spaced | Call with Kai | Chat |
|---|
No analytics yet
Send a link to your students to track their progress
32 Terms
Cartographic abstraction process
Why is a map a model?
Map is a model that simplifies the complex reality of locations and attributes
Cartographic abstraction process
What is the function of a map?
Mapping is at least 2D and has to be reduced in a scale-dependent way for a pragmatic use
Cartographic abstraction process
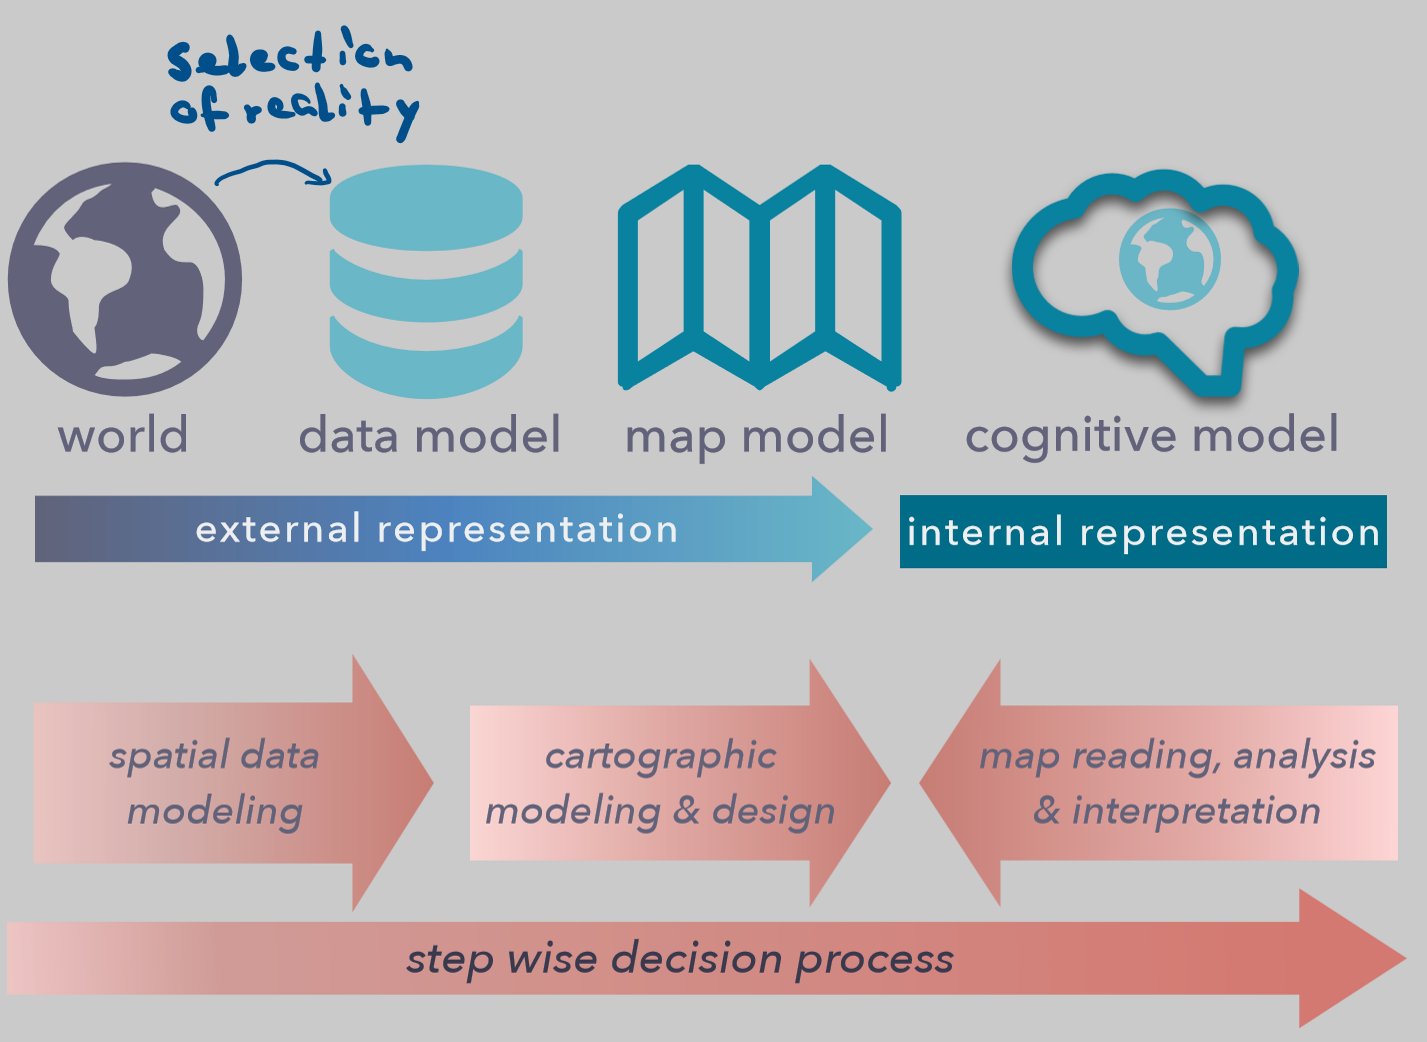
What is the definition of map abstraction?
Process of transforming real-world phenomena or features into map elements
Cartographic abstraction process
What are features?
anything found on the earth’s surface can be represented on a map
Features can represent different types of geographic entities:
points
lines
polygons
networks
surfaces
→ each feature has associated attributes that provide more information (e.g. name, size, classification etc)
Cartographic abstraction process
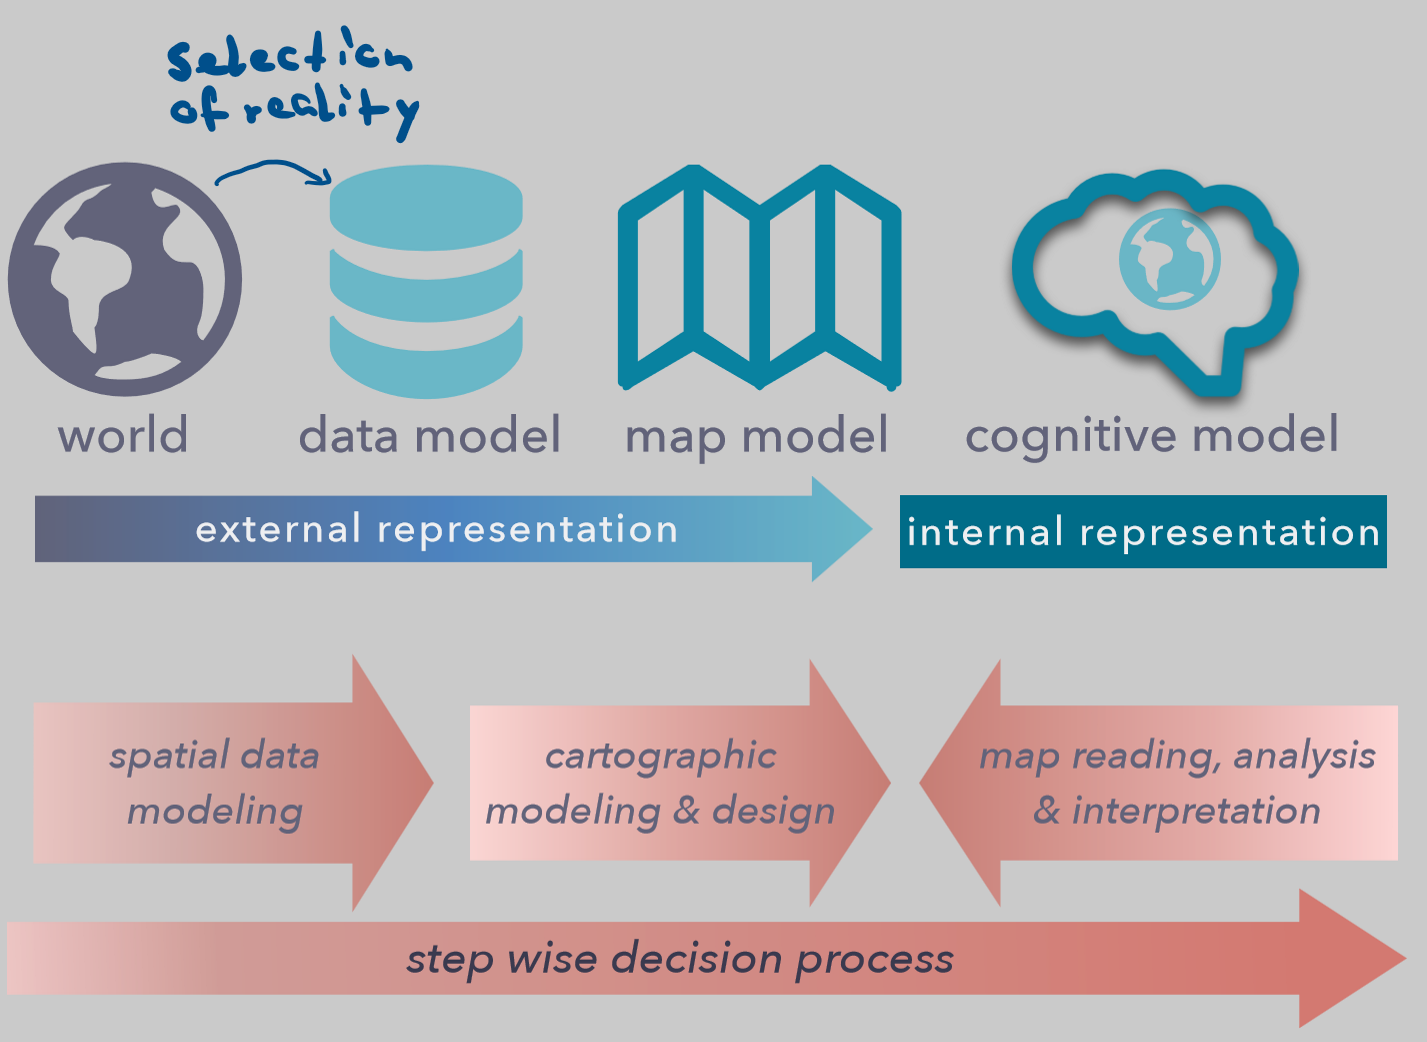
What do you have to know before symbolizing features?
Data model should include
feature type (point / linear / areal)
characteristics (discrete / discontinuous / continuous)
measurement levels (nominal / ordinal / interval / ratio)
To make the map model by using
map symbol (point / line / polygon)
visual variable (size / colour value / colour hue / texture / orientation / shape)
Cartographic abstraction process
How would you categorize different features?
Physical (in physical geography)
Abstract or conceptual features (in human geography)
Process based features
Cartographic abstraction process
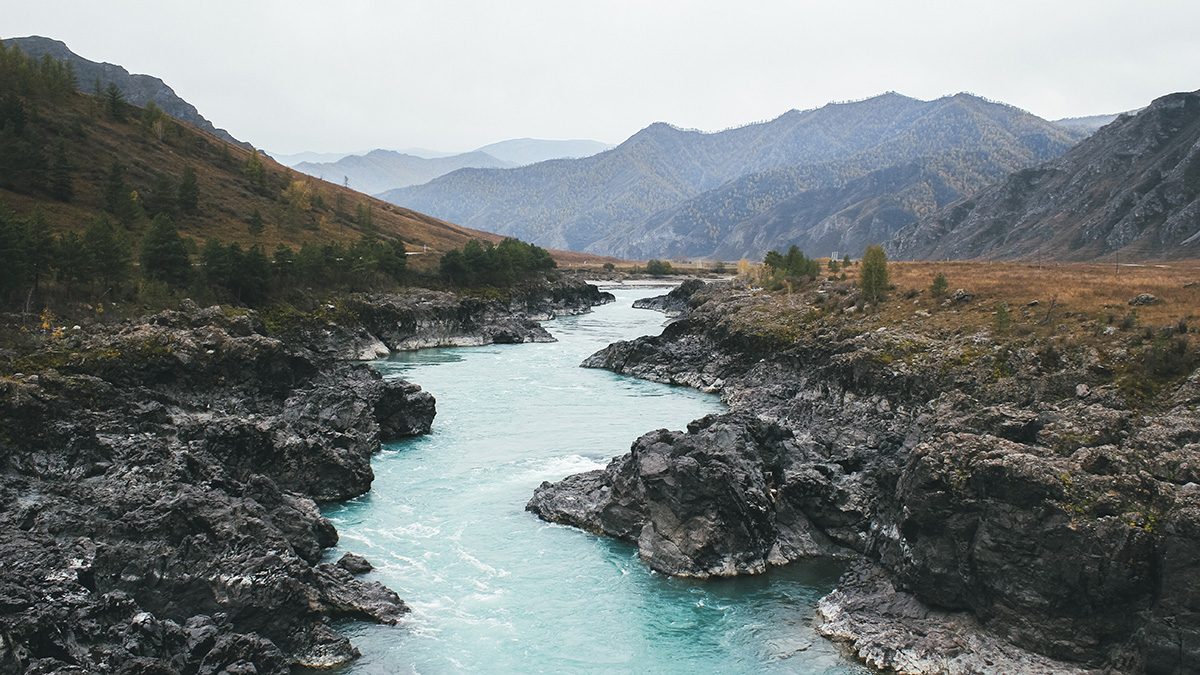
Physical features
What is their inherent nature (multiple)?
Name examples
tangible: mountains, rivers, trees
intangible: air masses
Transient: earthquake
→ physical geography
Cartographic abstraction process
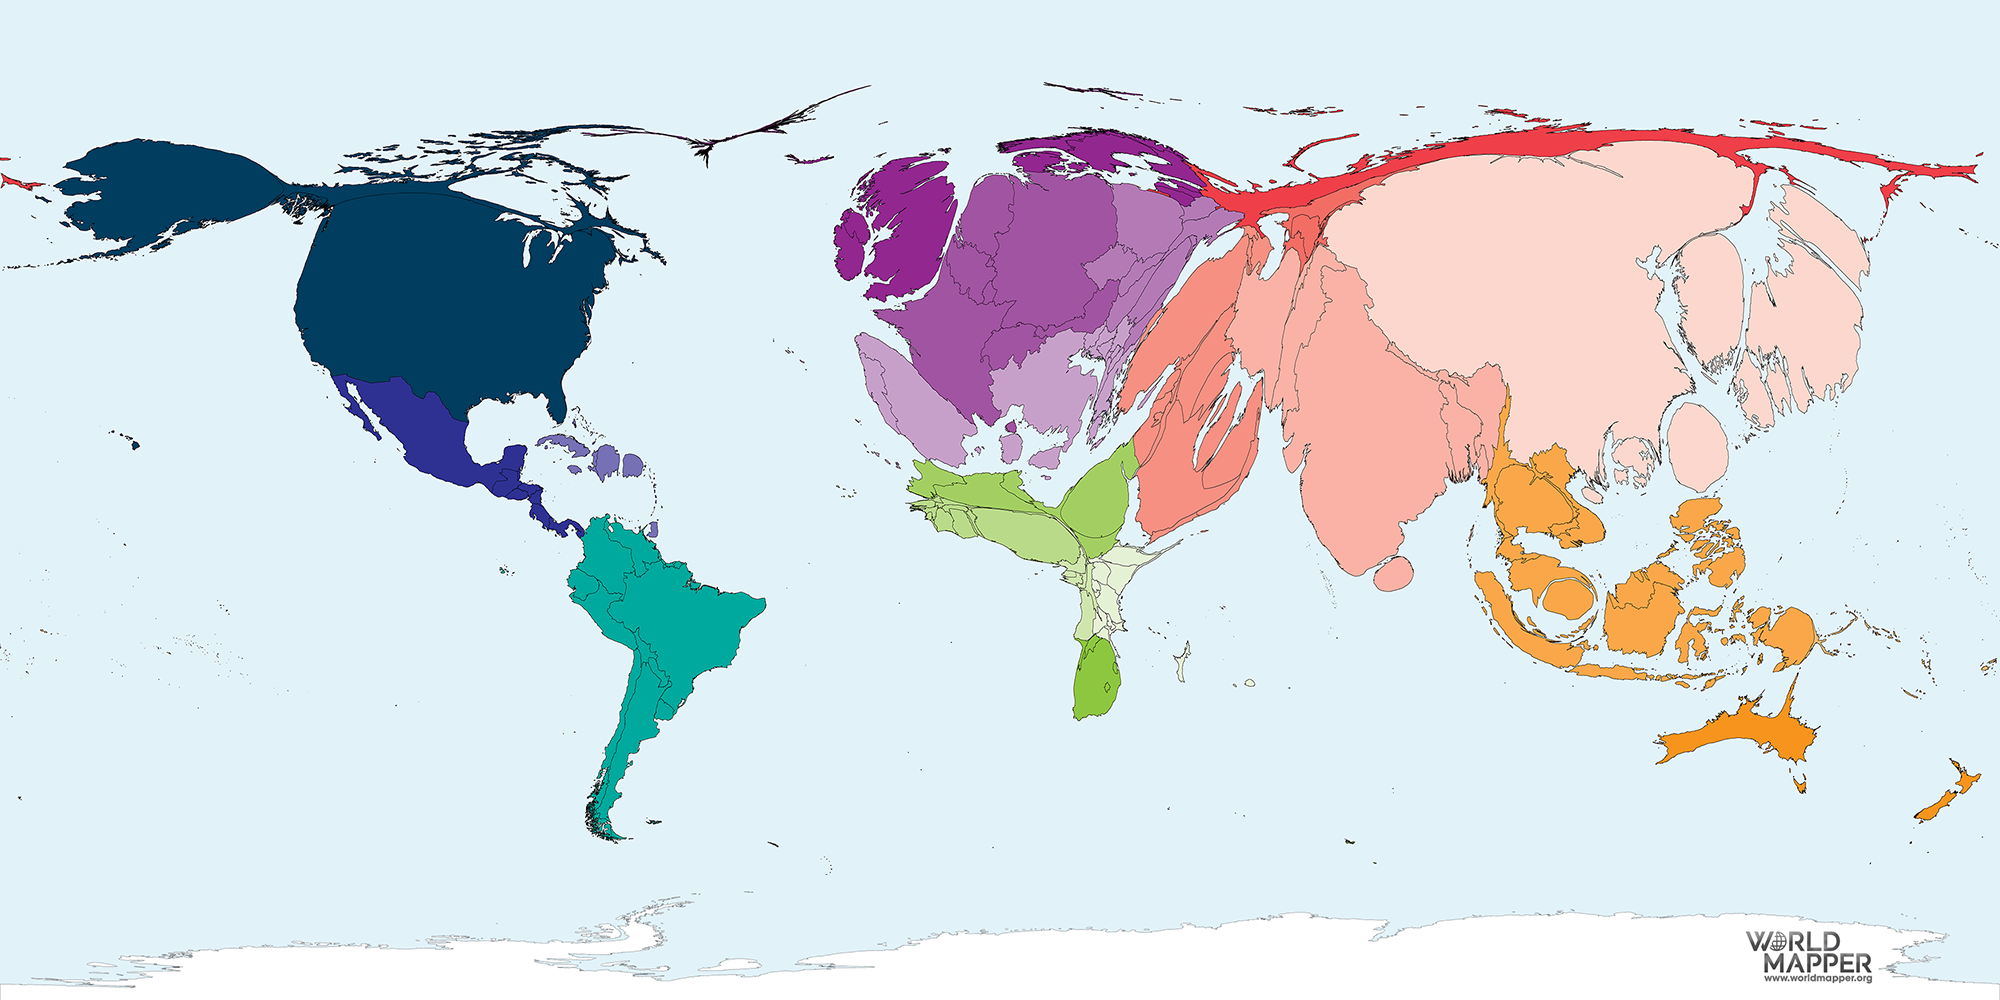
Abstract or conceptual features
What is their inherent nature?
Name examples
visible on maps:
population density
GDP
district
Cartographic abstraction process
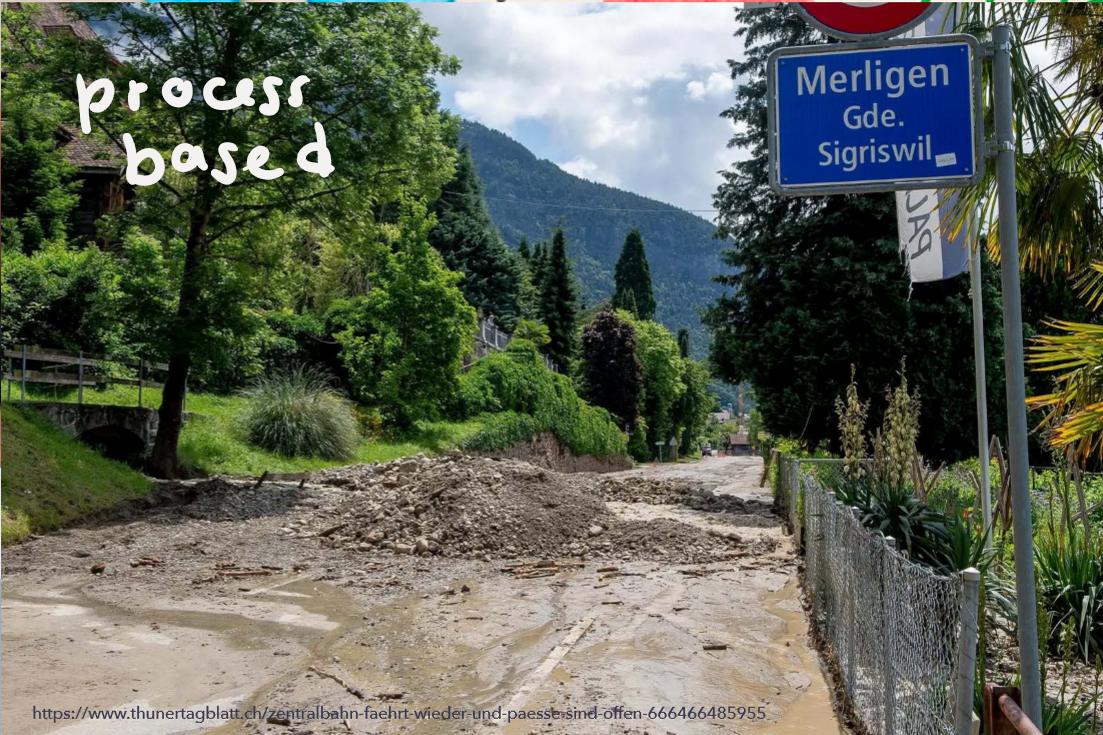
Process based features
What is their inherent nature?
Name examples
show change
mud-flow
Cartographic abstraction process
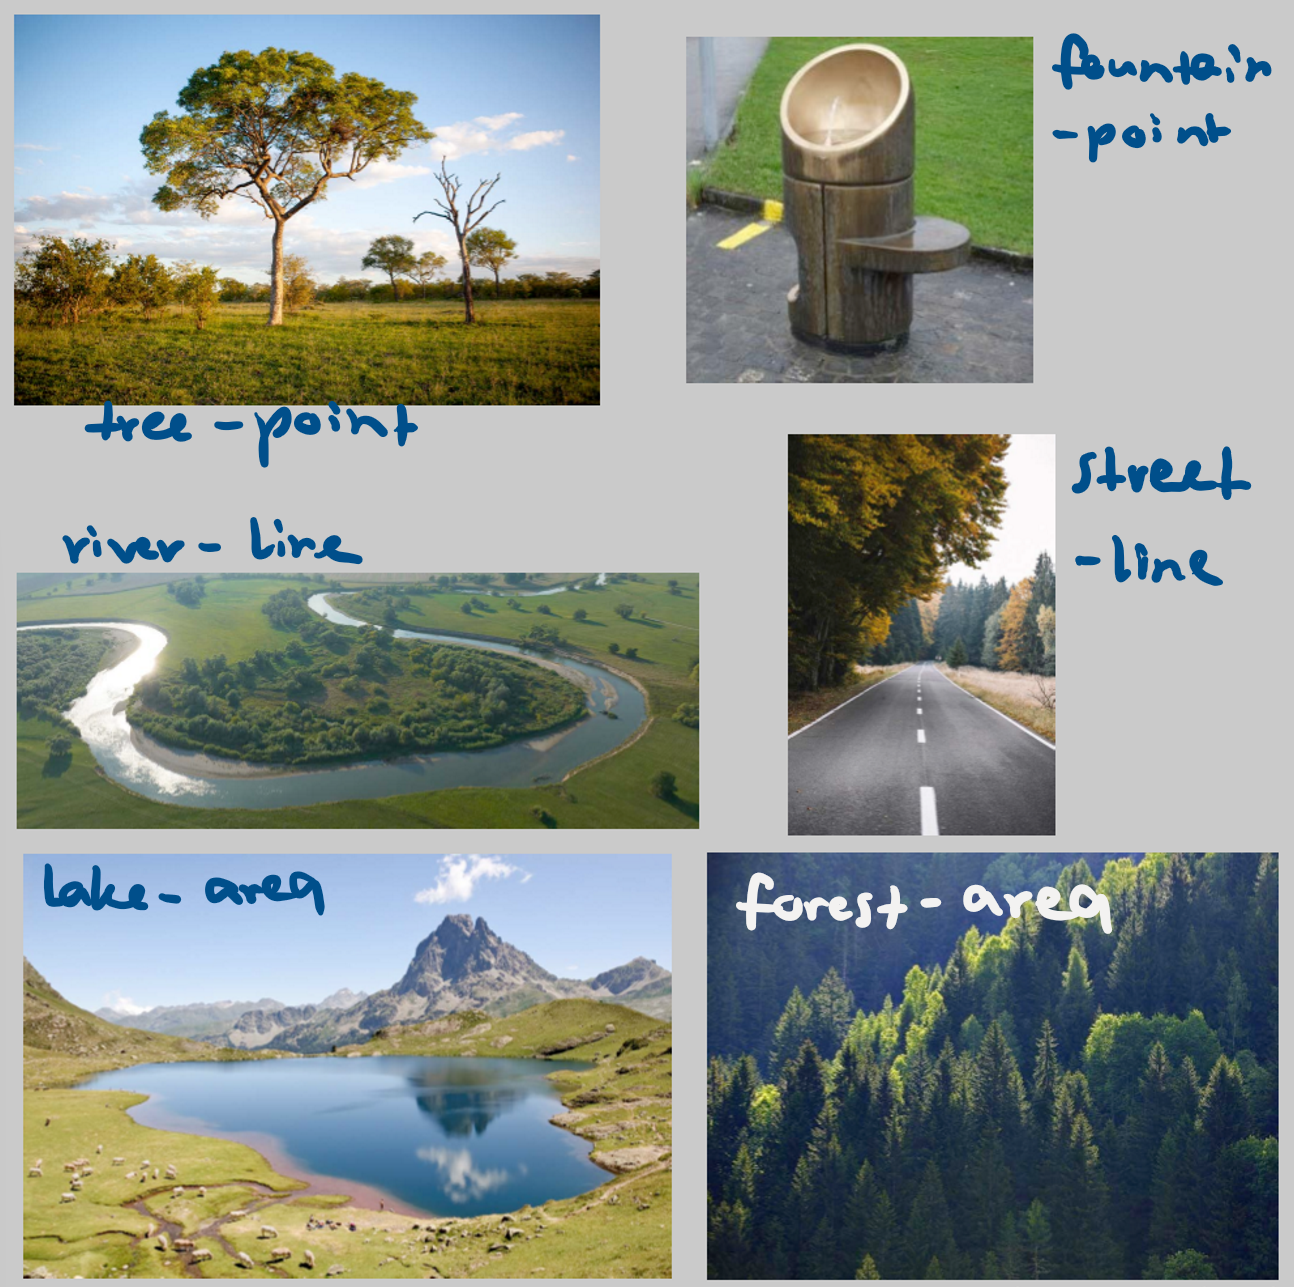
Name examples for features that can be mapped as points / lines and areas
Cartographic abstraction process
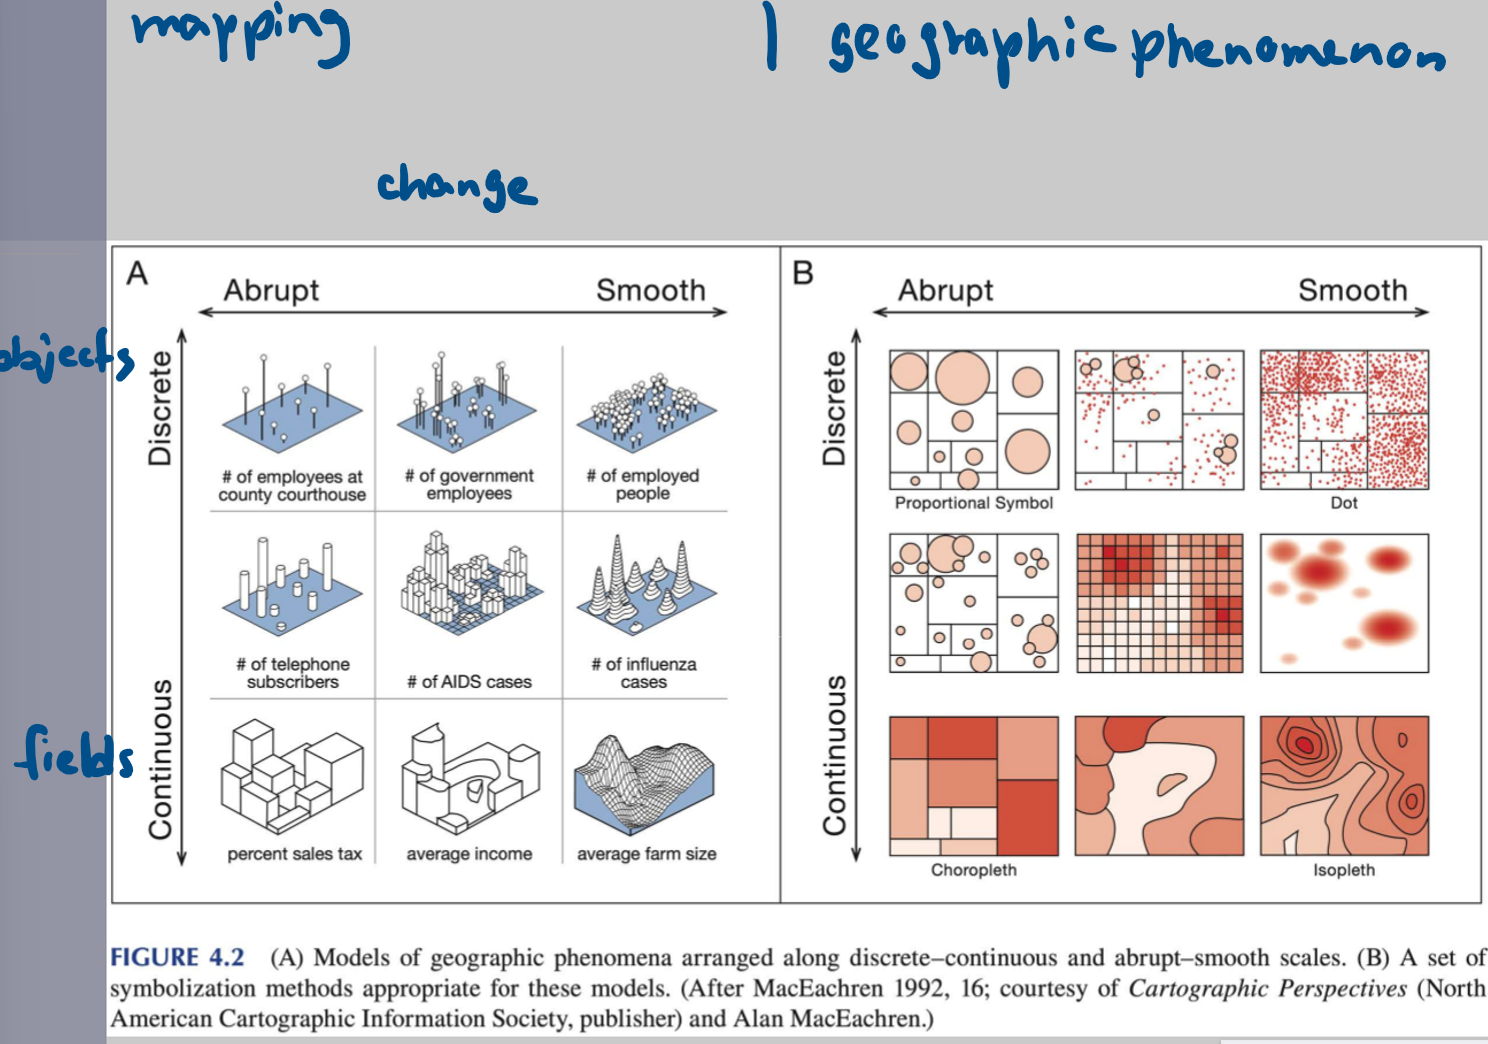
What are discrete features?
What are continuous features?
Refer to GEO 113 and name examples
Discrete:
empty space with discrete features/objects
buildings
people
streets
Continuous:
Fields on which values can be measured anywhere
earth surface
water bodies
ecozones
Cartographic abstraction process
In which spatial dimensions are features represented/stored in GIS?
(Spatial Dimension, represented on map, examples)
0D as point: e.g. building
1D as line: e.g. river
2D as area: e.g. forest
3D as volume: e.g. glaciers
4D as a volume or feature that changes over time: e.g. ocean current
Cartographic abstraction process
What are the 4 levels of measurement?
What can you do with them mathematically (in brackets)?
Properties of variables
Qualitative / Categorical
nominal (no calculations)
ordinal (ranking, no calculations)
Quantitative
interval (ranking, gap between numbers relevant)
ratio (same as interval + Ratios and percentiles reasonable)
Cartographic abstraction process
Give examples for each of the 4 levels of measurement
Qualitative / Categorical
nominal: labels, gender, region name
ordinal: country rank, level of difficulty
Quantitative
interval: temperature
ratio: number of citizens, weight, change in rent
Visual variables:
Definition
Mapping of variations in data are shown by variations in symbols
we create a variation in the visual domain
artistic representation and scientific method
Visual variables:
Name all
orientation
shape
size
colour value
colour hue
texture
colour scheme
Visual variables
What can be symbolized with visual variables?
name 1 example for each
feature characteristics (e.g. continuous)
feature spatial dimension (e.g. 1-4D)
level of measurement (e.g. nominal)
Visual variables
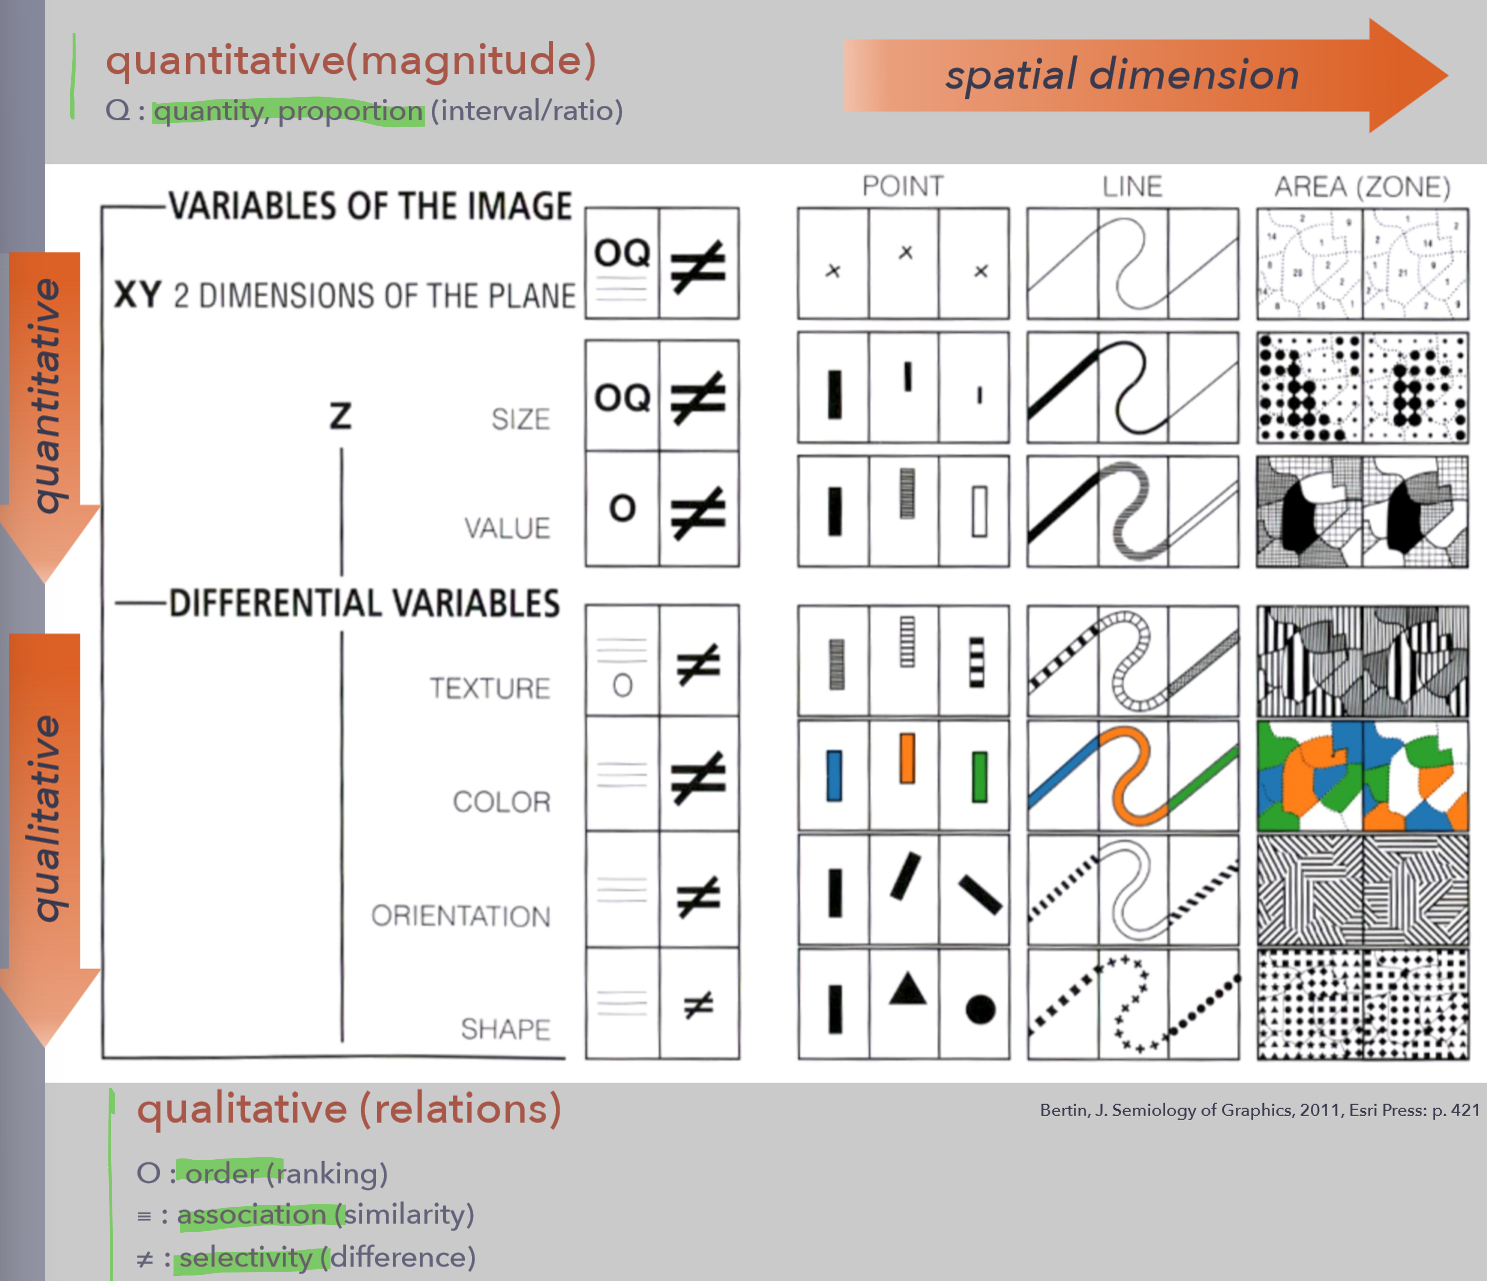
What levels of measurement can be shown with which visual variable and which spatial dimension?
Quantitative (interval+ratio) can be shown by
two dimensions/size/value
point/line/area
Qualitative (ordinal) can be shown by
texture/colour/orientation/shape
point/line/area
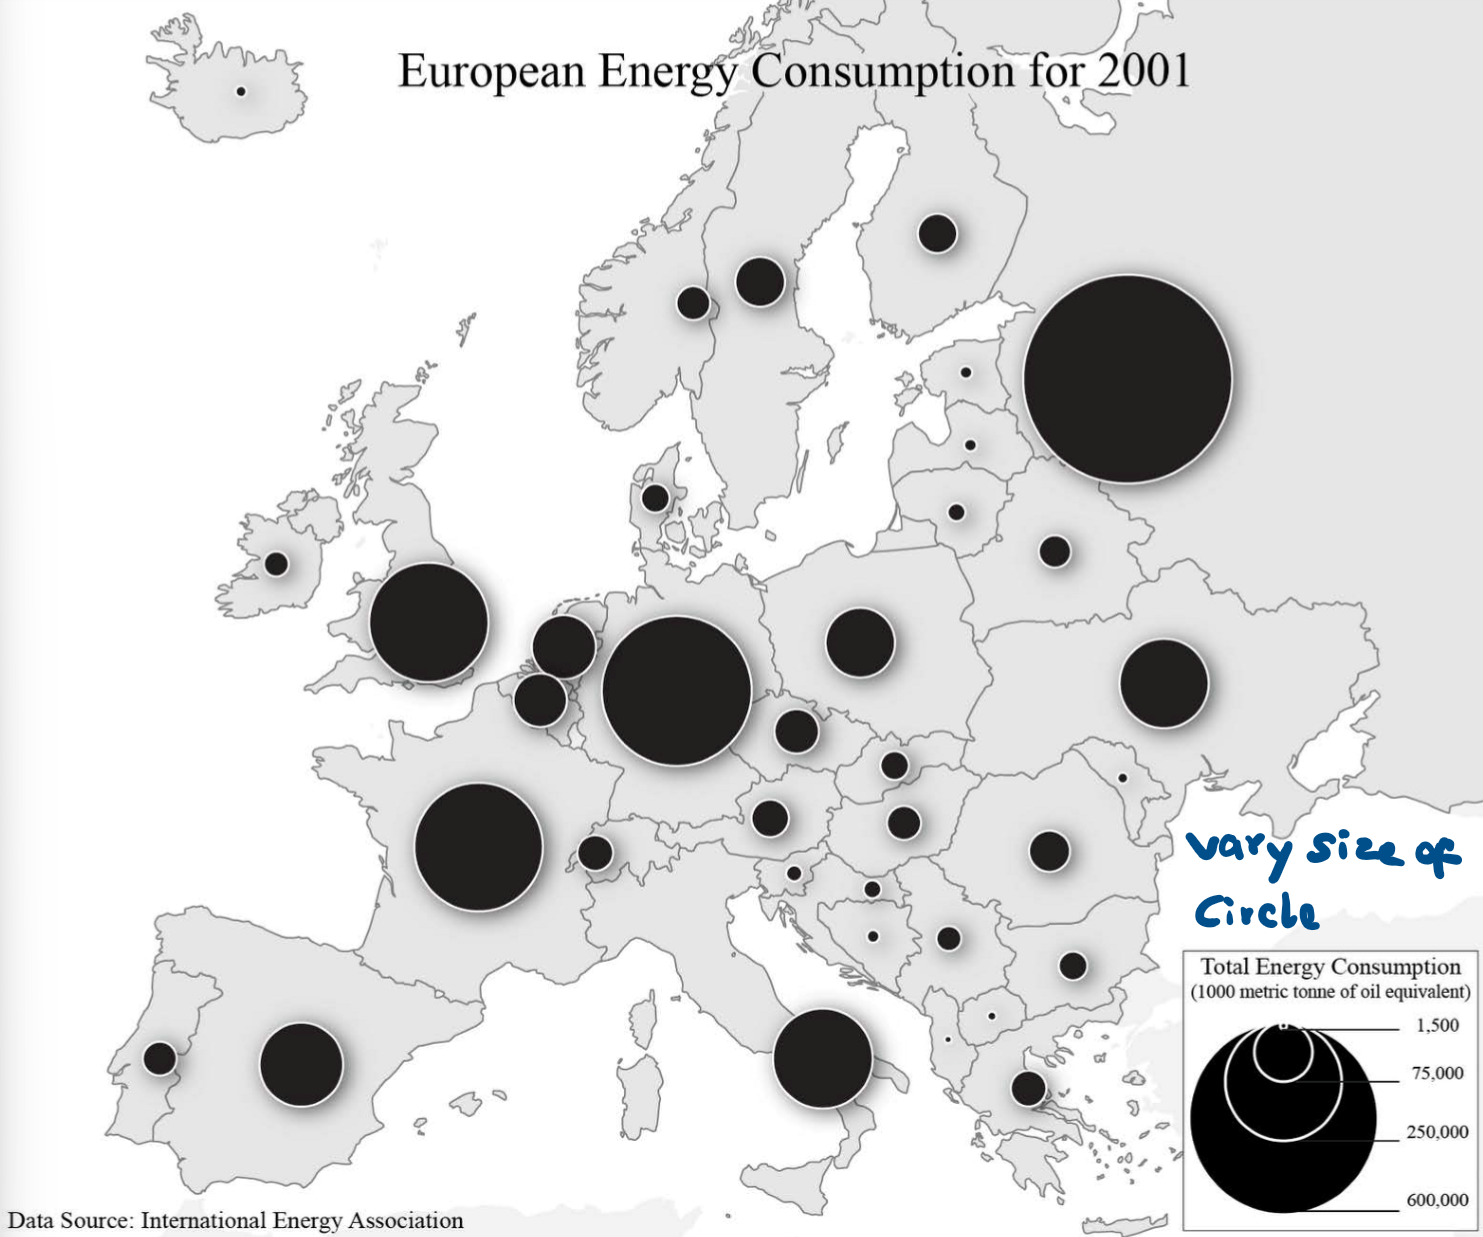
Visual variable?
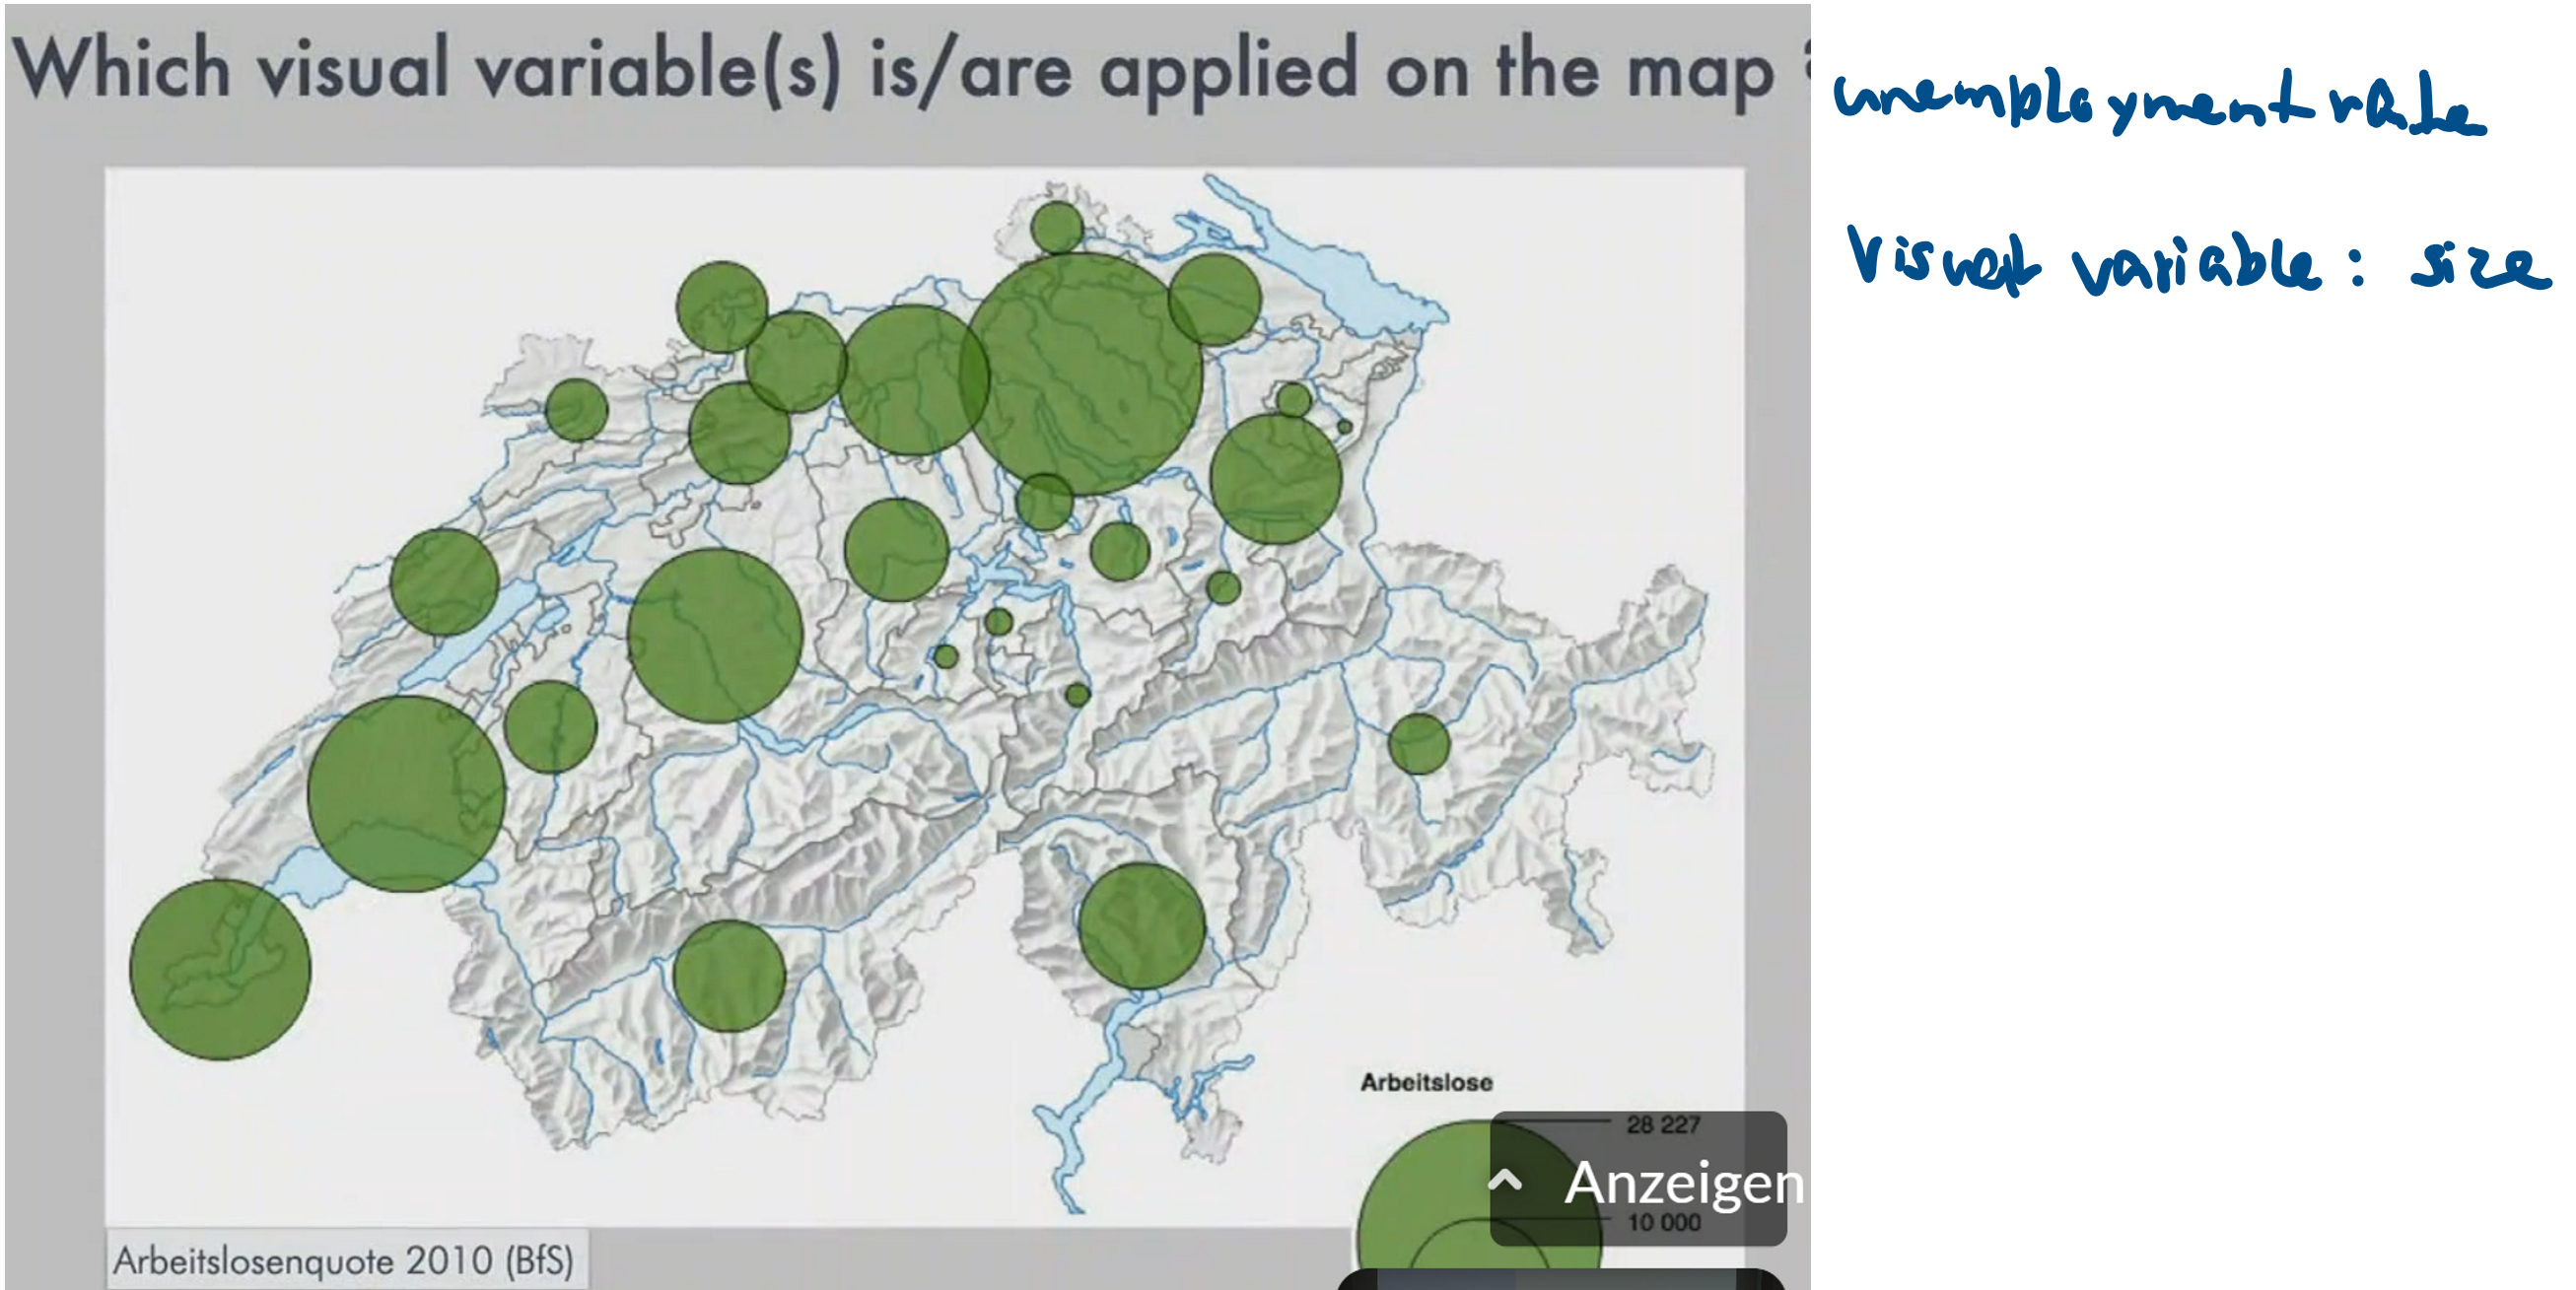
Which vv is represented?
size shows quantitative data
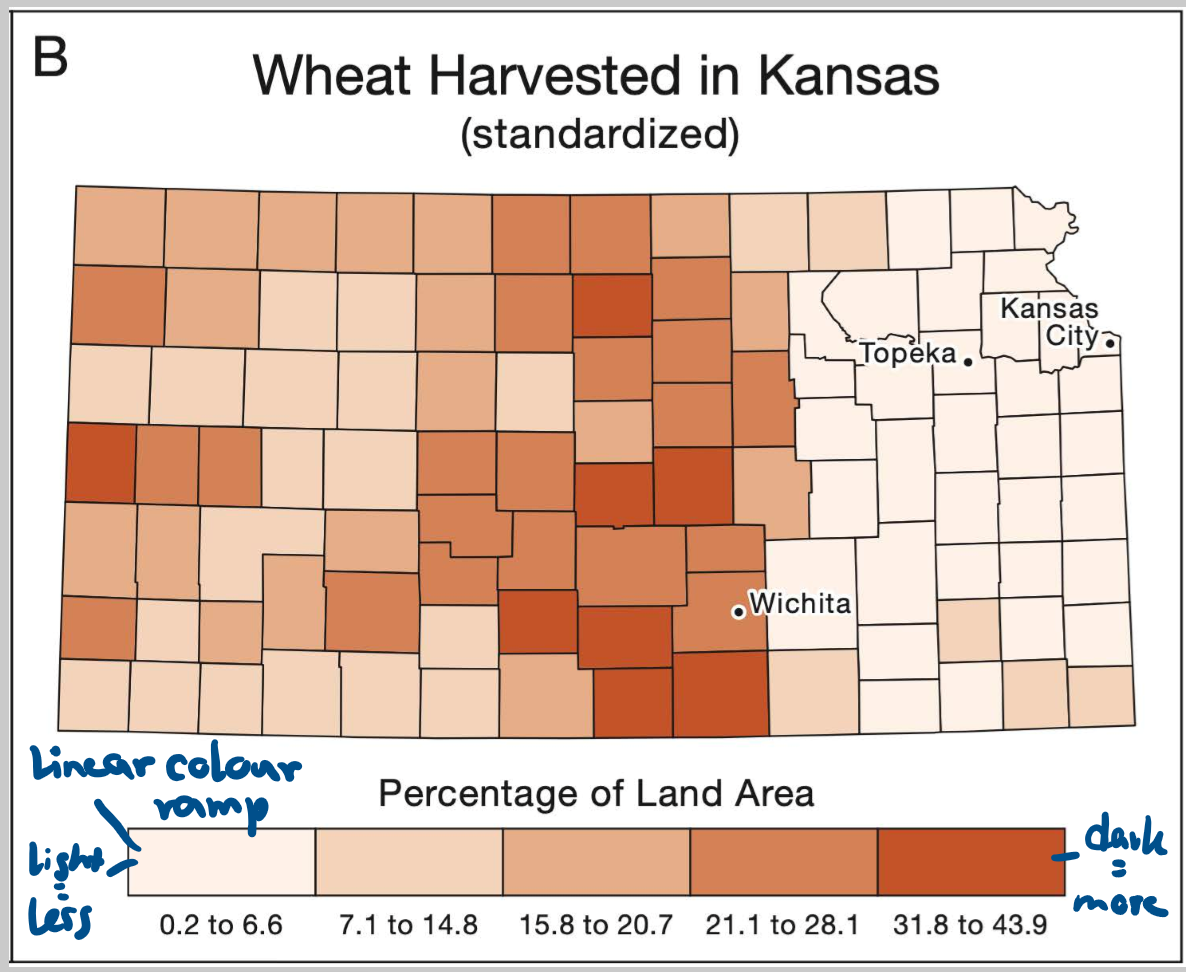
Visual variable?
2. Which vv is represented?
value (lightness of the same colour)
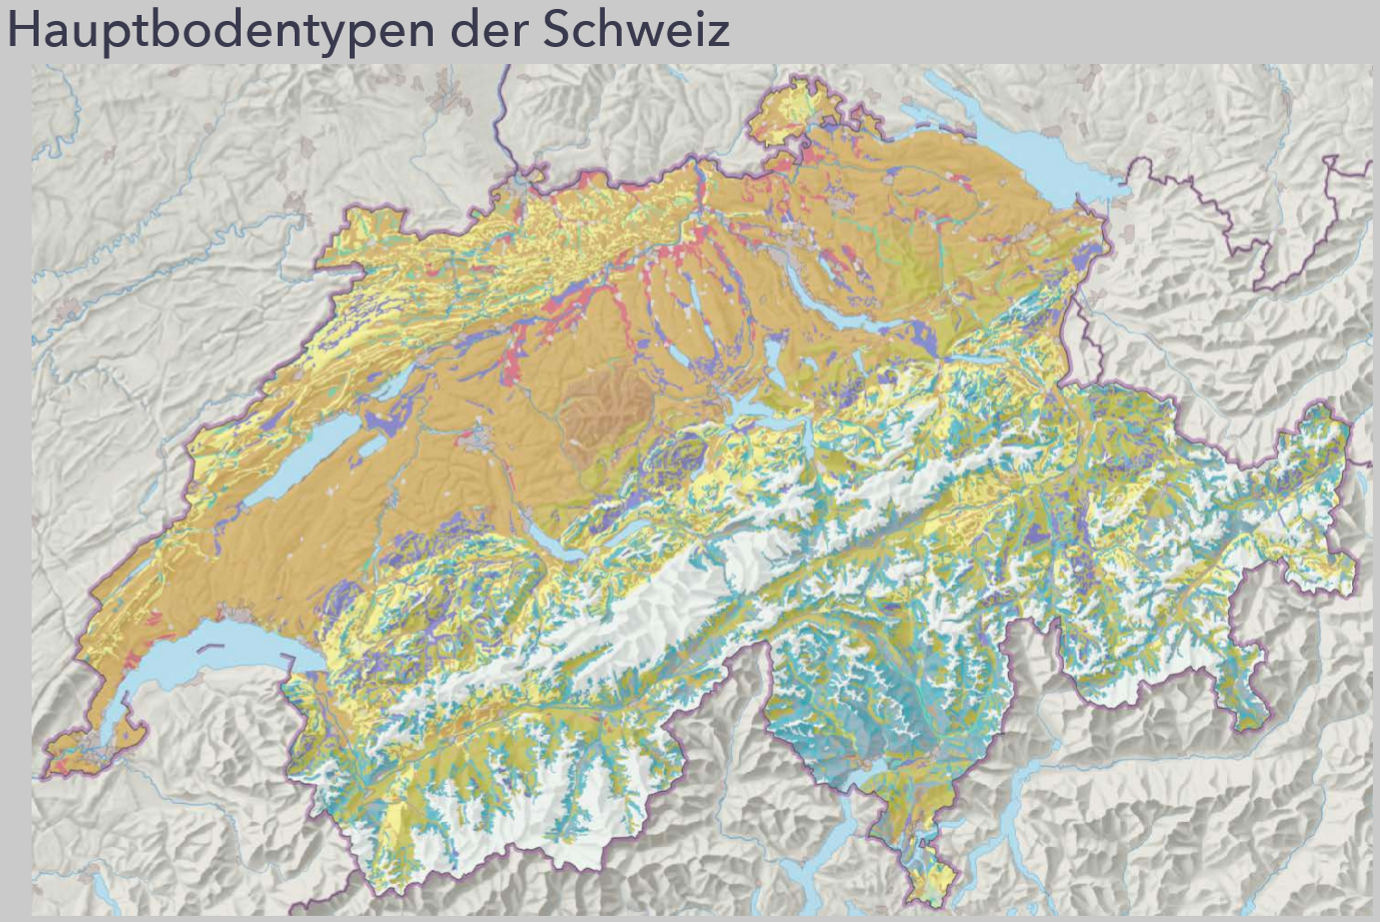
Visual variable?
Which vv is represented?
colour shows qualitative difference (soil types)
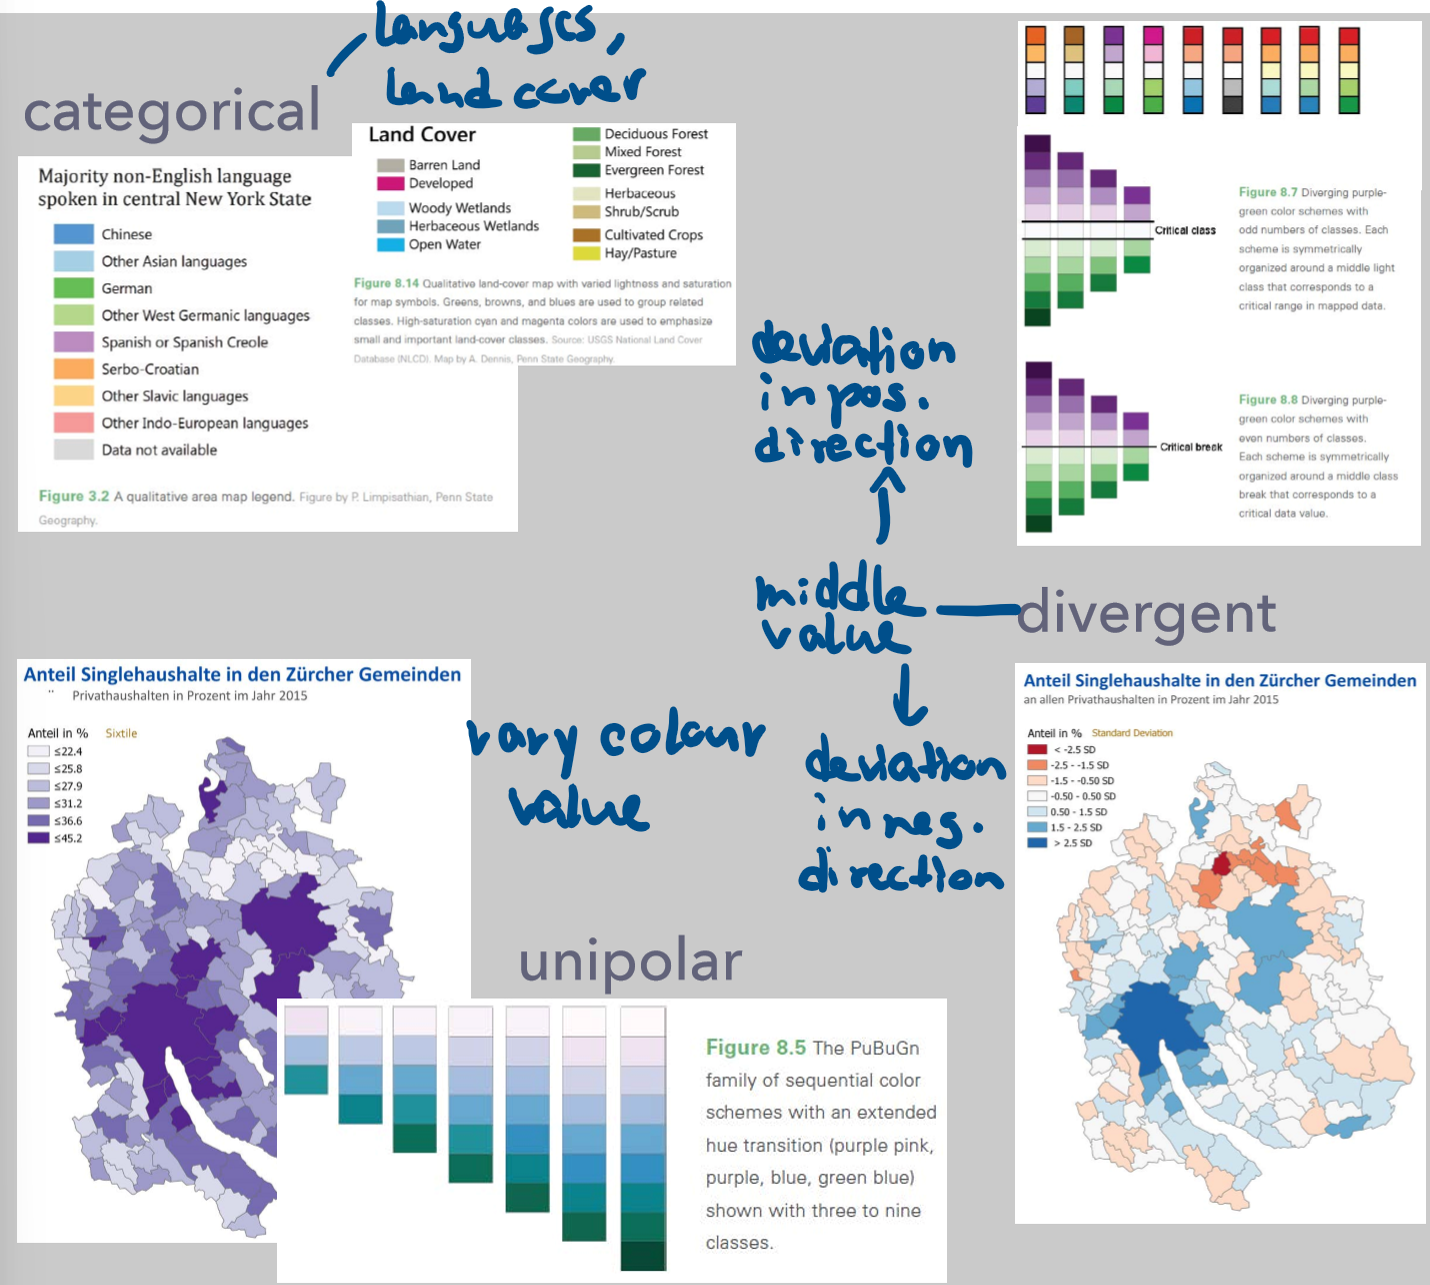
Visual variable?
Which vv is represented? What categories exist?
colour schemes
categorical
unipolar
divergent
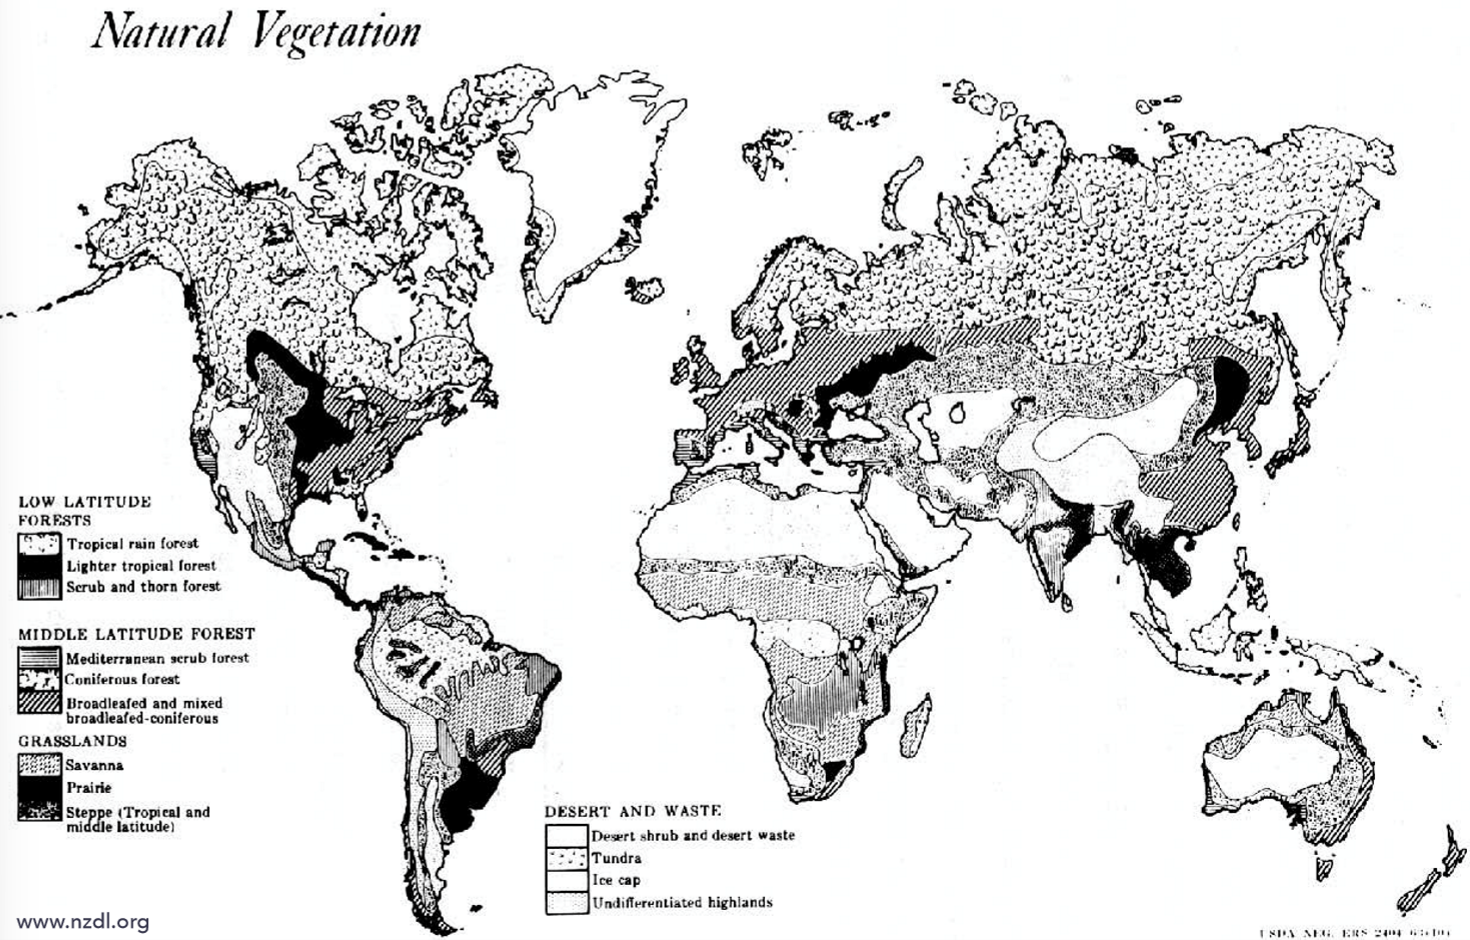
Visual variable?
Which vv is represented?
texture shows mostly qualitative data
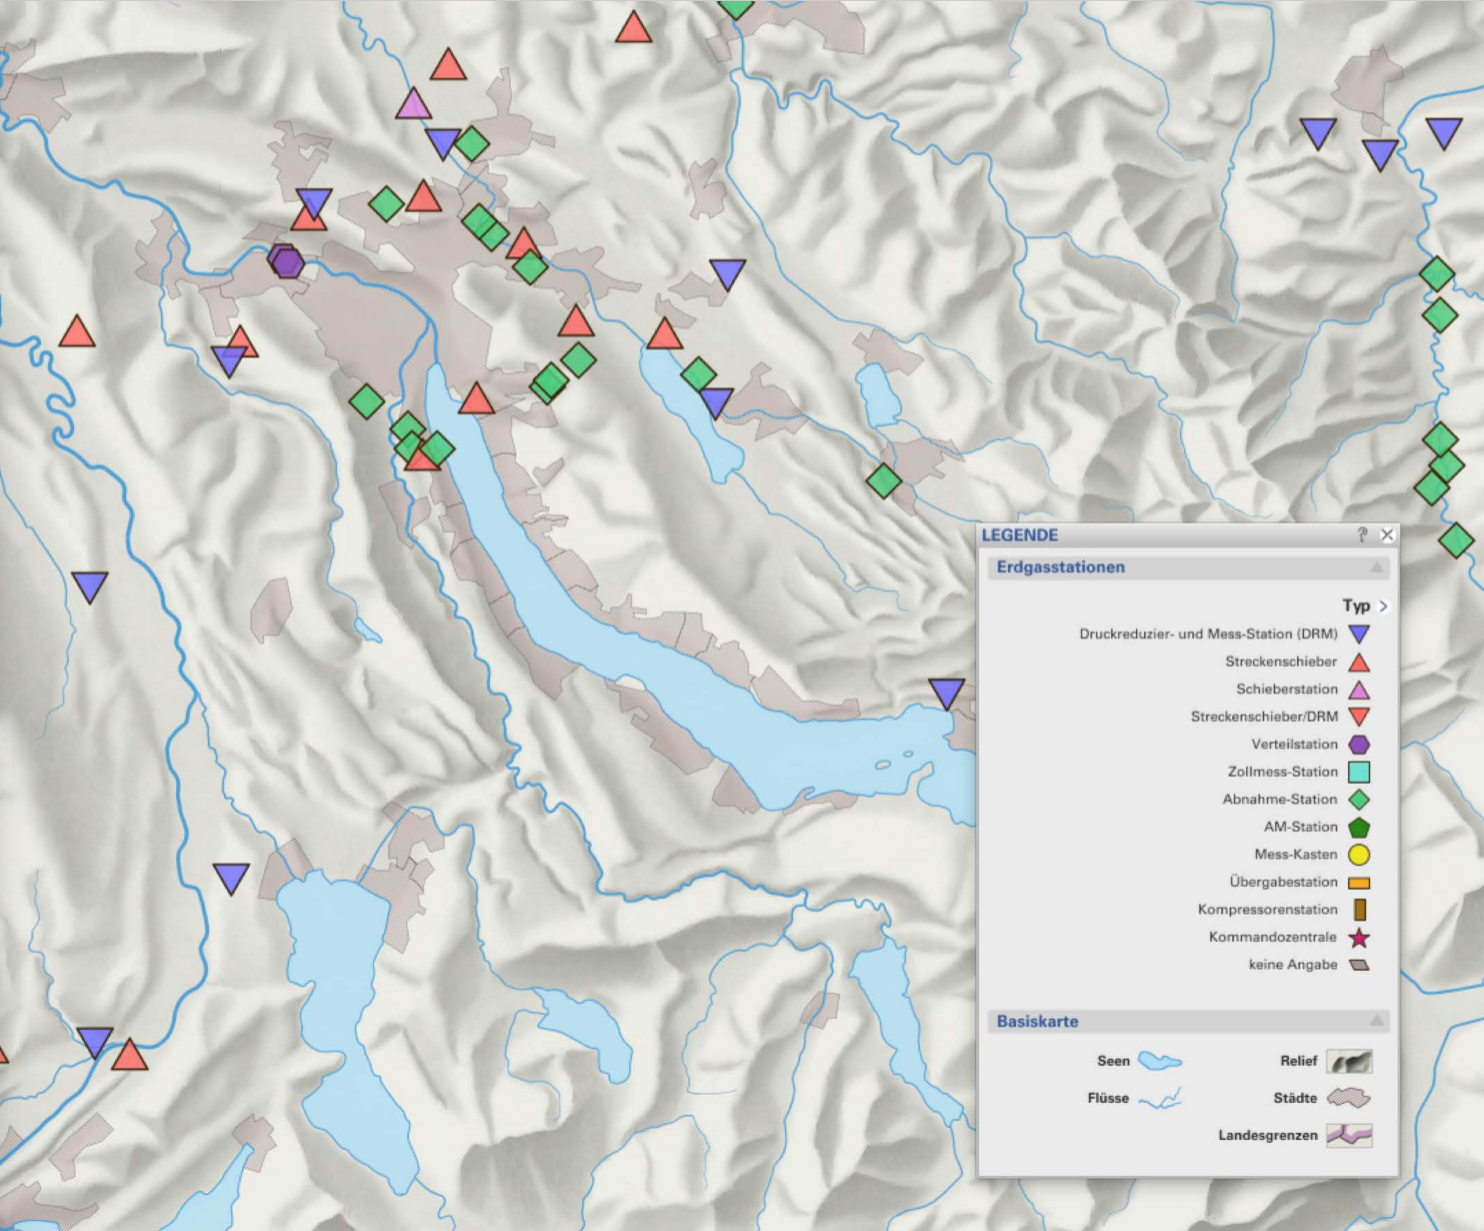
Visual variable?
Which vv is represented?
shape
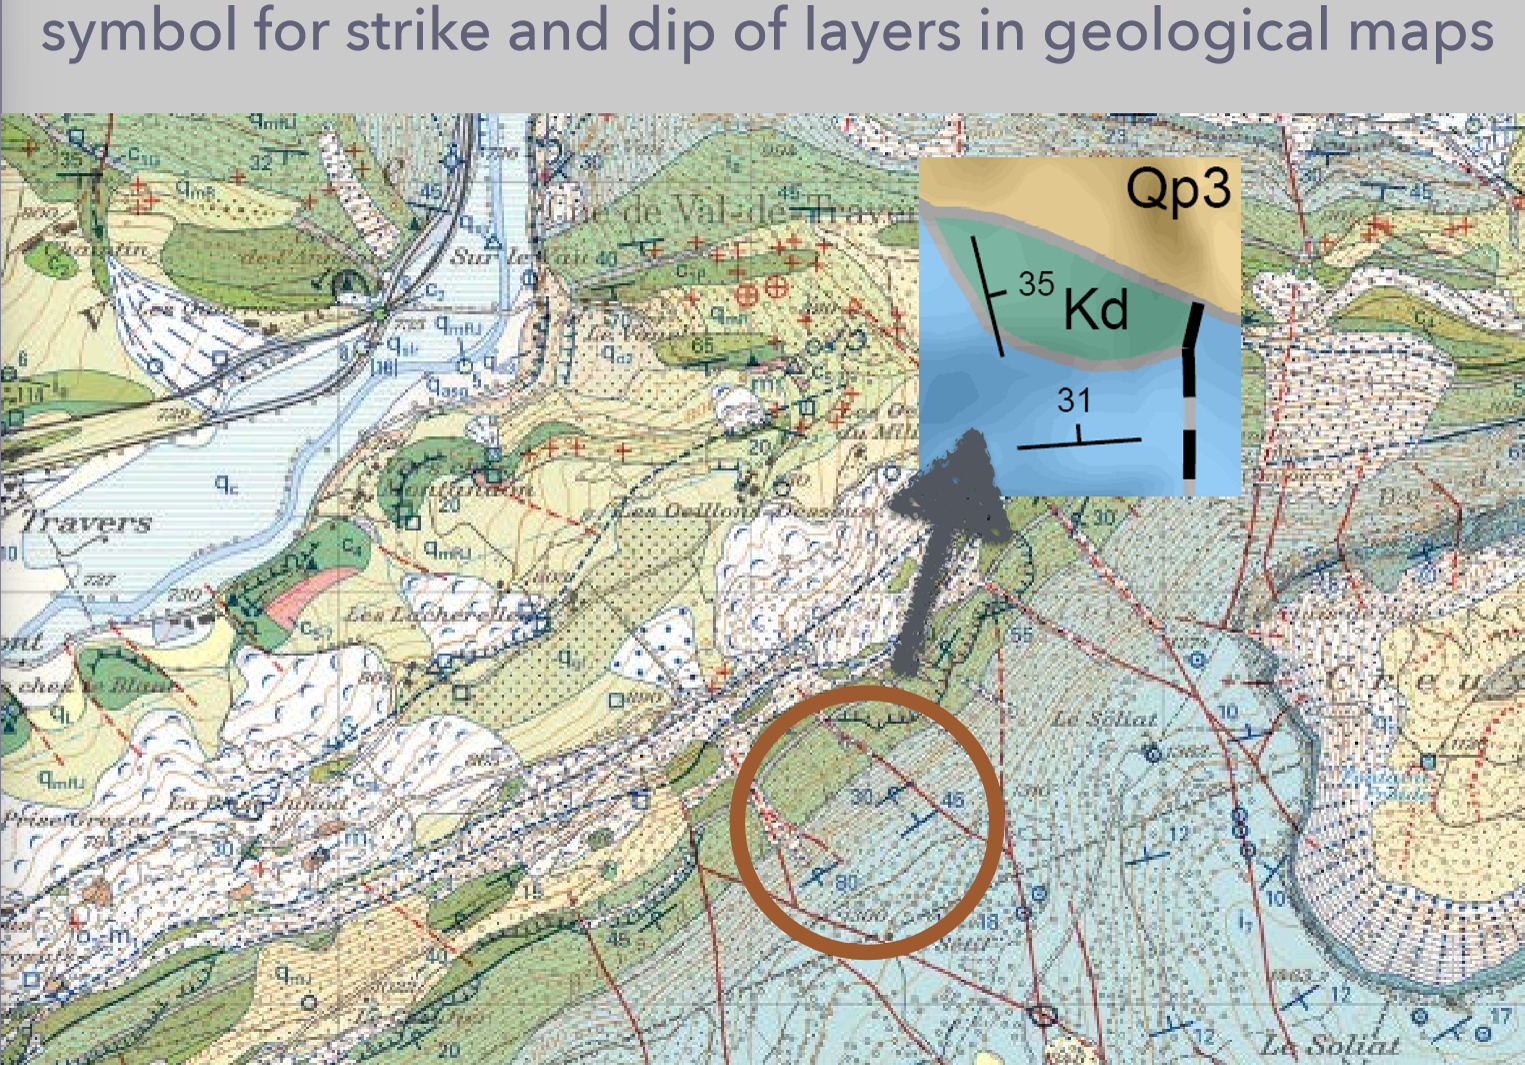
Visual variable?
Which vv is represented?
orientation (here quantitative: direction of geological layers)
Visual variable:
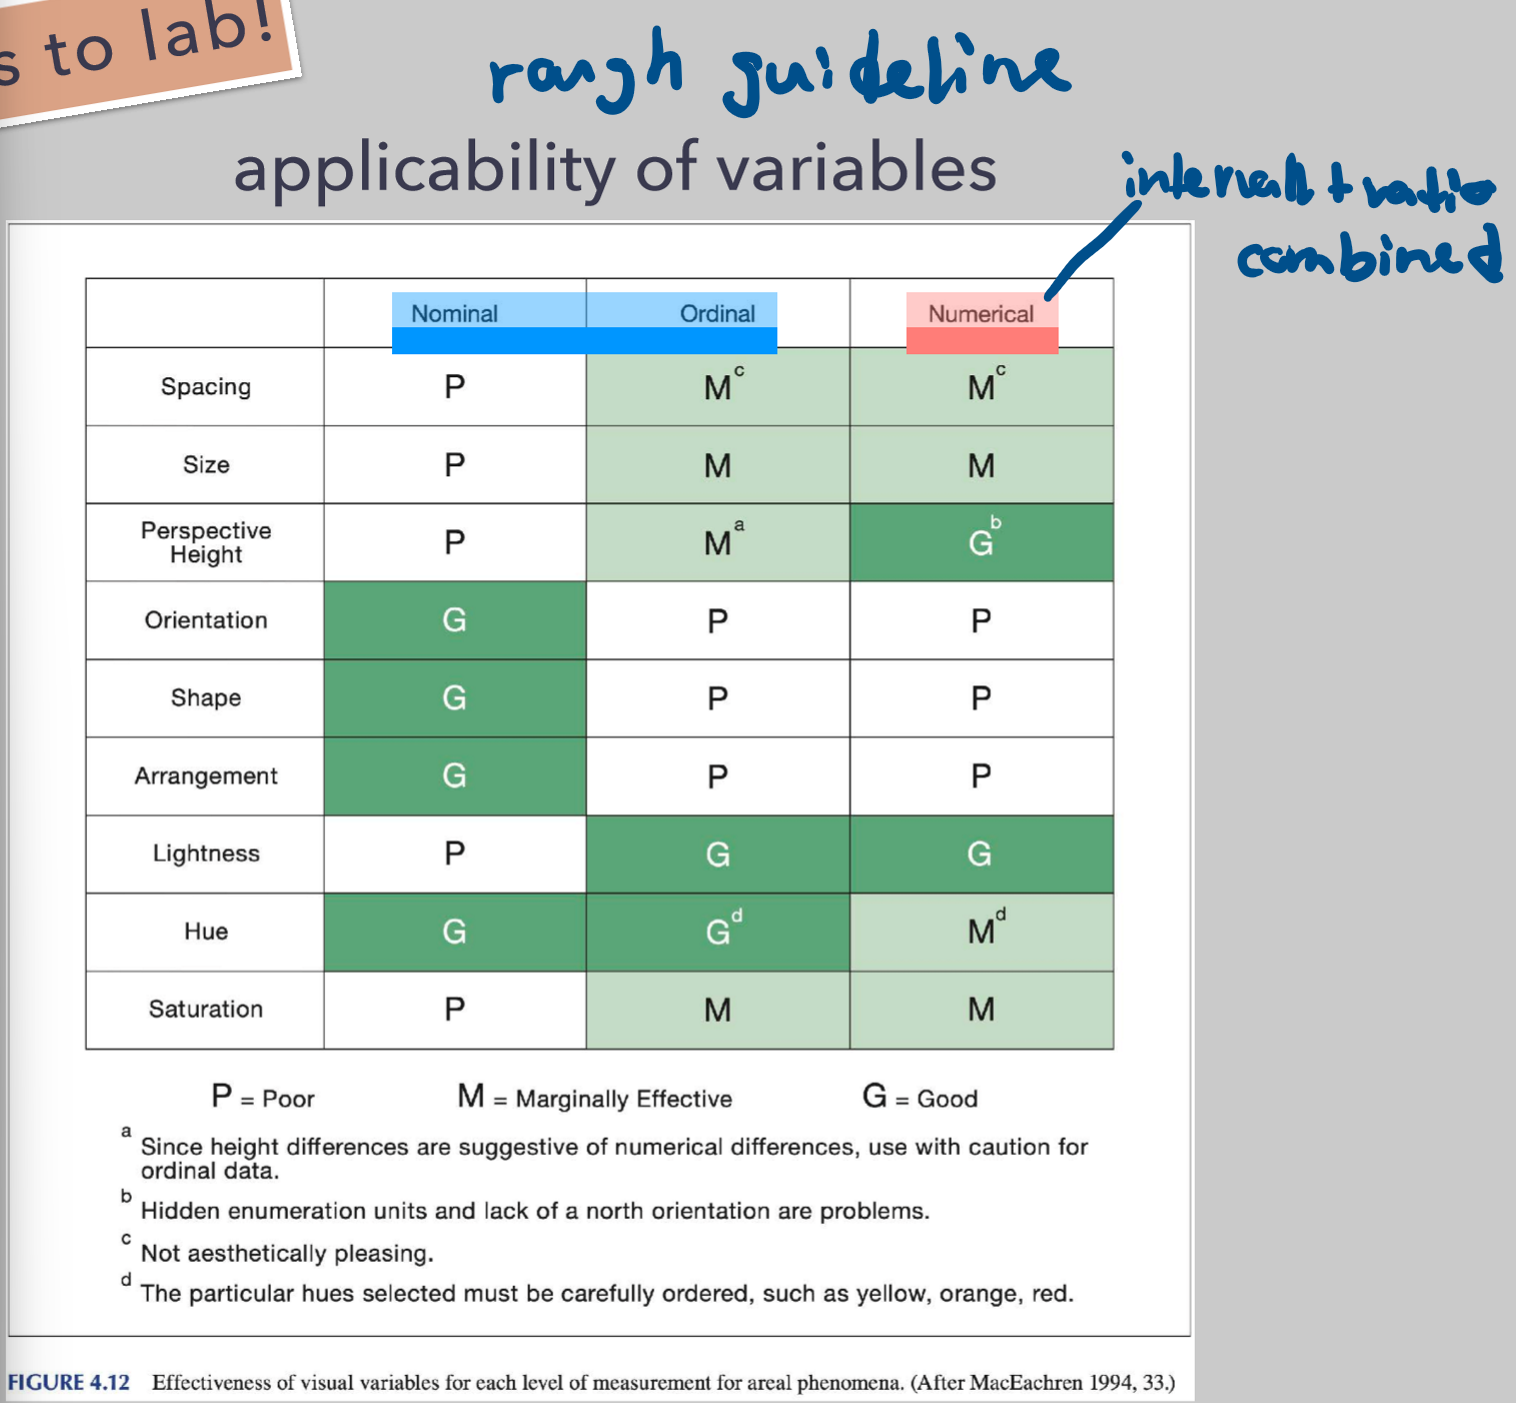
Applicability guideline
name examples for qualitative/categorical and quantitative/numerical
Qualitative / Categorical
republican/democrat
orders, ranks
Quantitative/numerical
magnitudes
people / km2
m3 of toxic waste
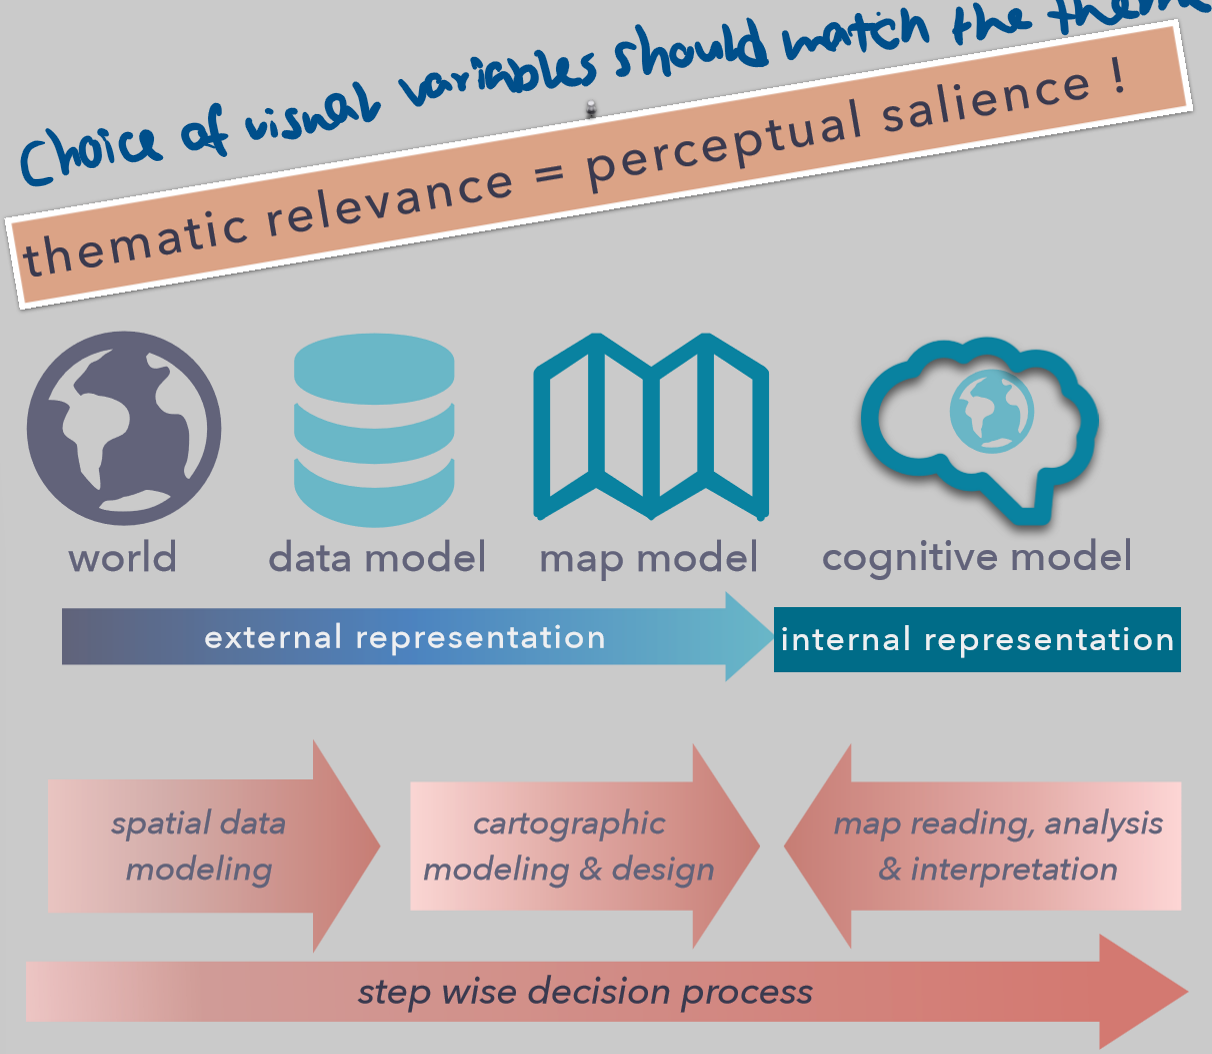
What is the overall cartographic principle?
Thematic relevance should correspond to perpetual salience
Choice of visual variables should match the theme
Map should be understood intuitively (e.g. no distractig colours)
Lecture summary: What are the 3 steps?
What data do we have?
What could be a fitting visual variable for this data?
How do we map the data?
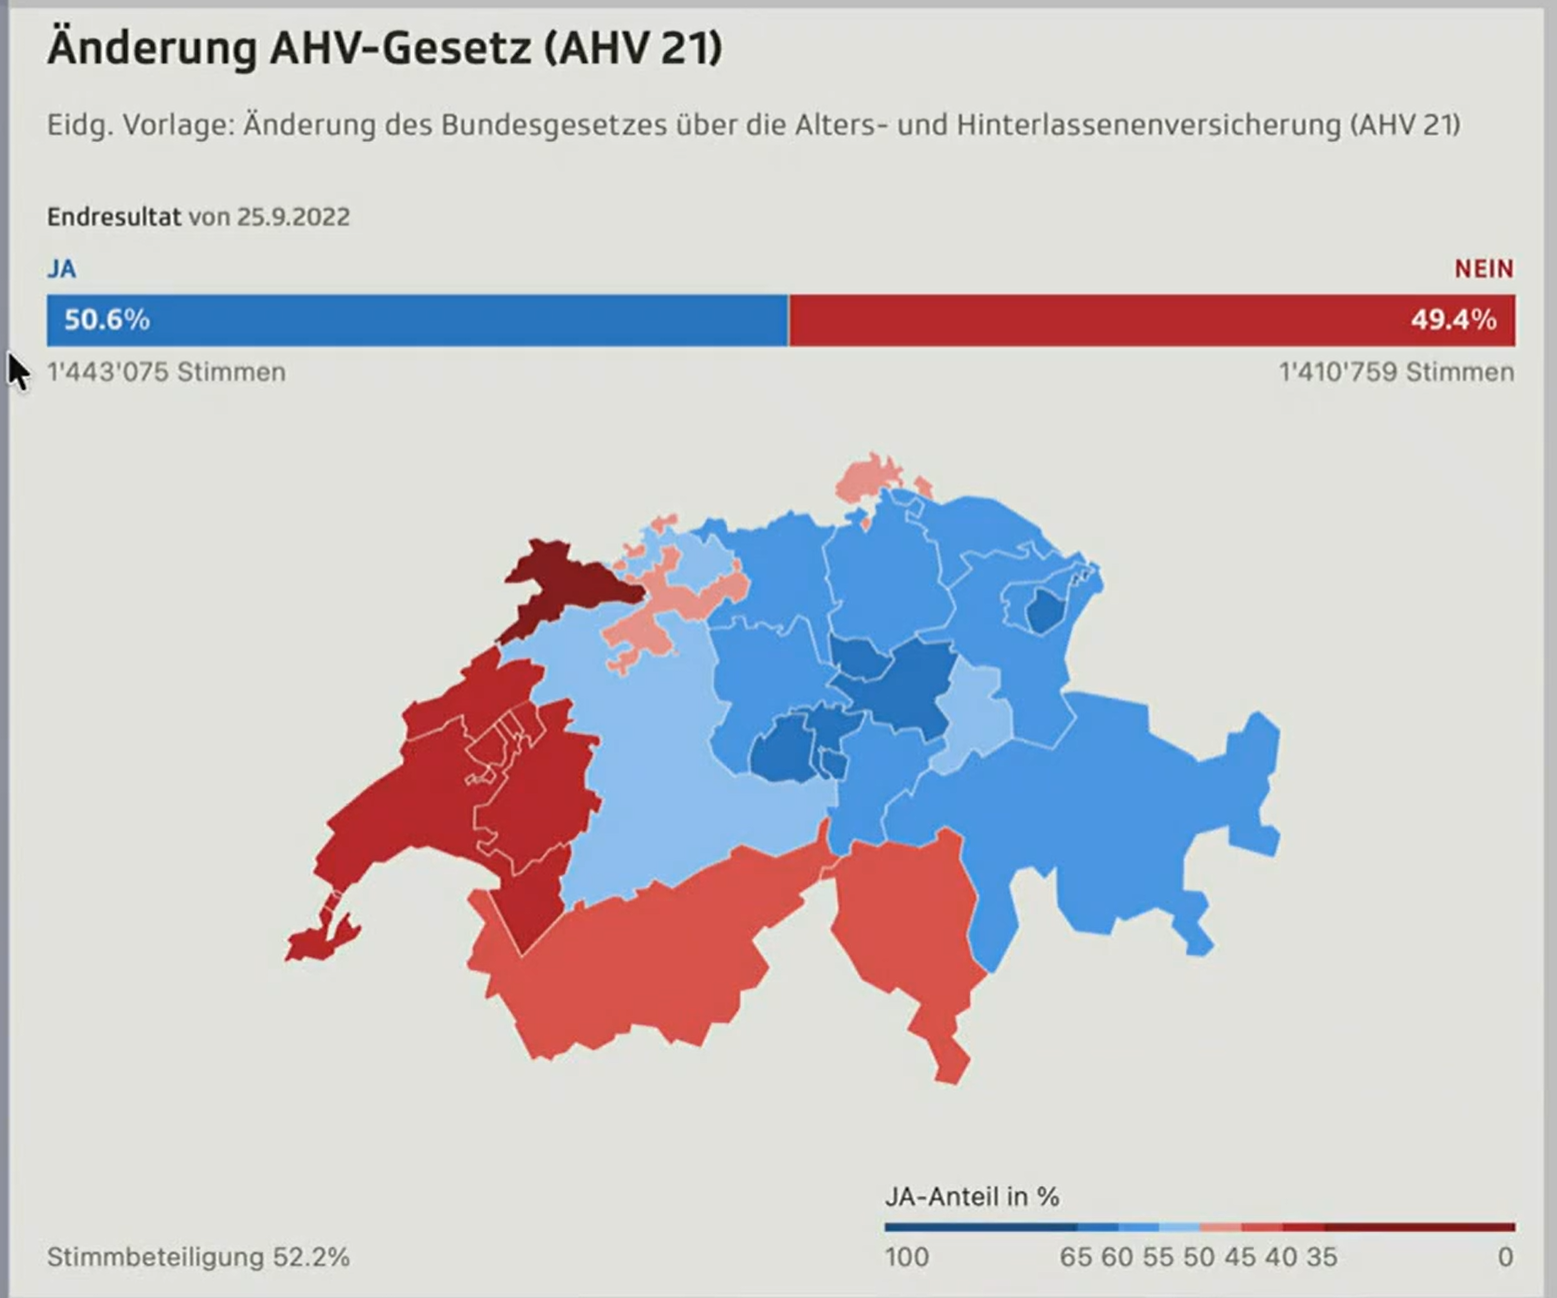
Klicker:
Geographical feature?
Type?
Spatial dimension?
Lvl of measurement?
Map type?
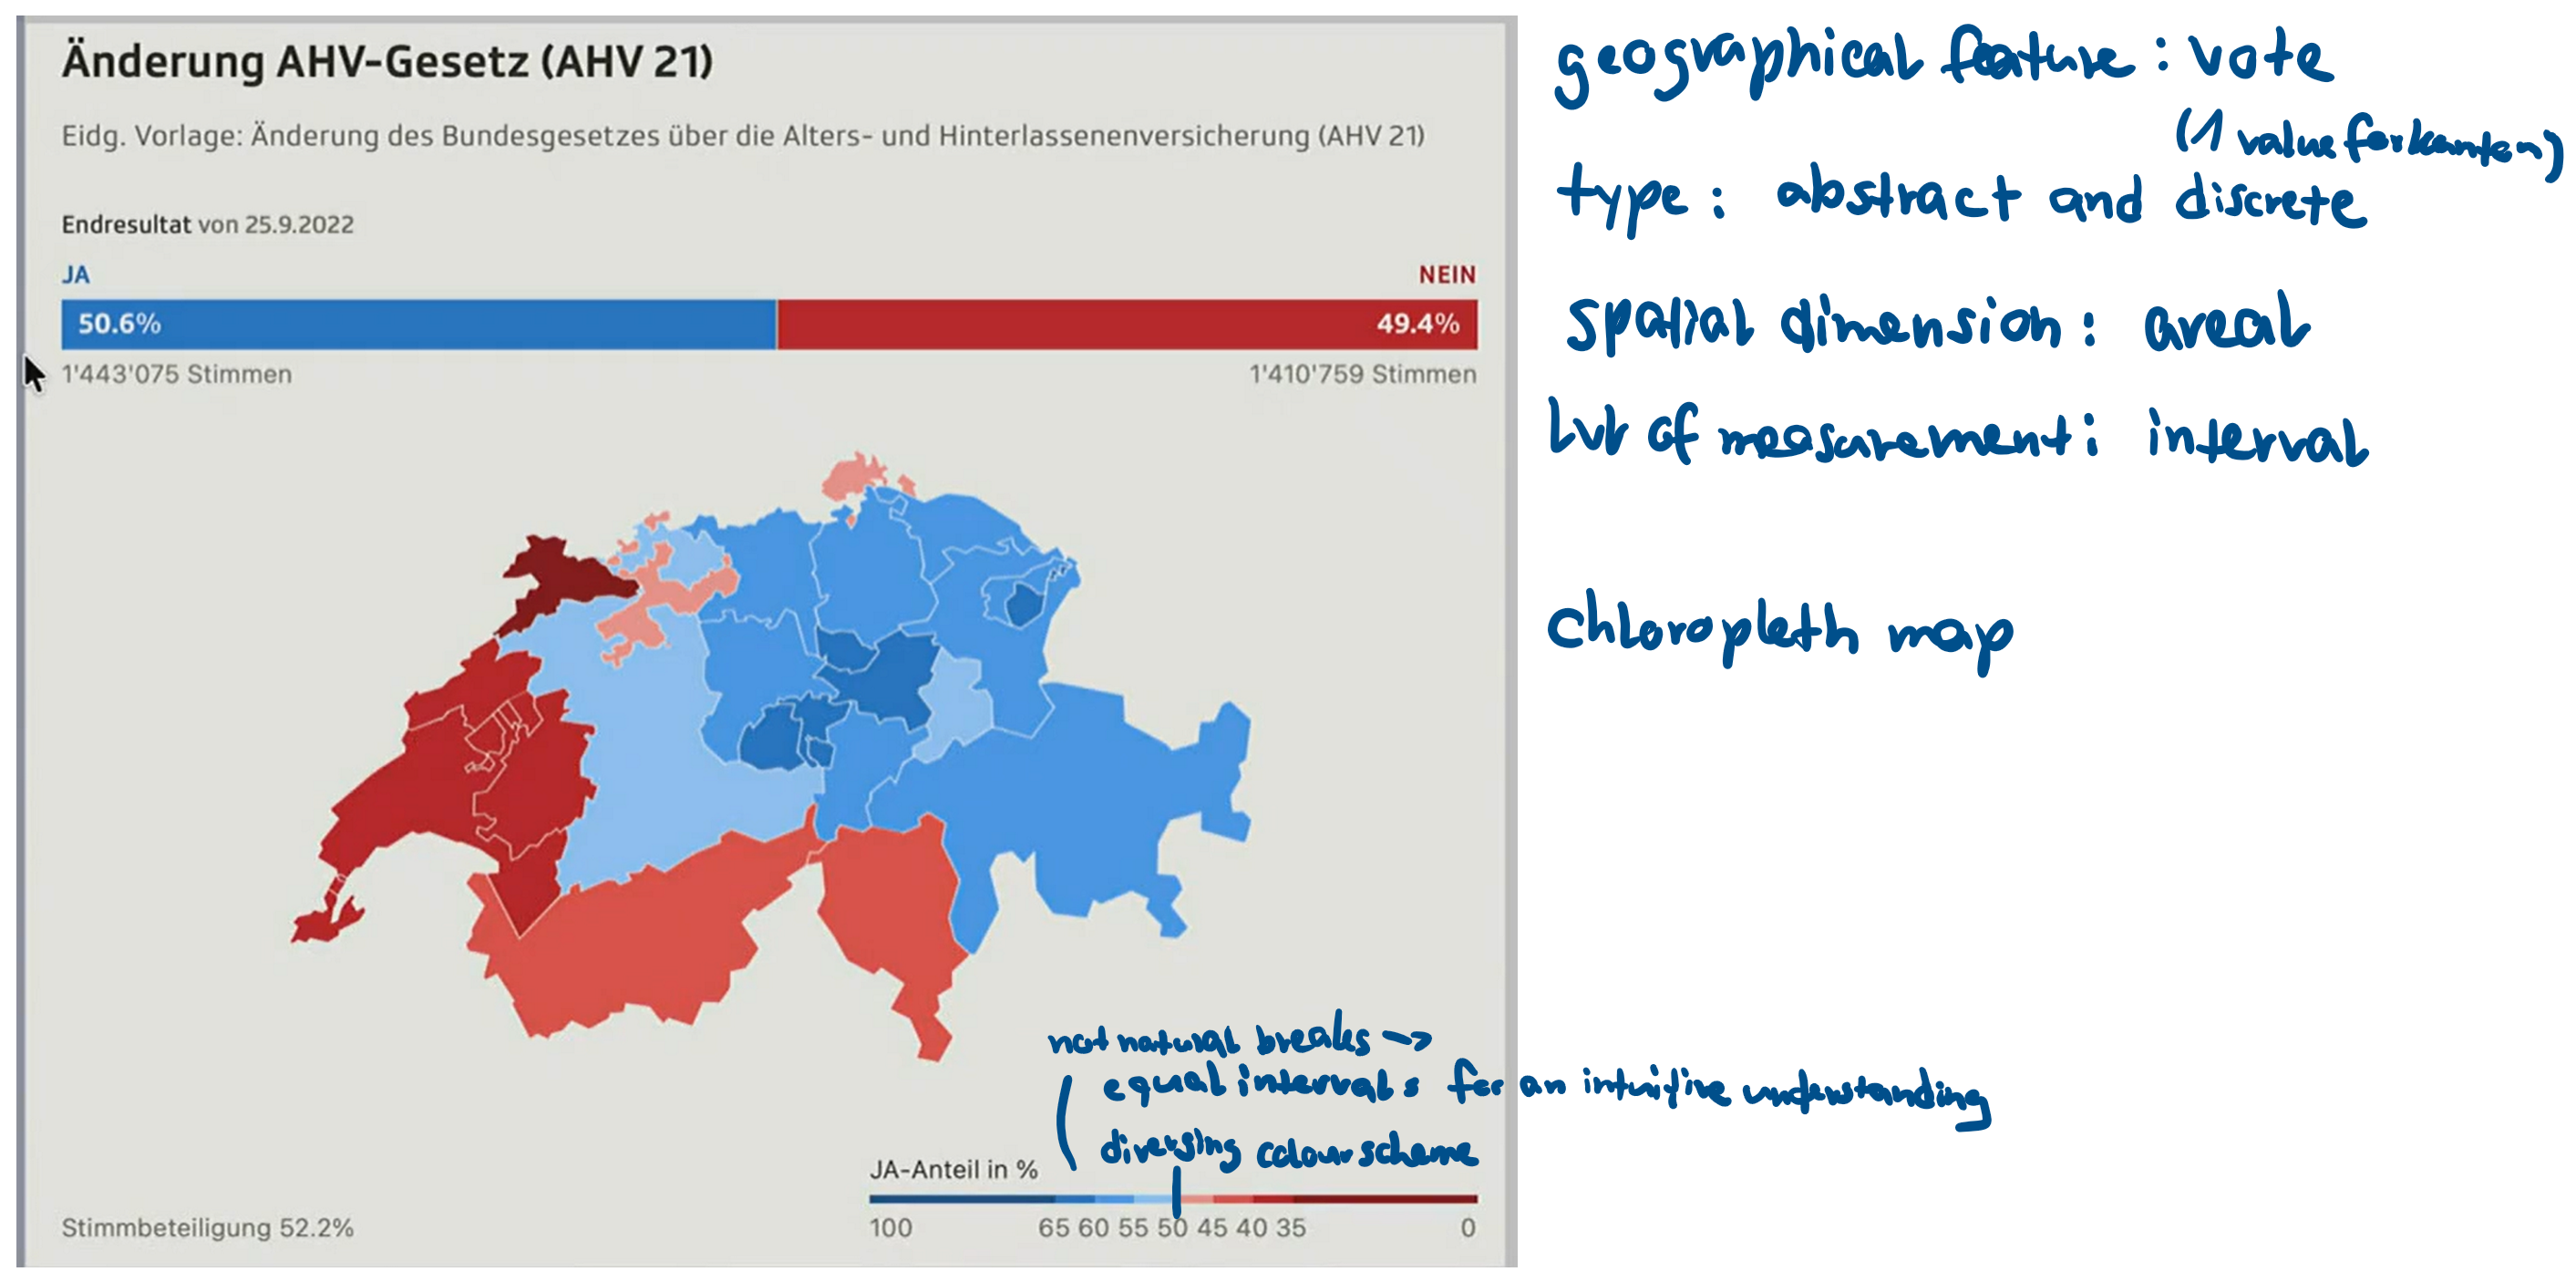
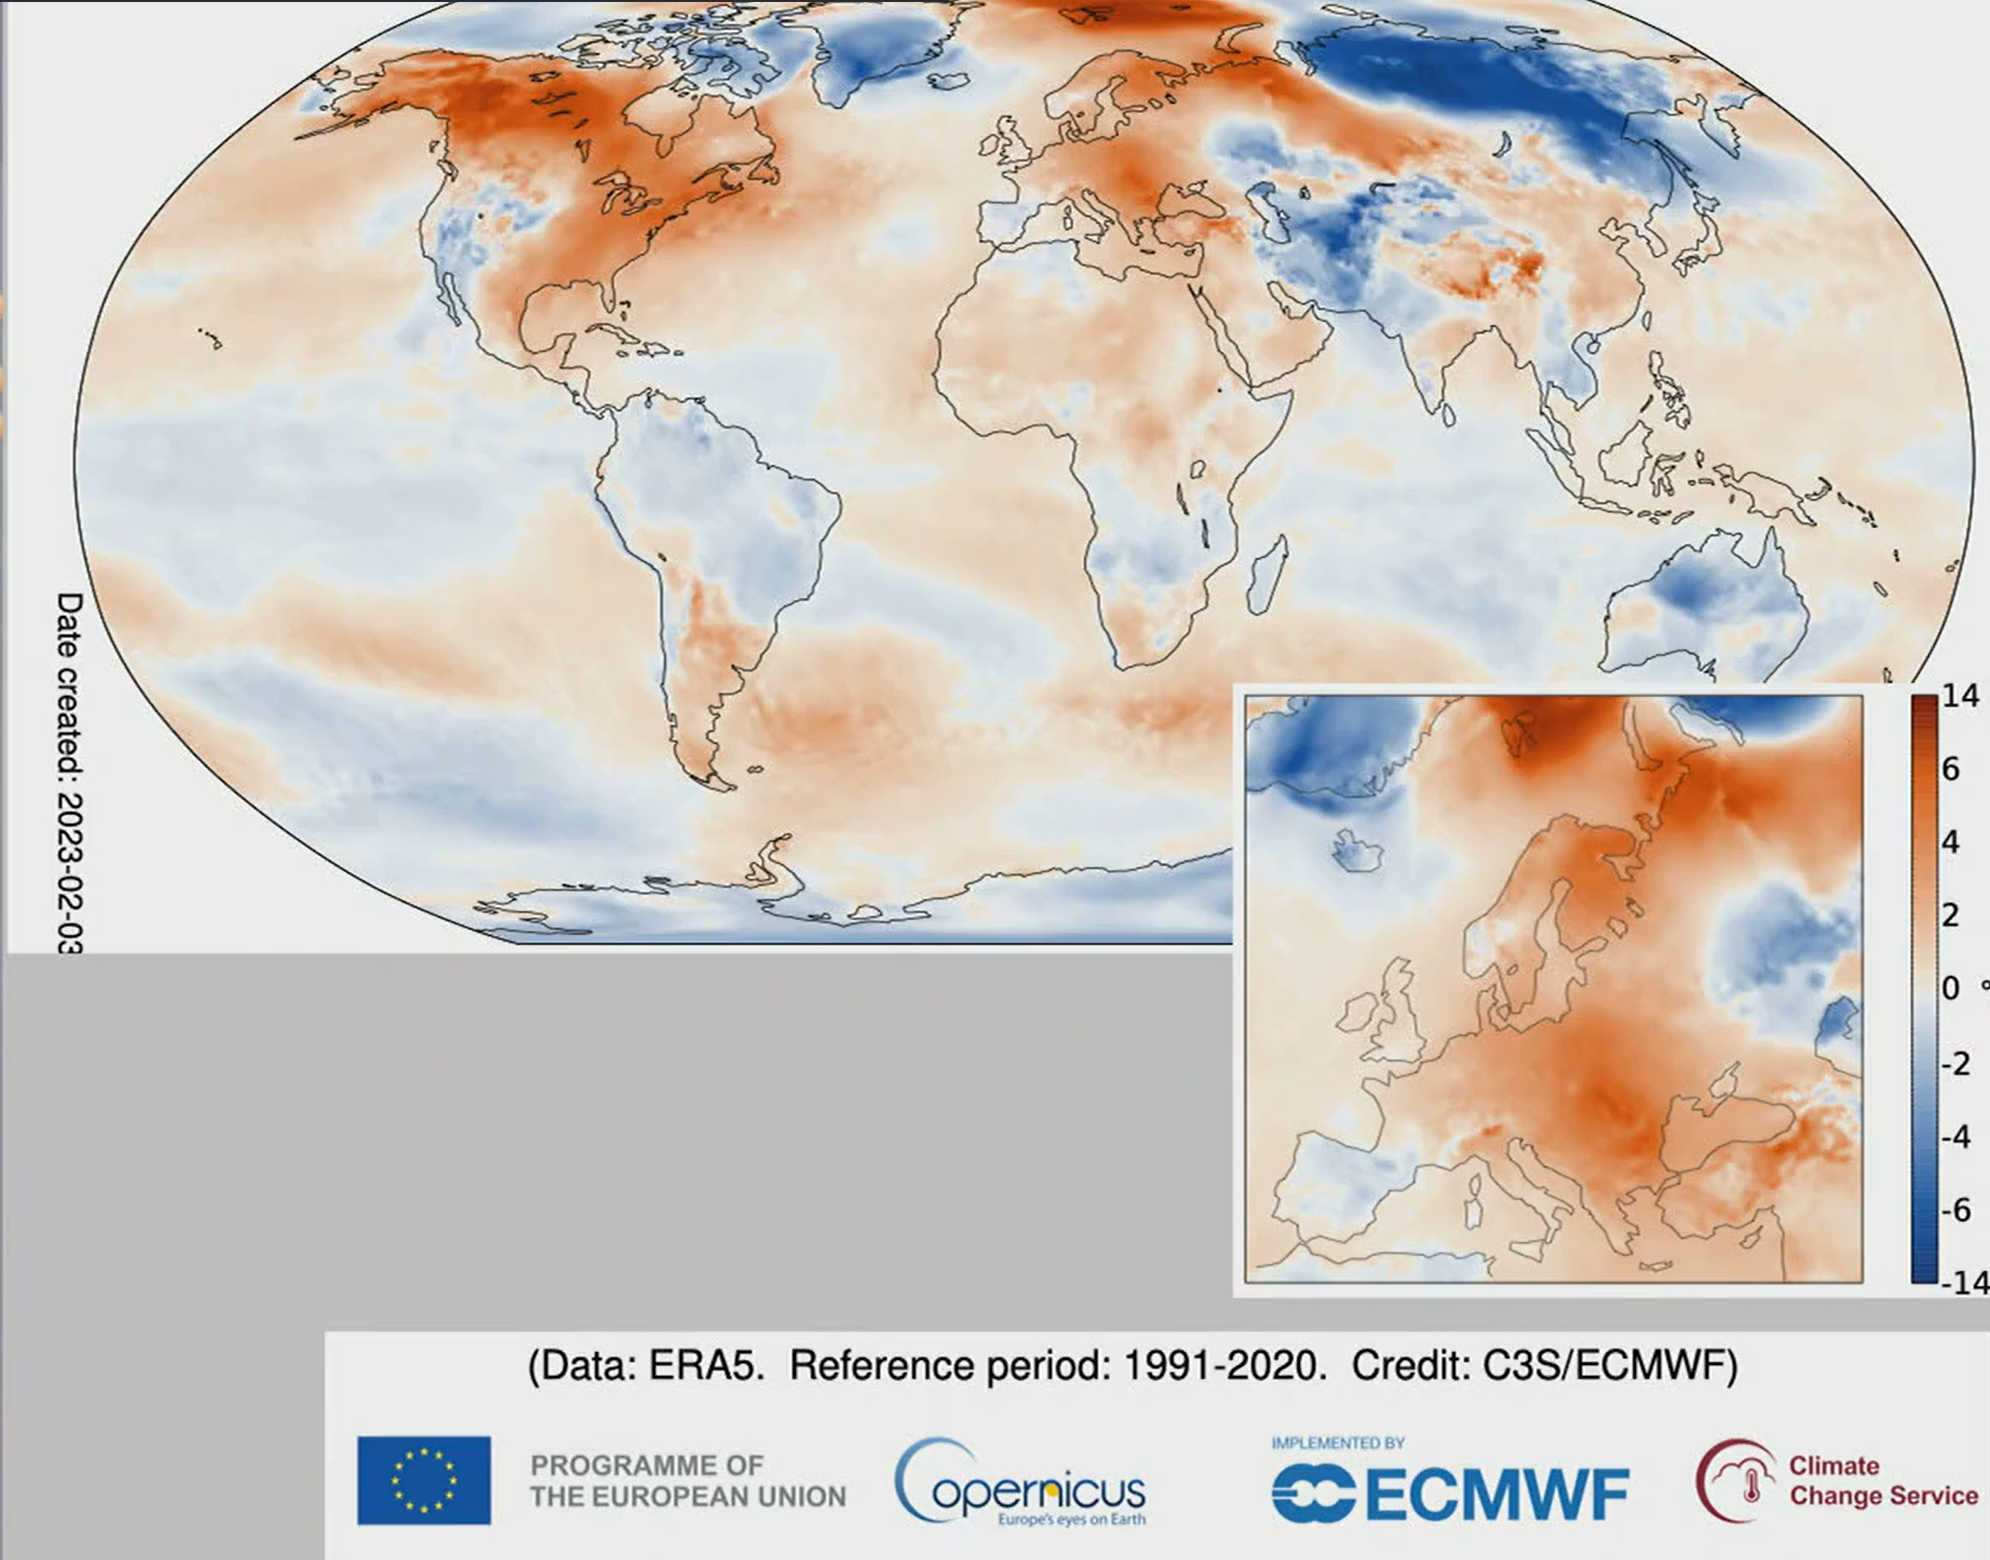
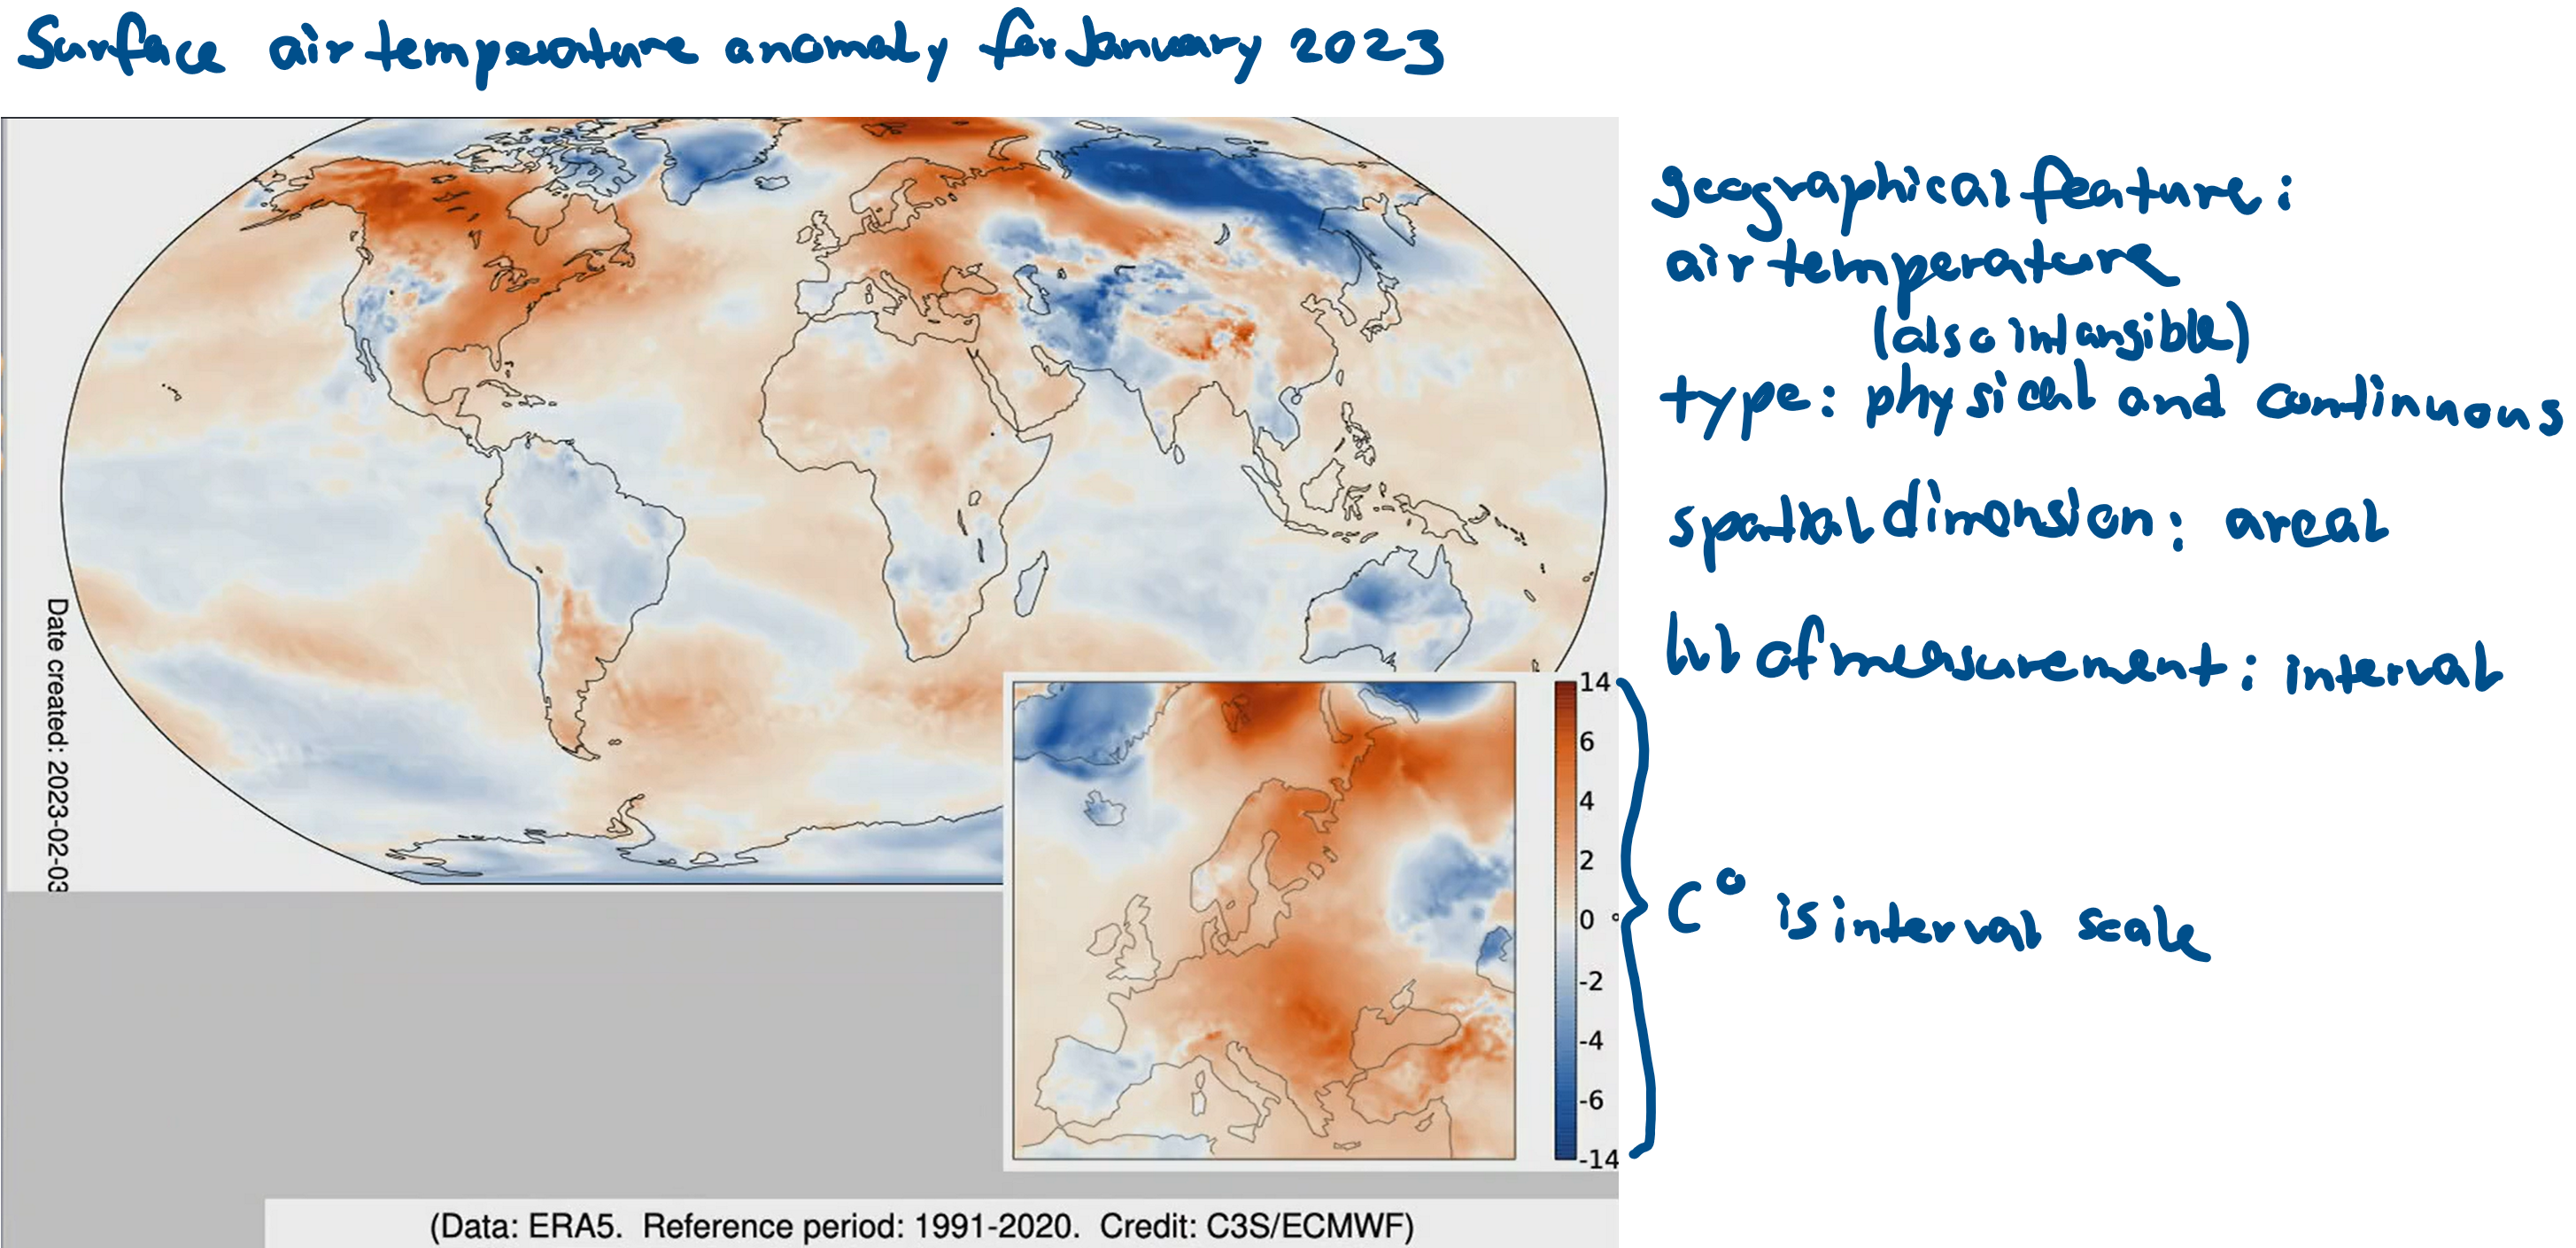
Klicker:
Geographical feature?
Type?
Spatial dimension?
Lvl of measurement?
Map type?
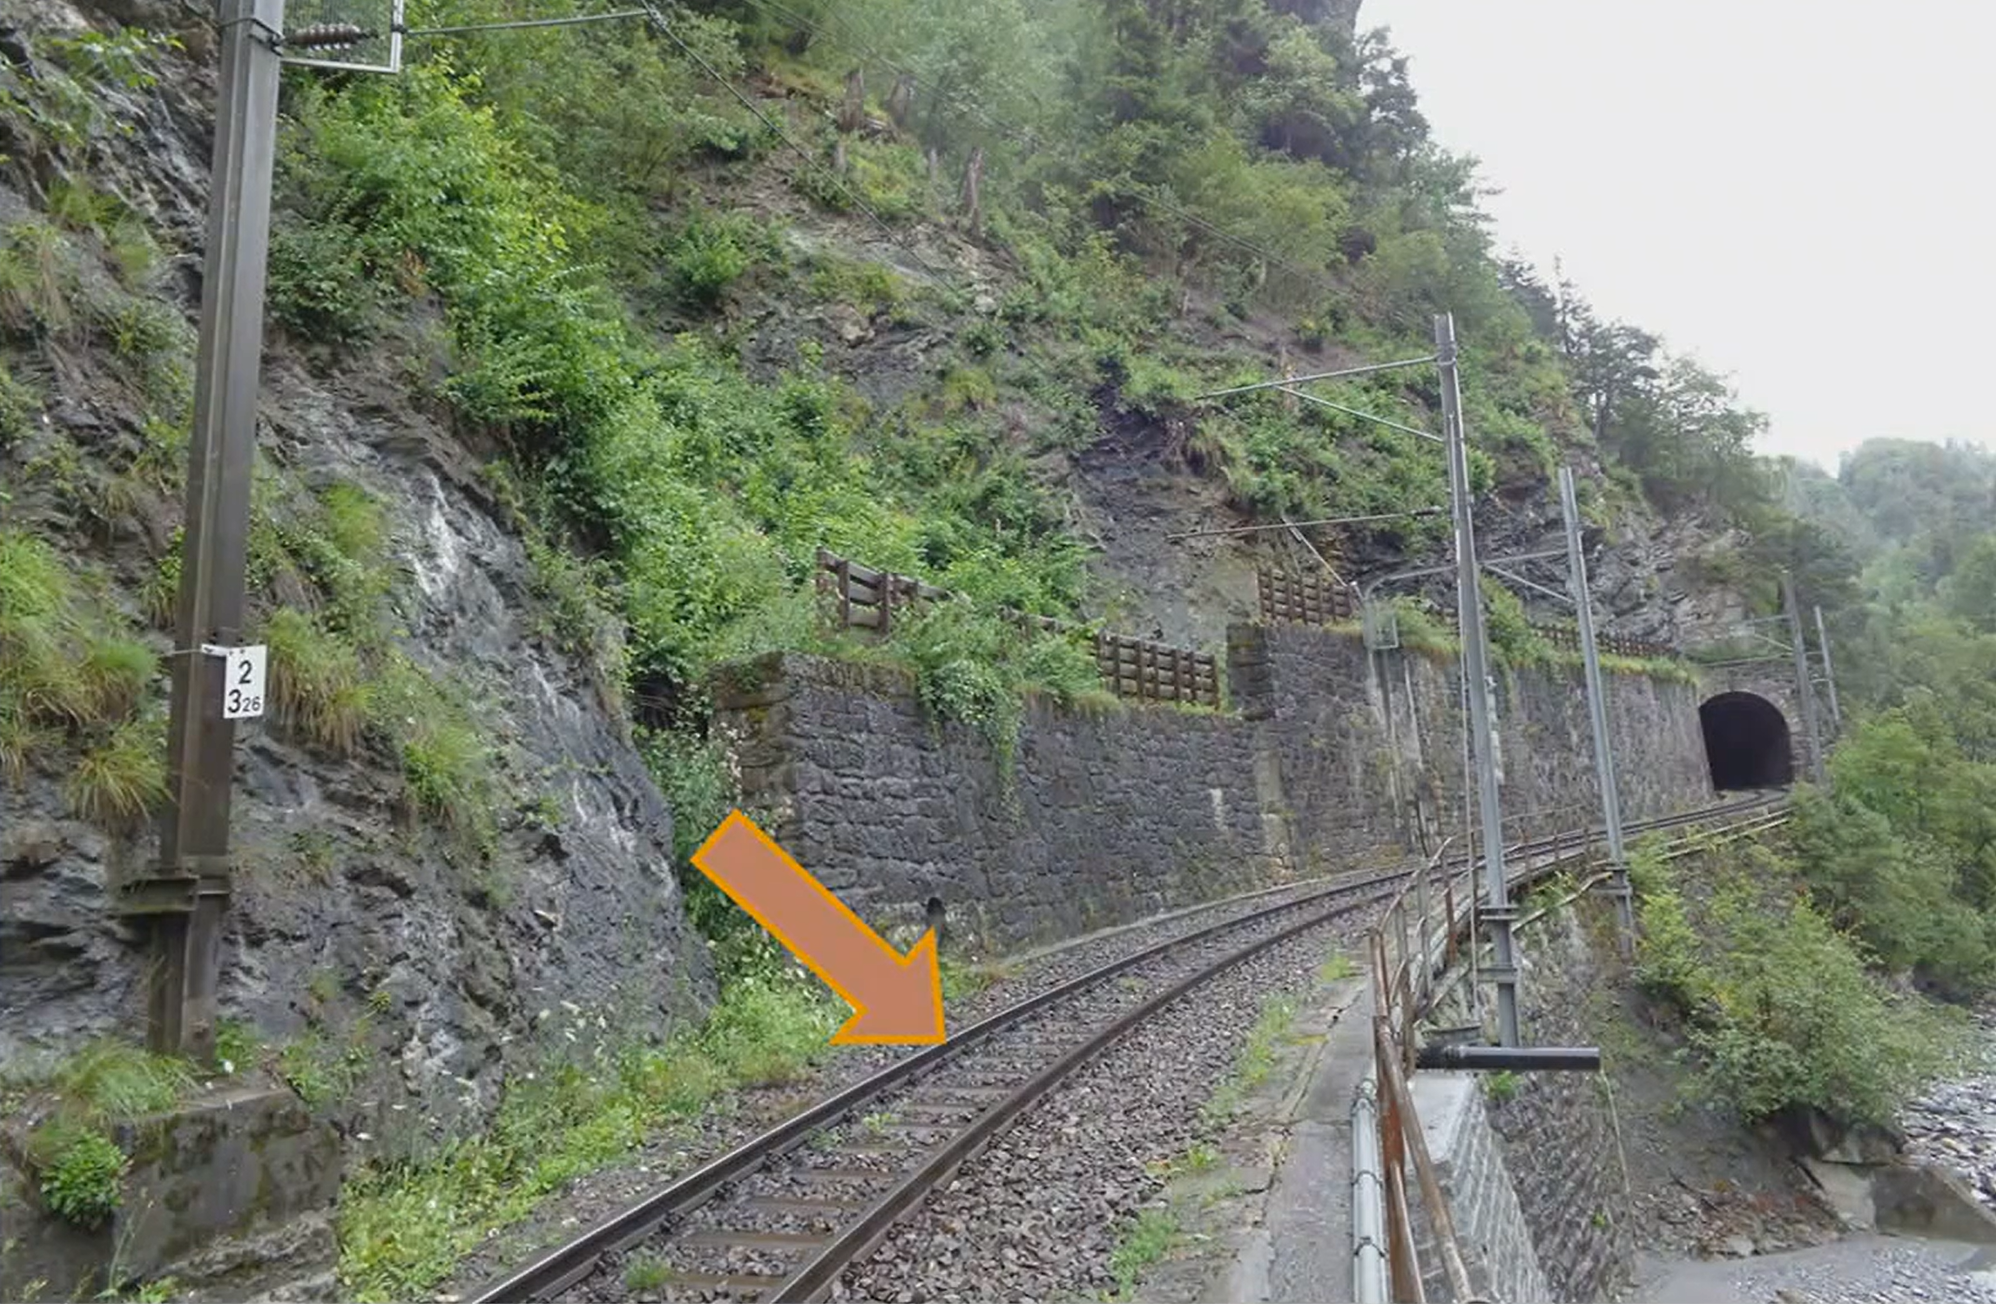
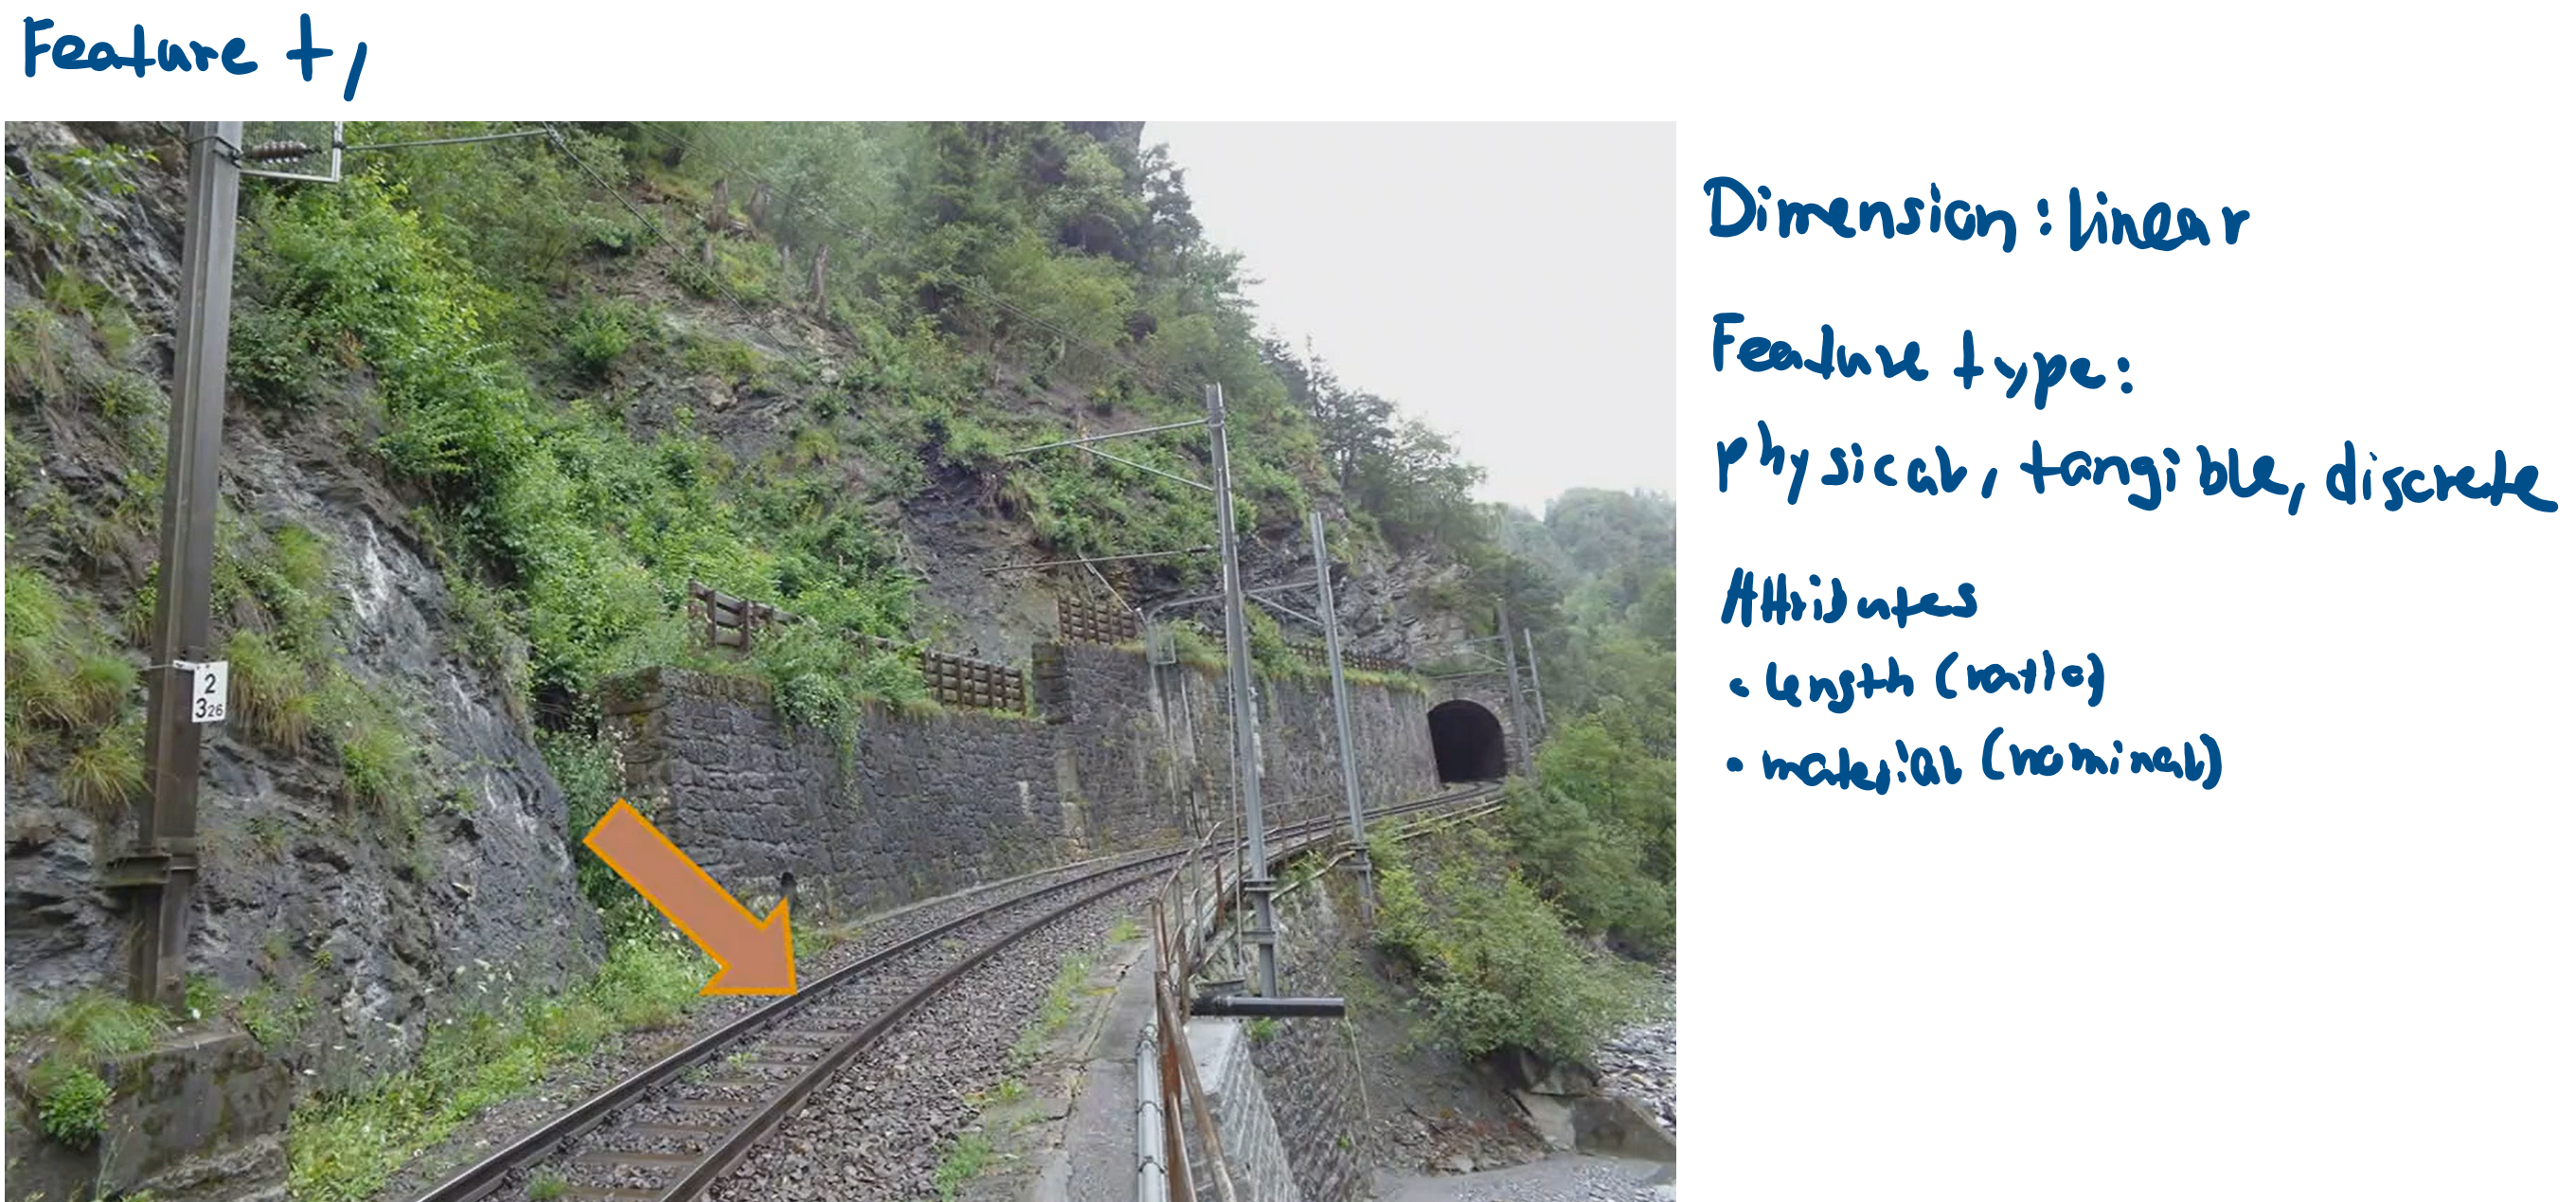
Klicker:
Geographical feature?
Type?
Spatial dimension?
Lvl of measurement?
Map type?
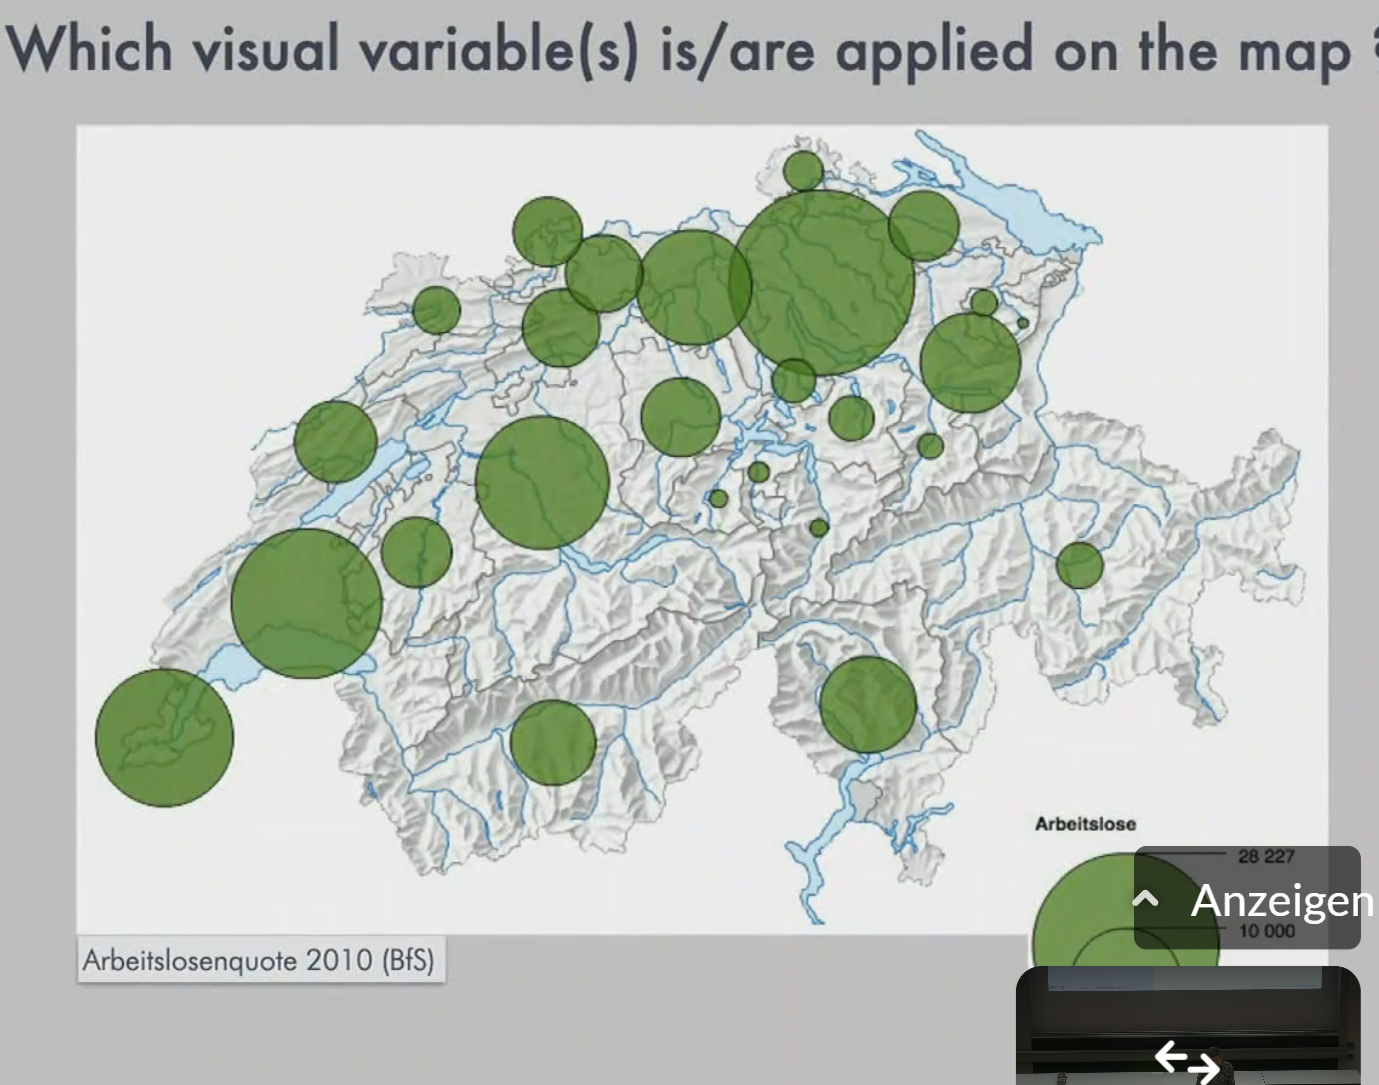
Klicker:
Geographical feature?
Type?
Spatial dimension?
Lvl of measurement?
Map type?