AE2001 Fundamentals of ecology / 7 Demographics
1/17
There's no tags or description
Looks like no tags are added yet.
Name | Mastery | Learn | Test | Matching | Spaced | Call with Kai |
|---|
No analytics yet
Send a link to your students to track their progress
18 Terms
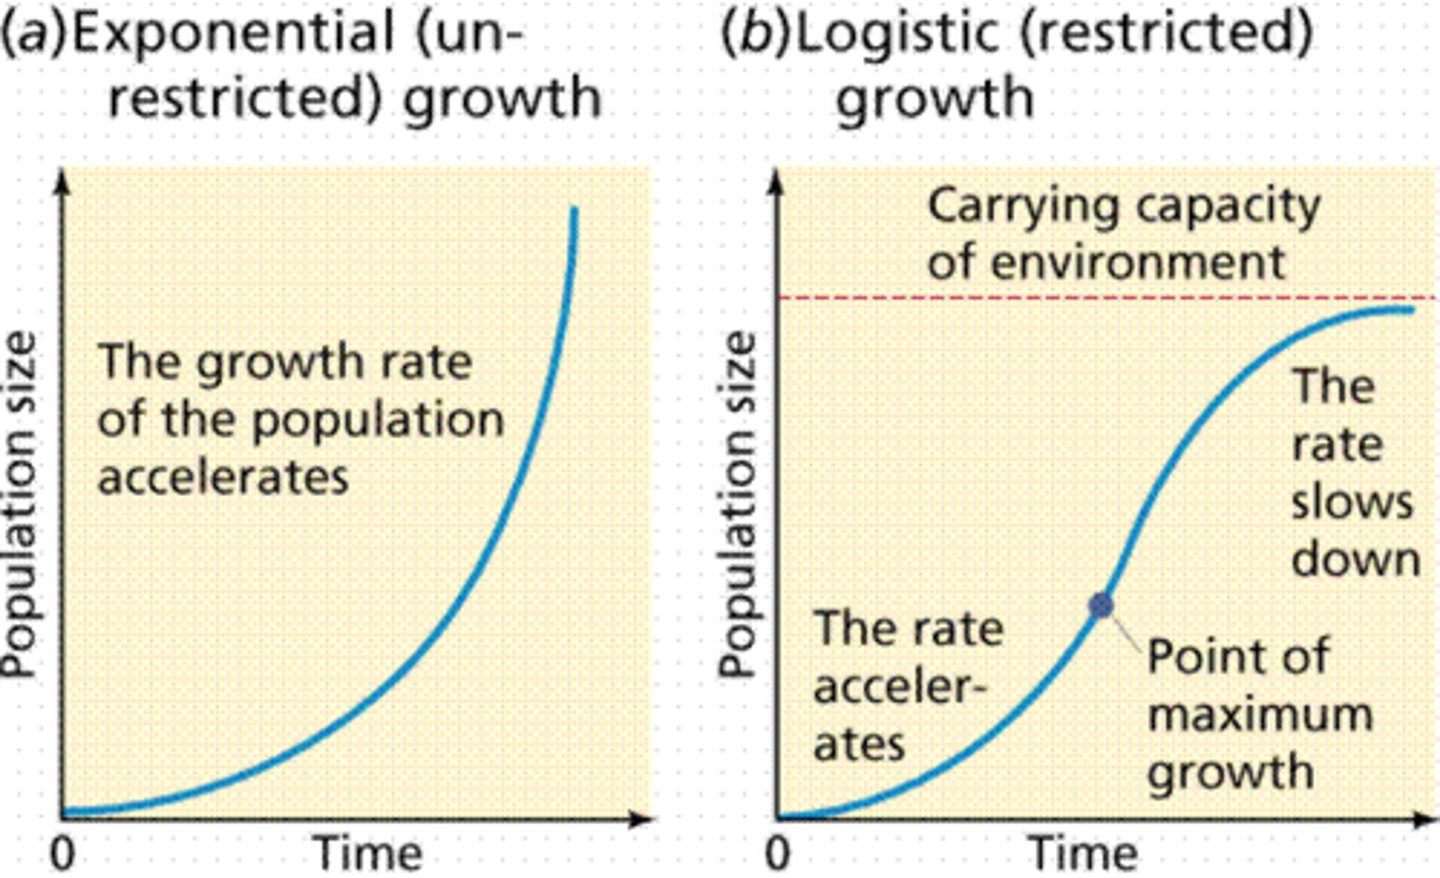
Logistic growth
Growth slows as population reaches carrying capacity (K) due to limited resources.
dN/dt=rN(1−N/K)
N is number of individuals in the population
T is time
r is biotic potential of organism
K is saturation
Density-dependent factors
Regulatory factors that increase in intensity with population size, includes competition, predation, disease.
Density-independent factors
Events affecting population size regardless of density, such as natural disasters, extreme weather, and habitat loss.
Allee effect
At low population densities, survival and reproduction decline due to difficulty finding mates, cooperative behavior breakdown, or genetic bottlenecks.
Reproductive trade-offs
Growth, reproduction, and survival compete for energy. Species with high fecundity often sacrifice longevity or parental care.
Life table
Tracks age-specific survival and reproduction rates to analyse population dynamics & predict growth
Life table components
Age Class (x): Specific age or age interval.
Number Alive (nx): Individuals alive at the start of the age class.
Number Dying (dx): Individuals dying in the age class.
Survivorship (lx): Proportion surviving to the start of age class.
Mortality Rate (qx): Proportion dying during the age class.
Average Number Alive (Lx): Average individuals alive during the age class.
Total Years Lived (Tx): Sum of Lx values.
Life Expectancy (ex): Average remaining years for individuals at the start of age class (ex = Tx / nx)
Net reproductive rate (Ro)
Average number of offspring per female.
Ro > 1 means population grows
Ro < 1 means decline
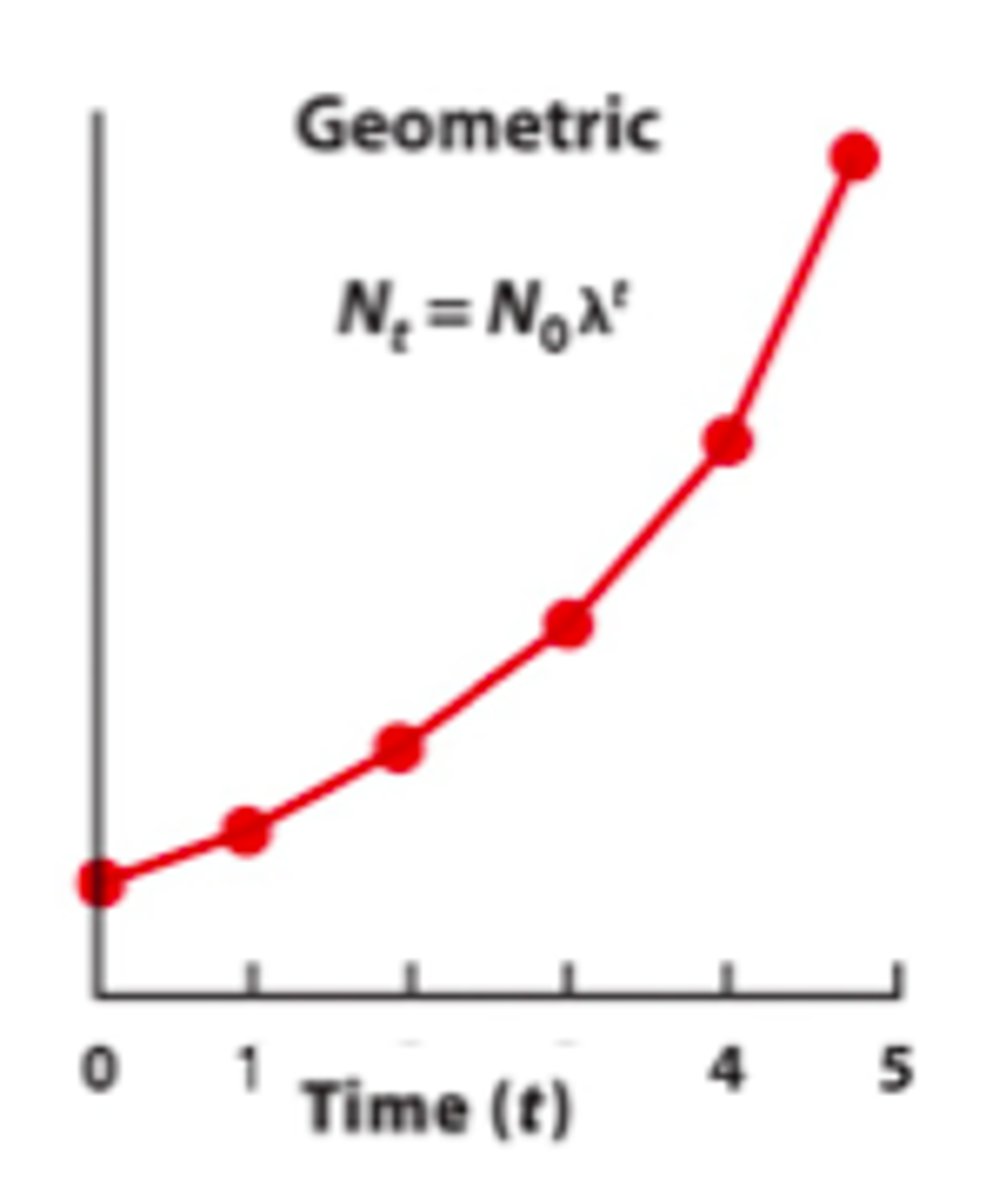
Geometric growth
Each generation increases by a fixed proportion (common in species with non-overlapping generations).
Top-down control
Predators limit prey populations, regulates ecosystems from consumer level downward.
Bottom-up control
Resource availability determines population size, influences entire food chains.
Compensatory mortality
High juvenile mortality reduces competition, increases survival rates later
Overcompensation in populations
High mortality triggers increased reproductive effort, prevents decline
Population dispersal
Immigration: Movement into a population
Emigration: Movement out of a population
Voluntary dispersal: Seasonal migration (e.g., birds)
Forced dispersal: Due to competition, habitat change
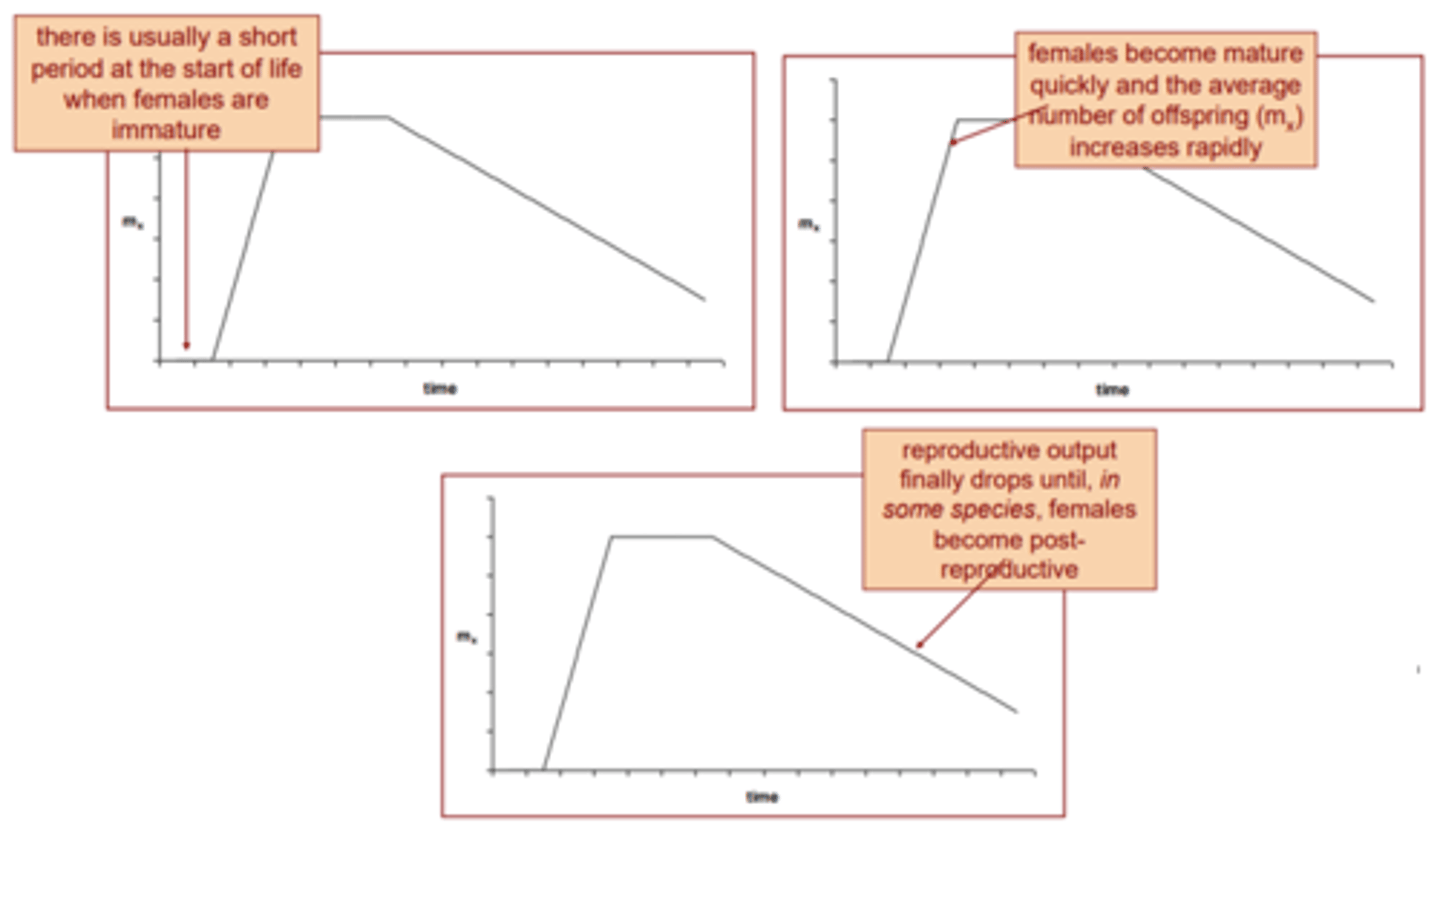
Reproductive trajectories
Constant fecundity: Offspring rate stays the same (e.g., whitetail deer).
Gradual decline: Reproduction decreases over time (e.g., red deer).
Rapid decline: Short reproductive window (e.g., meadow grass).
One-time reproduction (Semelparous): Single reproductive event, then death (e.g., mayflies).
Population pyramids
Expansive pyramid: growing population, with a wide base and narrow top.
Stationary pyramid: stable population, with equal numbers across age groups.
Constrictive pyramid: shrinking population, with a narrow base and wide top.
Fecundity curves
Graph w/ number of offspring @ different ages after reaching reproductive age.
Constant: same offspring rate (whitetail deer).
Gradual decline: offspring decrease with age (red deer).
Rapid decline: offspring sharply decrease with age (meadow grass)
Semelparous: one reproductive event before death (mayflies)
Age structure
Definition: distribution of individuals in different age groups within a population.
Pre-reproductive: age group before individuals can reproduce.
Reproductive: age group where individuals can reproduce.
Post-reproductive: age group after individuals are no longer reproducing.
Population growth: depends on size of pre-reproductive age class.