Ch 8 - decision making and business intelligence
1/36
There's no tags or description
Looks like no tags are added yet.
Name | Mastery | Learn | Test | Matching | Spaced |
|---|
No study sessions yet.
37 Terms
What is decision making in management?
Choosing from a range of alternatives.
It’s a key part of management
Why is rational decision making complicated?
Rationality is hard to define.
Good outcomes can come from bad decisions, and bad outcomes can come from good decisions
Humans have limited ability to process all options, known as 'bounded rationality'.
Bounded rationality
Herbert Simon’s idea that humans try to be rational but can’t consider all options due to limited brainpower. We satisfice, or settle for a good-enough option.
Ackoff's criticisms of early MIS assumptions?
More data doesn't always help.
Managers have too much info, not too little (information overload).
Managers often don’t know what data they actually need.
Information overload
Having too much information to process effectively.
It causes confusion and poor decision making.
Ex: Asking for more data than needed just in case.
The challenge is for managers to find the appropriate data and incorporate them into their decision-making processes
Why does data growth matter in decision making?
Huge amounts of data are being created fast (e.g., 44 zettabytes by 2020).
If used properly, this data can improve decisions, but it can also overwhelm managers.
What are examples of bad data quality issues?
Raw data that is usually unsuitable for sophisticated reporting or data mining
Major problem categories:
Dirty data (e.g., misspelled colors)
Missing values
Inconsistent formats (like phone numbers)
Unintegrated data from different sources
Inappropriate granularity
Data granularity
Refers to how detailed data is.
Fine = very detailed (e.g., click-by-click)
Coarse = summarized.
Too fine can be combined, but coarse data can’t be split further.
How can information systems help with decision making?
They can process and summarize large data sets, helping managers find the right information and avoid overload, if the data is high quality and relevant.
Online Transaction Processing (OLTP)
OLTP systems collect data electronically and process the transactions online
Can be in real time or batched transactions
Backbone of all functional, cross function, and interorganizational systems in an organization
Supports decision making by providing the raw information about transactions and status for an organization
Ex: banks, stores, and airline systems.
Real-time vs batch processing
Real-time processing: updates the system immediately after each transaction (e.g., Ticketmaster)
Batch processing: waits to group transactions before updating (ex: retail sales outlet sending sales data nightly to the head office)
OLAP (Online Analytical Processing)
Helps turn data from OLTP systems into meaningful insights
Data is collected in OLTP, but this makes that data useful for decision making
Provides the ability to sum, count, average, and perform other simple arithmetic operations on groups of data
Provides reports which include more in depth information regarding transactions
OLAP reports are also referred to as cubes
User can alter the format of the report
Why are OLAP servers needed?
Standard databases aren’t made for complex analysis. OLAP servers handle the heavy lifting of sorting, calculating, and formatting large OLAP reports.
OLAP itself isnt a server, but servers are used
What is the data resource challenge?
Even though companies collect lots of data, they often don’t use it well. The challenge is treating data like a valuable asset and using it for decision making.
Business Intelligence (BI) system
Provides information to improve decision making by analyzing data and offering insights that create competitive advantage.
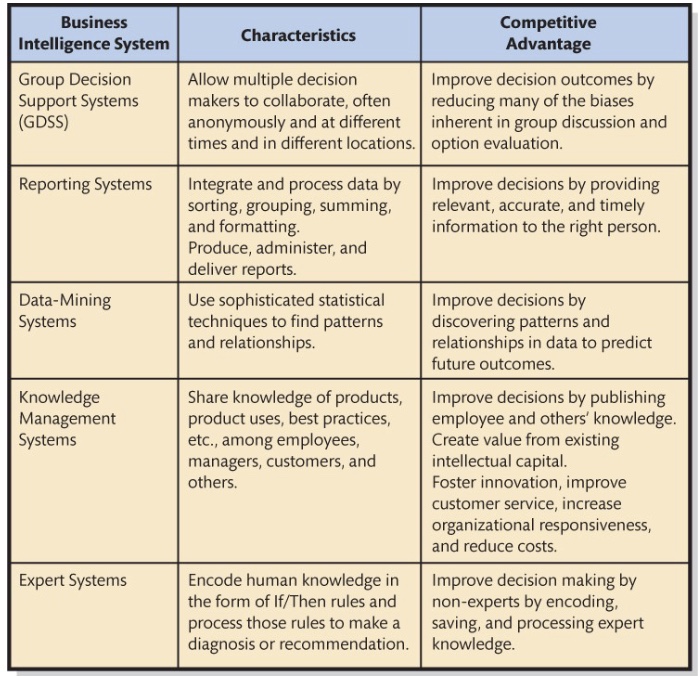
5 categories of business intelligence systems
Group decision support systems
Reporting systems
Data-mining systems
Knowledge-management systems (KM)
Expert systems
Group Decision Support System (GDSS)
Allows multiple decision makers to collaborate (often anonymously) across different locations and times, reducing biases in group decisions.
Input is automatically summed or communicated to the group and contributes to a decision
Reporting systems
These systems integrate and process data through mutiple sources, such as sorting, grouping, summing, averaging, and comparing, then formats the results into reports
Improves decision making by providing the right information to the right user at the right time
Data-mining system
A system that uses sophisticated statistical techniques (such as regression or decision trees) to find patterns and relationships in data to anticipate events or predict future outcomes
includes rfm analysis
Market-based analysis
A type of data-mining system that computes correlations of items on past orders to determine ones frequently purchased together
Knowledge Management (KM) system
Creates value from intellectual capital, collects and shares human knowledge
Benefits:
Fosters innovation
Improves customer service
Increases organizational responsiveness
Reduces costs
Expert system
Uses the knowledge of human experts in the form of “If/then” rules
“If” the condition is true, “then” initiate procedure
Ex: if patient temp > 103, then initiate high_fever_procedure
Improves the diagnosis and decision making in non-experts by applying expert knowledge automatically
Characteristics and competitive advantage of business intelligence systems
What is RFM analysis?
A method for ranking customers based on how Recently (R) they purchased, how Frequently (F) they buy, and how much Money (M) they spend.
Analysis using operational data
Doing analysis using operational data is not recommended
There are security and control concerns
Operational data is not set up for analysis, but for fast and reliable transaction processing, and considerable processes is required for BI analysis
Operational data gets extracted for BI processing: to a database for small companies and to a data warehouse for larger companies
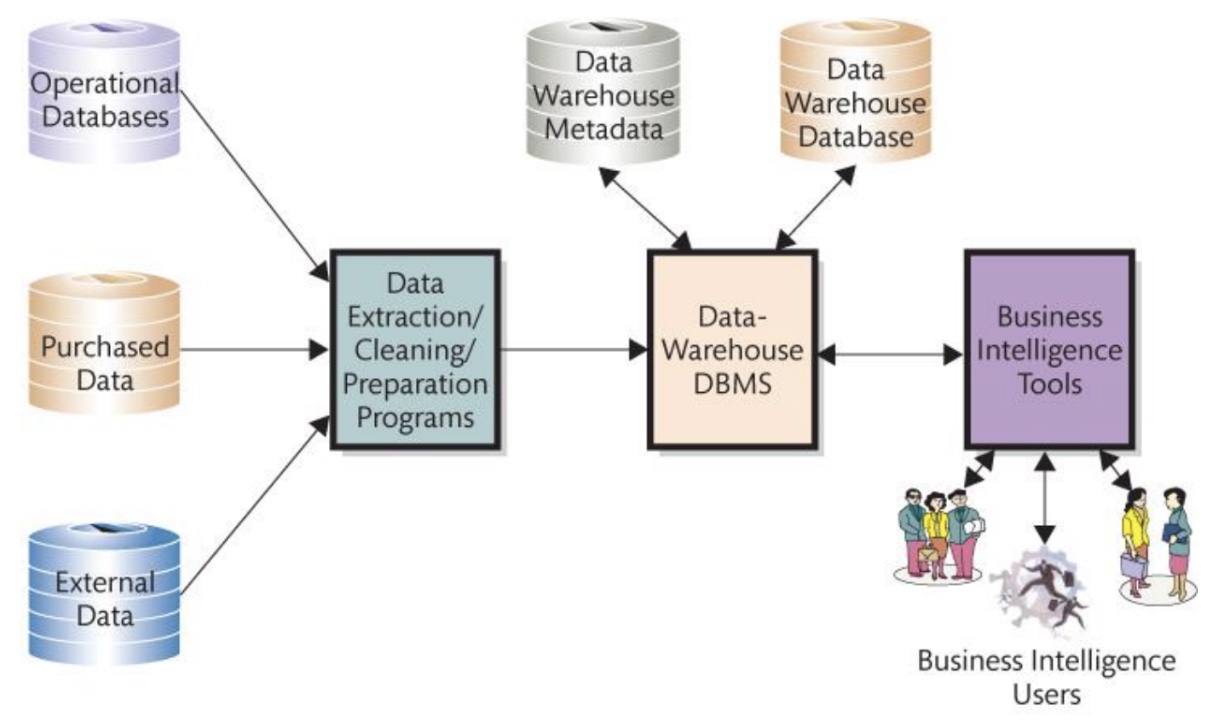
Data warehouse
A repository for managing an organizations BI data
Comes from operational systems, purchased data, and external data
Stores metadata (data about data)
What are the functions of a data warehouse?
1. Obtain data
2. Cleanse data
3. Organize and relate data
4. Catalog data
Diagram of components of a data warehouse
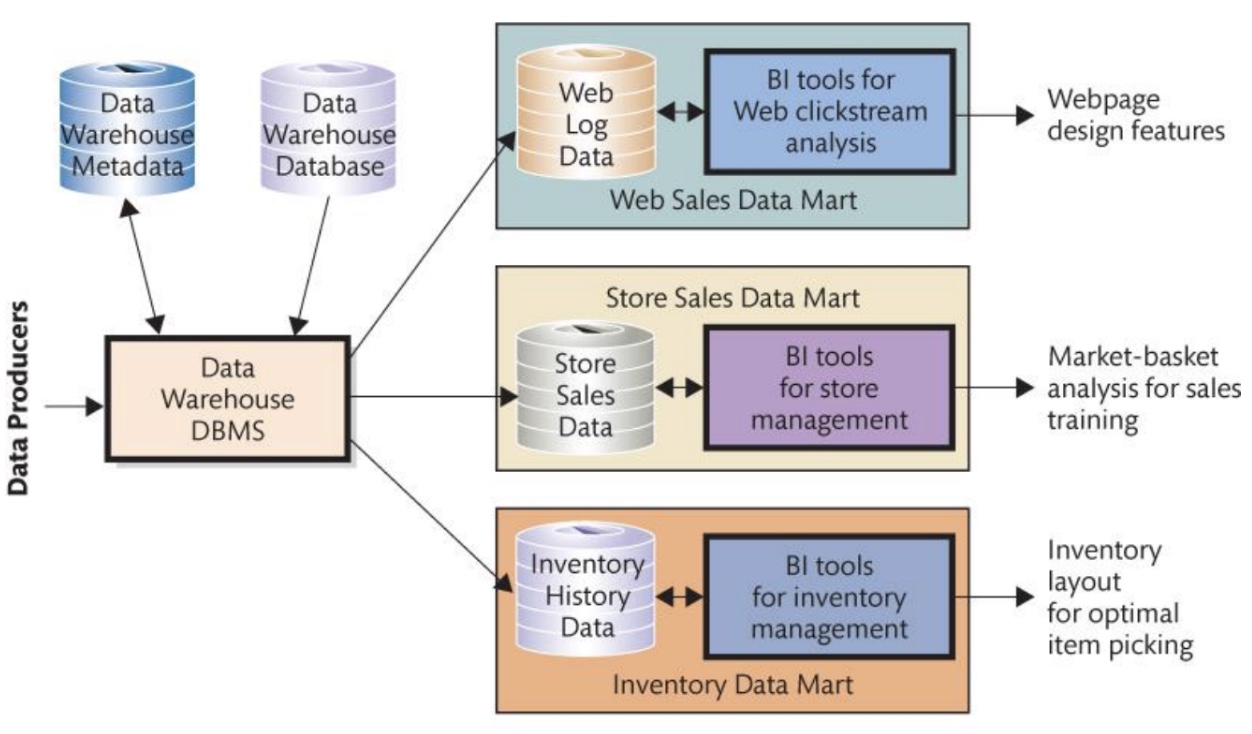
Data mart
A data collection designed to serve a specific business function, problem, or opportunity.
Companies may have more than one (ex: one for web log data, one for market-based analysis, one for inventory, etc)
Smaller than a data warehouse
Note: Data warehouses and data marts can be expensive to build and operate. Smaller organizations may only need a simple data mart for specific analysis needs.
Diagram of components of a data mart
Data Mining
The process of using statistical techniques to find patterns and relationships in large sets of data.
Areas of discipline for data mining:
Stats/math
AI and machine learning
Useful areas for data mining include:
Future healthcare (predictions)
Market basket analysis
Education
Manufacturing engineering
CRM
What are the two types of data mining?
Unsupervised: No model or hypothesis beforehand; patterns are discovered from data. Ex: cluster analysis (identifies groups of entities that have similar characteristics)
Supervised: A model is made first, and data is used to test or build it. (ex: regression analysis, neutral networks, market-based analysis)
Regression analysis
Measures the impact of a set of variables on another variable
Neutral networks
Used to predict values and make classifications, such as “good prospect” or “poor prospect” customers
Market-based analysis
Determining sales patterns; items that tend to be bought together
Big data
Large amounts of varied data from a variety of sources over a period of time that could be used to make better decisions
Controversy over big data
Lack of precision on its definition
Adds to excessive data collection
Expensive
Imprecise (overly vague or general)