PMP Exam
1/291
Earn XP
Description and Tags
studying for pmp exam
Name | Mastery | Learn | Test | Matching | Spaced | Call with Kai |
|---|
No analytics yet
Send a link to your students to track their progress
292 Terms
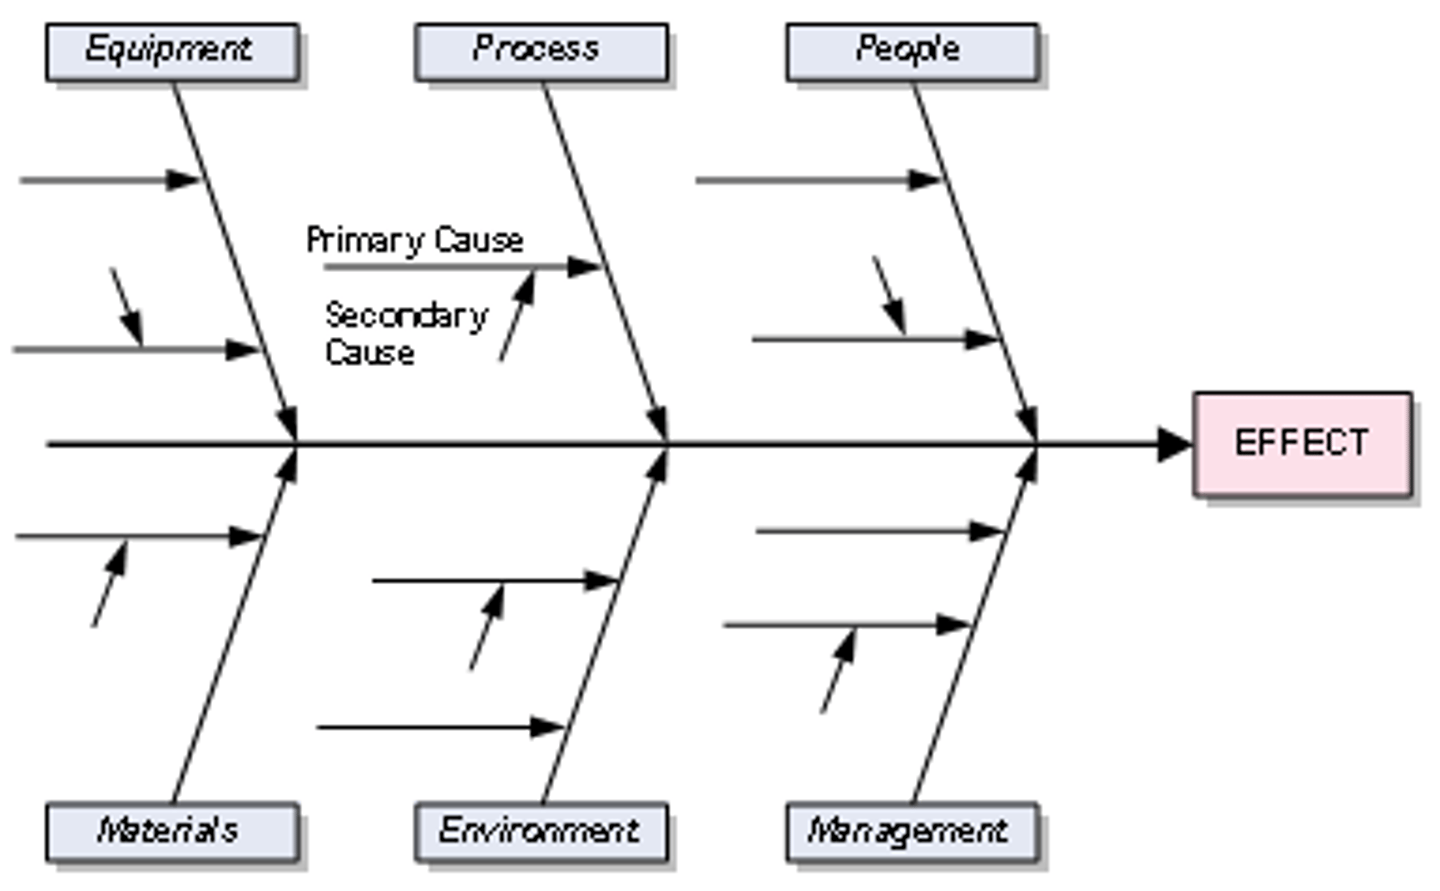
Ishikawa Diagram
• fishbone/cause and effect diagram
• used to identify cause of defect
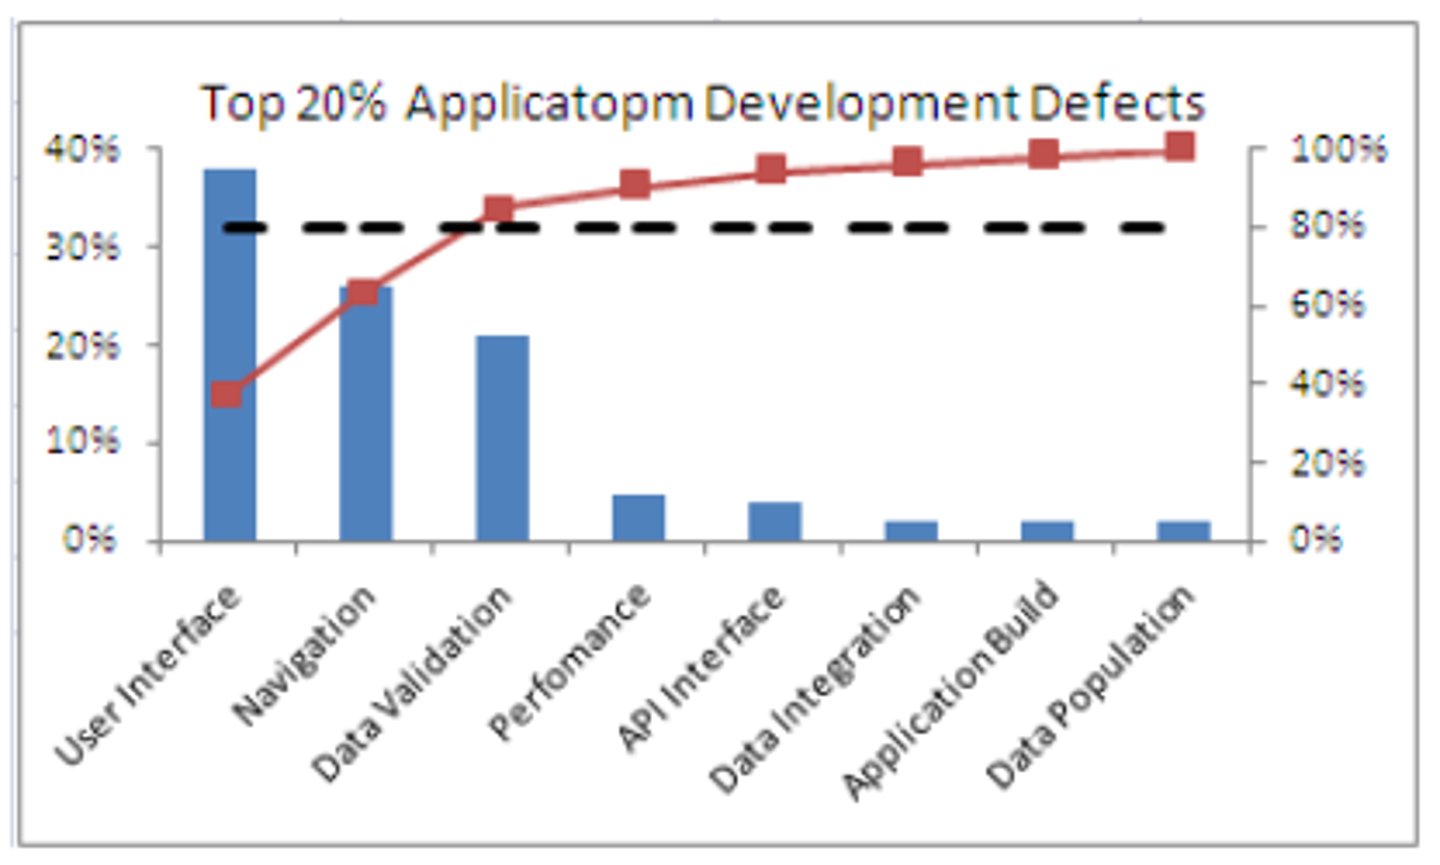
Pareto Diagram
• histogram
• display frequency
• used for quality
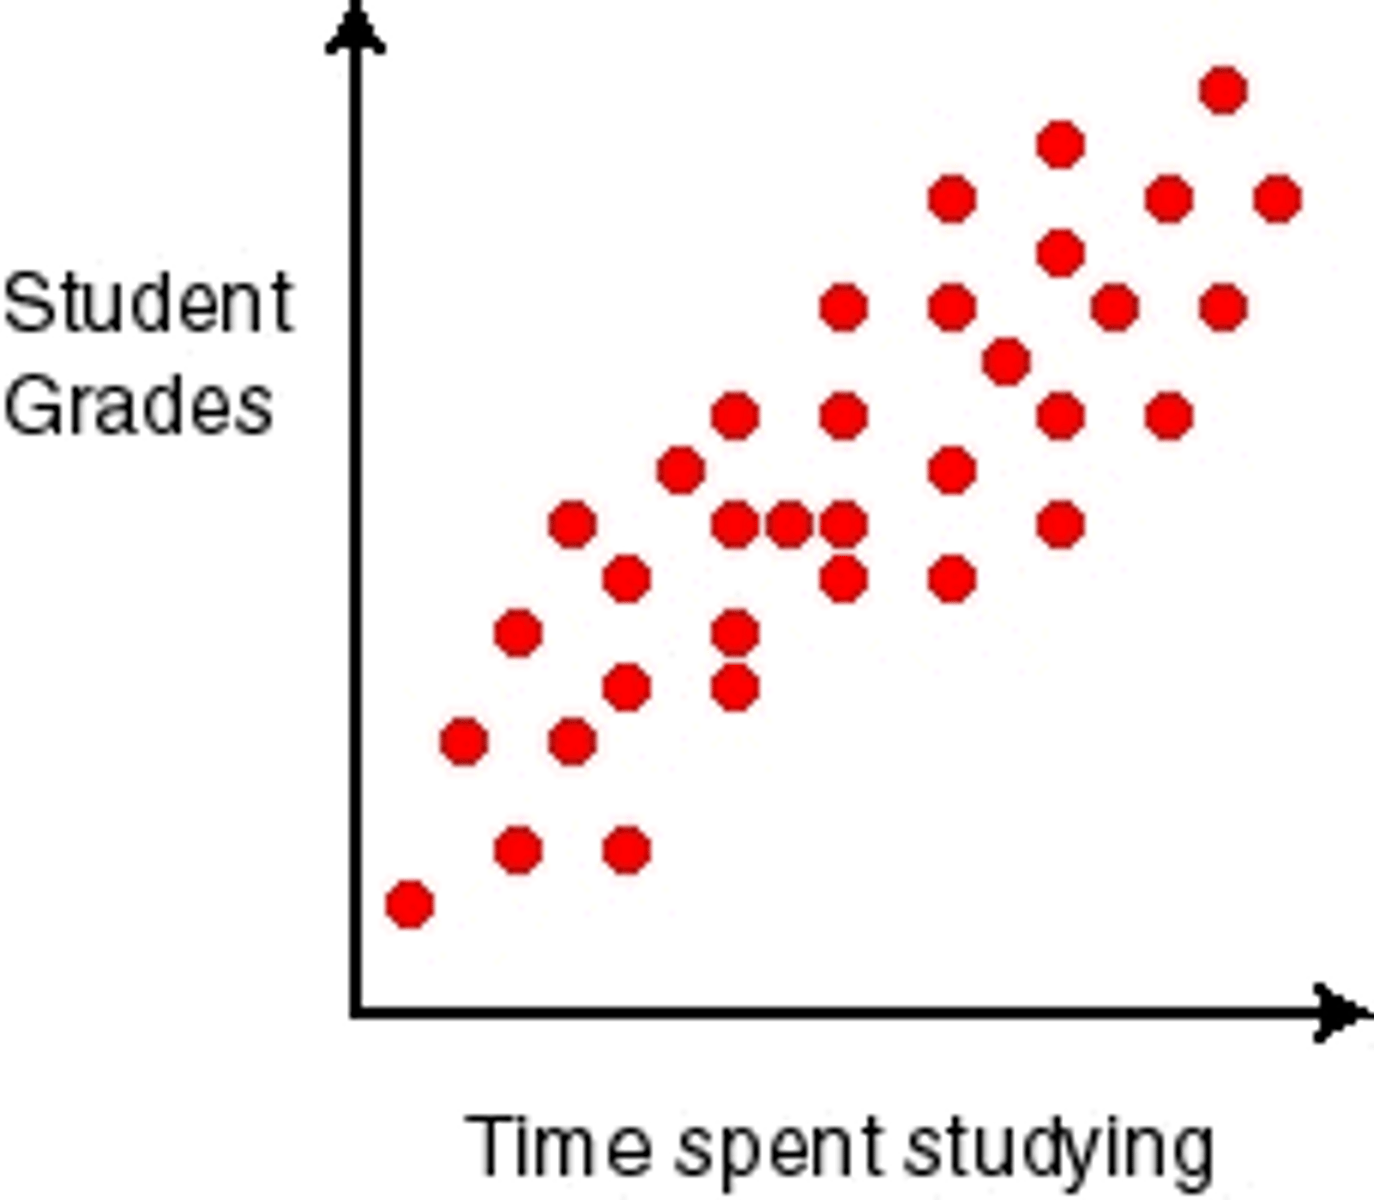
Scatter Diagram
shows degree + direction of trends
Control Chart
• tells if a process is in control
• identifies rule of seven
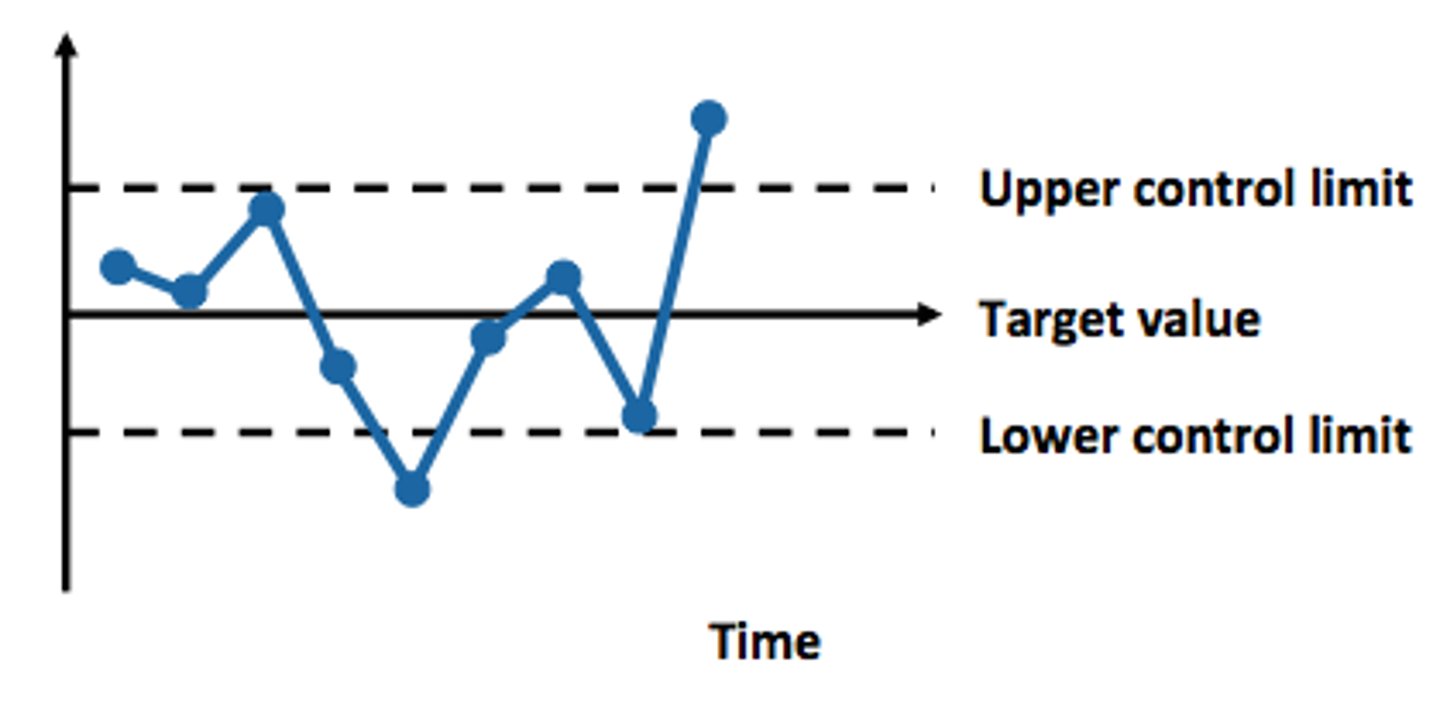
Rule of Seven
must be 7 consecutive points above/below middle line for process to be out of control
Project
temporary endeavor that produces a unique product
Operation
things that never ends
Progressive Elaboration
as time is progressing things in a project become more elaborate
Project Management
• application of knowledge, skills, tools, and techniques to satisfy project requirements
• people management
Program Management
group of projects coordinated to obtain benefits not available managed individually
Program Manager
manages team of project managers
Project Management Office (PMO)
structure that standardizes processes and facilitates sharing of resources
Supportive PMO
supports PM, providing templates/lessons
Controlling PMO
determines framework and use of specific forms
Directive PMO
controls project, PM assigned and reports to PMO
Portfolio
collection of projects + programs managed as a group to achieve strategic objectives
Operation Management
deals with ongoing production (ex sales, IT, accounting)
Phase
collection of logically related project activities that culminates in the completion of deliverables
Life Cycle
representation of the phases that a project goes from start to finish
System
set of interacting and interdependent components that function as a unified whole
Authority
right to exercise power and control individuals
Leadership
motivate people toward common goal, inspire them to align individual efforts in favor of collect efforts
Leading KPI
predicts changes or trends
Lagging KPI
measure project deliverables, provide info after the fact
SMART
specific, meaningful, achievable, relevant, and timely
Enterprise Environmental Factors (EEF)
things that impact the project but are not part of the project itself
Organization Process Assets (OPA)
assets provided by business to help project
Project Management Plan
doc that defines how the project is executed, mc, and closed
PM Information System (PMIS)
automated system used to help PM optimize schedule + keep track of all docs and deliverables
Work Performance Data
raw data of status of work done
Work Performance Report
• overall status report
• work performance data compared against plan
Strong Matrix
full time PM and moderate to high control over resources
Weak/Functional Matrix
part time PM and resource availability controlled by the functional manager
Project-Oriented Structure
PM has high to complete control over resources
Hybrid Stucture
multiple structures of functional and project oriented PM
Project Charter
• doc formally authorize project
• outlines project objectives
• defines authority of PM
• includes business case, PM benefit plan, and agreements
Project Benefits Management Plan
describes main benefits the project will produce once completed and how to measure the benefits
Business Case
necessary info that determines whether or not project is worth investing
Assumption Log
list of things perceived to be true (assumptions) and things that might constrain the project
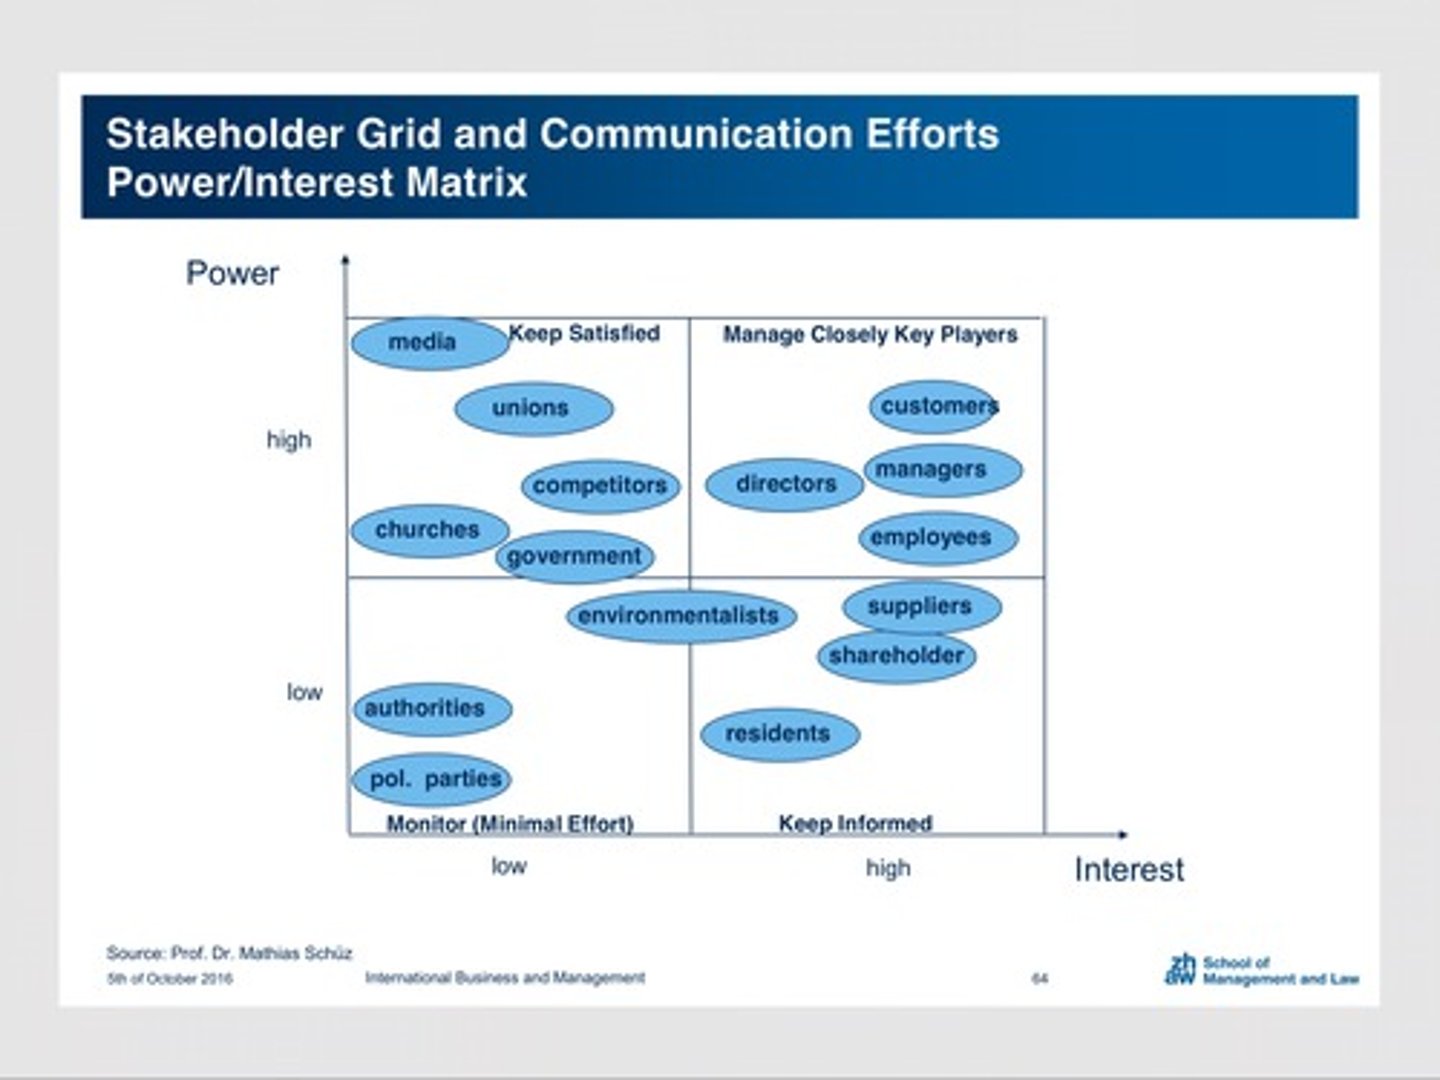
Stakeholder Grid
3D method to support mapping of stakeholder interest, power, and influence
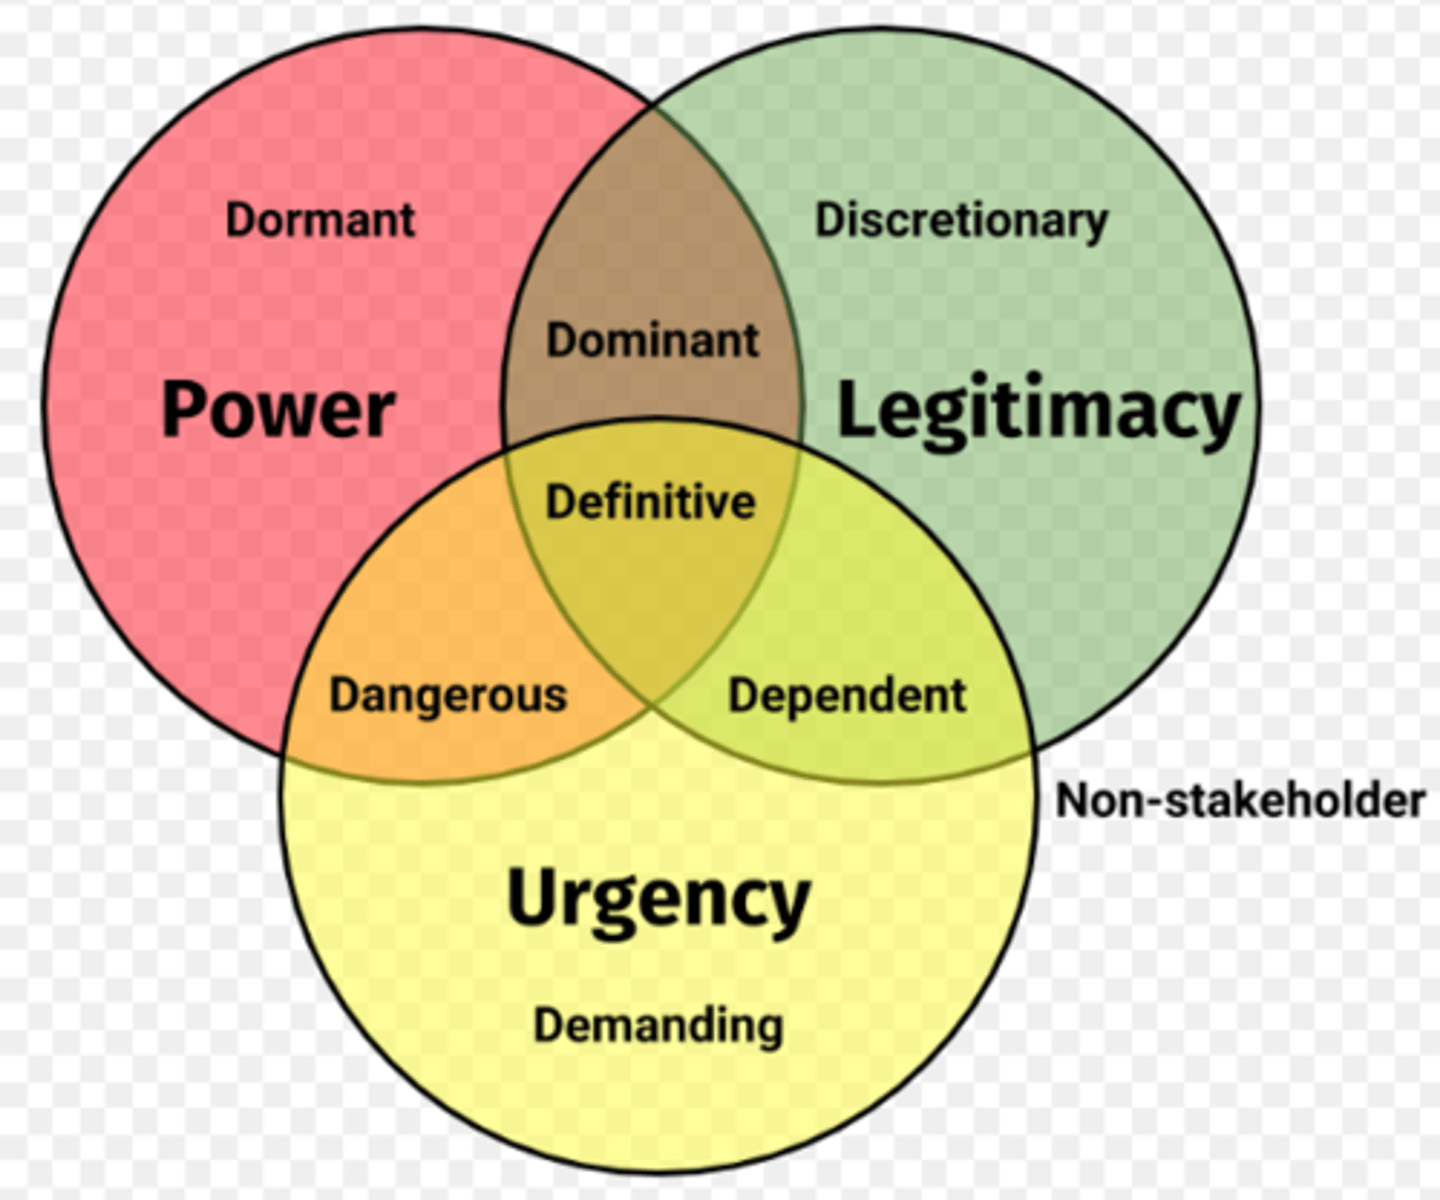
Salience Model
power, legitimacy, and urgency
Stakeholder Register
contains contact info, role on project, communication requirements, expectation, affect, power influence level
Product Scope
features and functions that characterize a product/service
Project Scope
work needed to be accomplished to deliver a product with specified features and functions
Gold Plated
extra work not in scope
Scope Creep
unauthorized work added to scope
Scope Management Plan
how scope will be defined, developed, mc, and verified
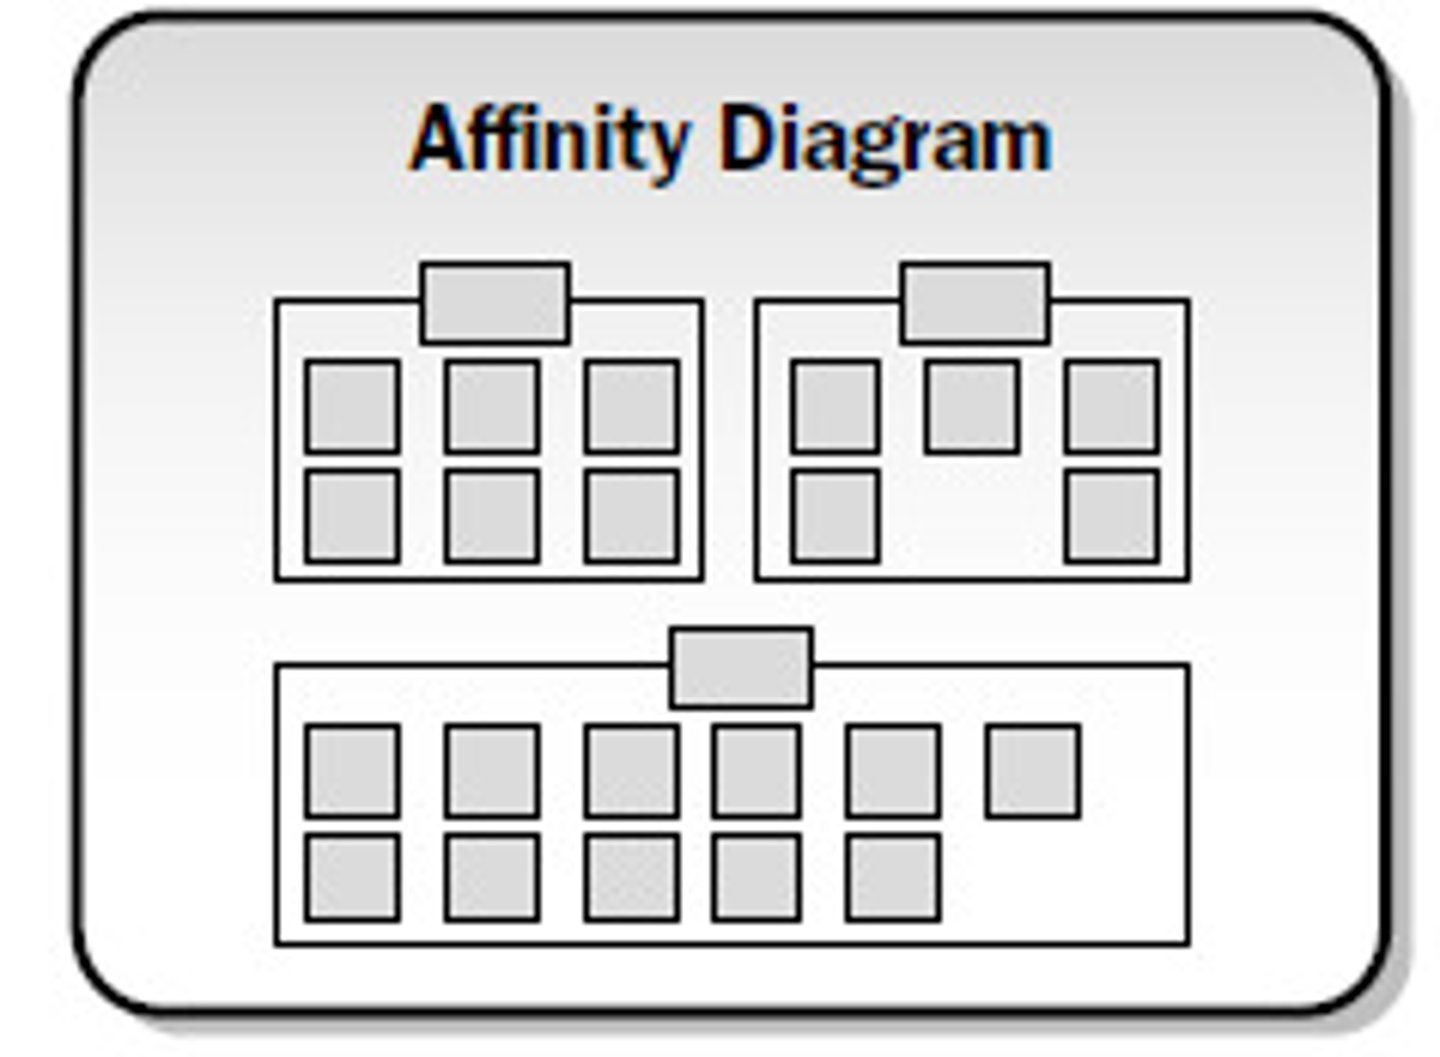
Affinity Diagram
large ideas that are grouped together and sorted for further review and analysis
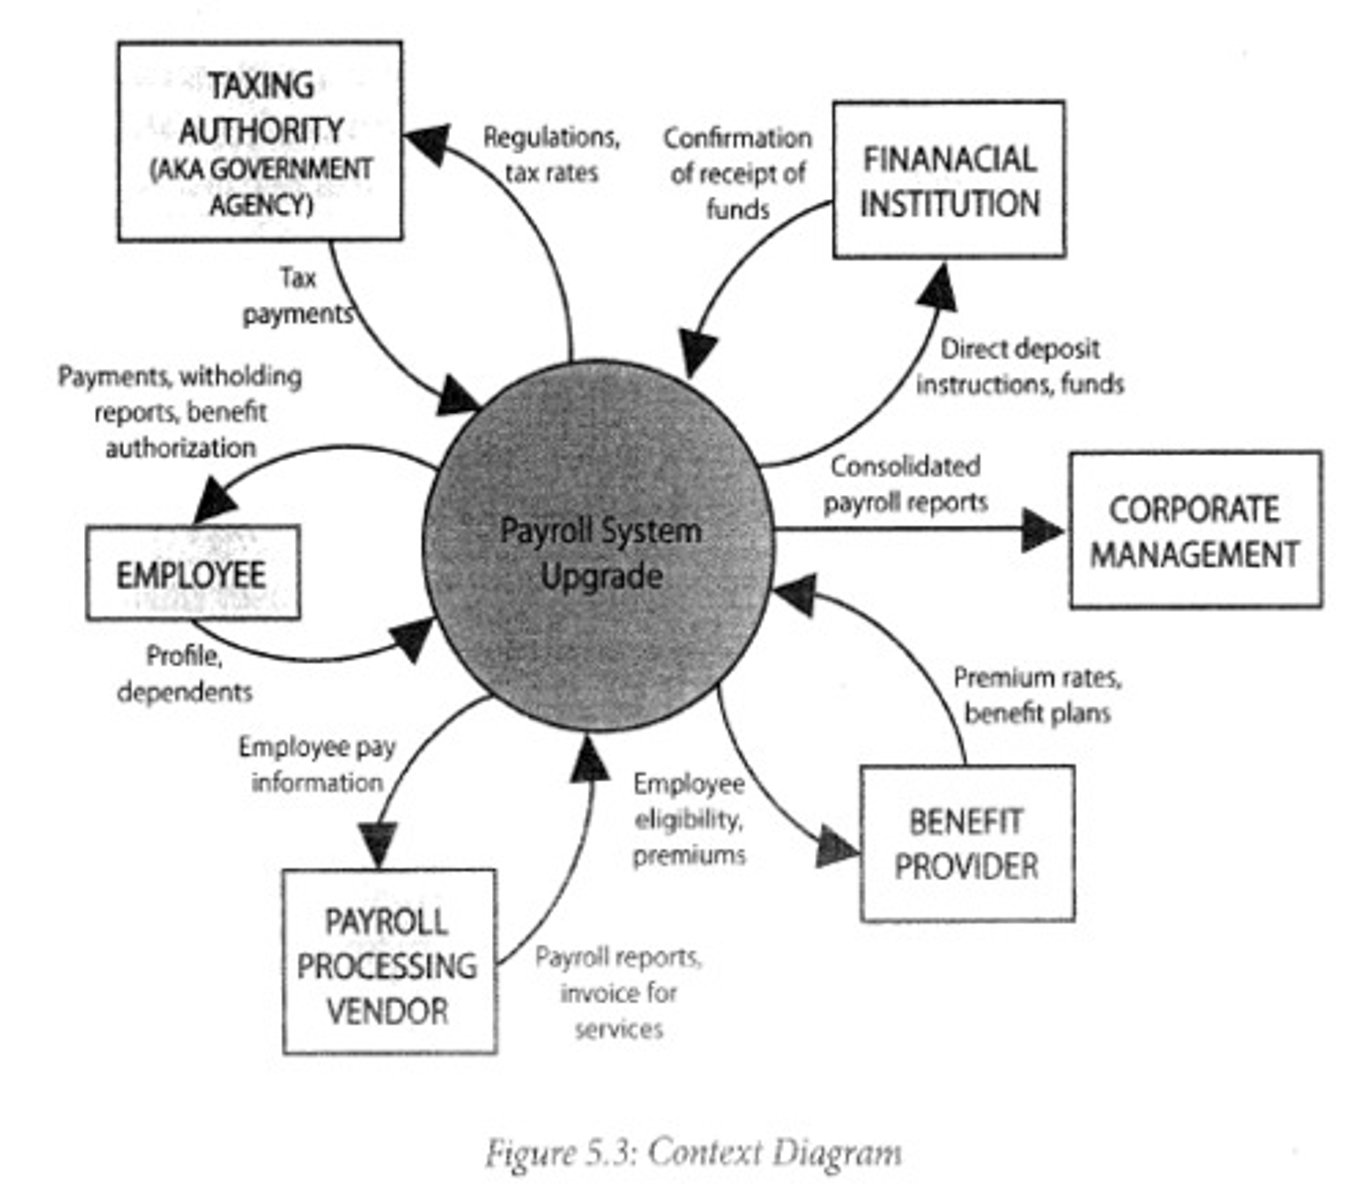
Context Diagrams
used to visually show how business process, other systems, and people interact
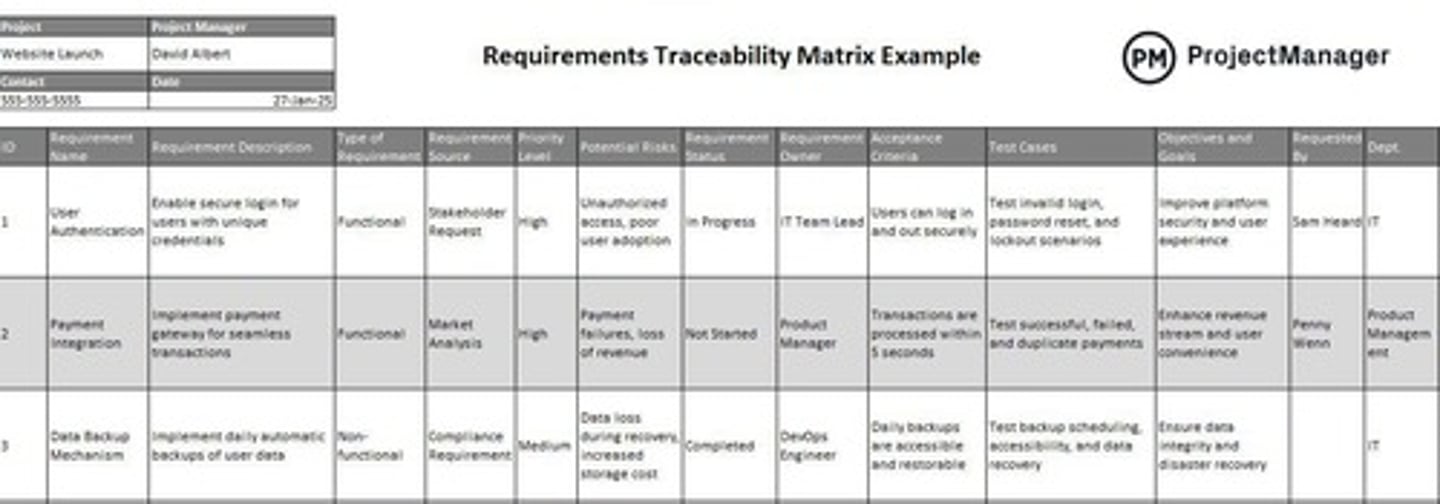
Requirement Traceability Matrix
once a requirement is created a table is created that will link requirement back to its source
Project Scope Statement
describes in detail project deliverables and work required to produce those deliverables
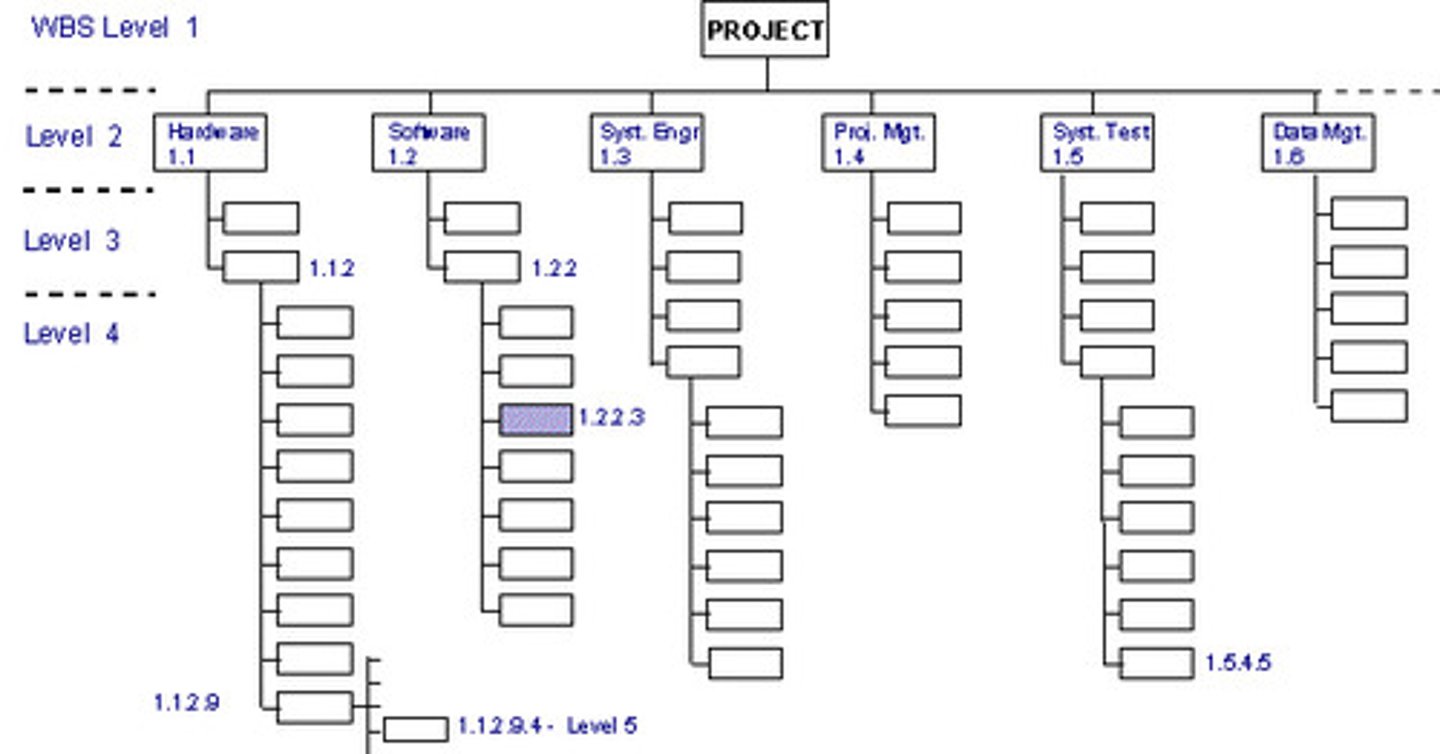
Work Breakdown Structure (WBS)
subdividing project deliverables and work into smaller more manageable components
Scope Baseline
3 components:
• project scope statement
• WBS
• WBS dictionary
WBS Dictionary
document detailing contents of the WBS, expanding info
Work Packages
broken down into activities
Activities
process of identifying and documenting specific actions to be performed to product deliverables
Rolling Wave Planning
near term work packages able to be defined in much great detail
Milestone List
key dates
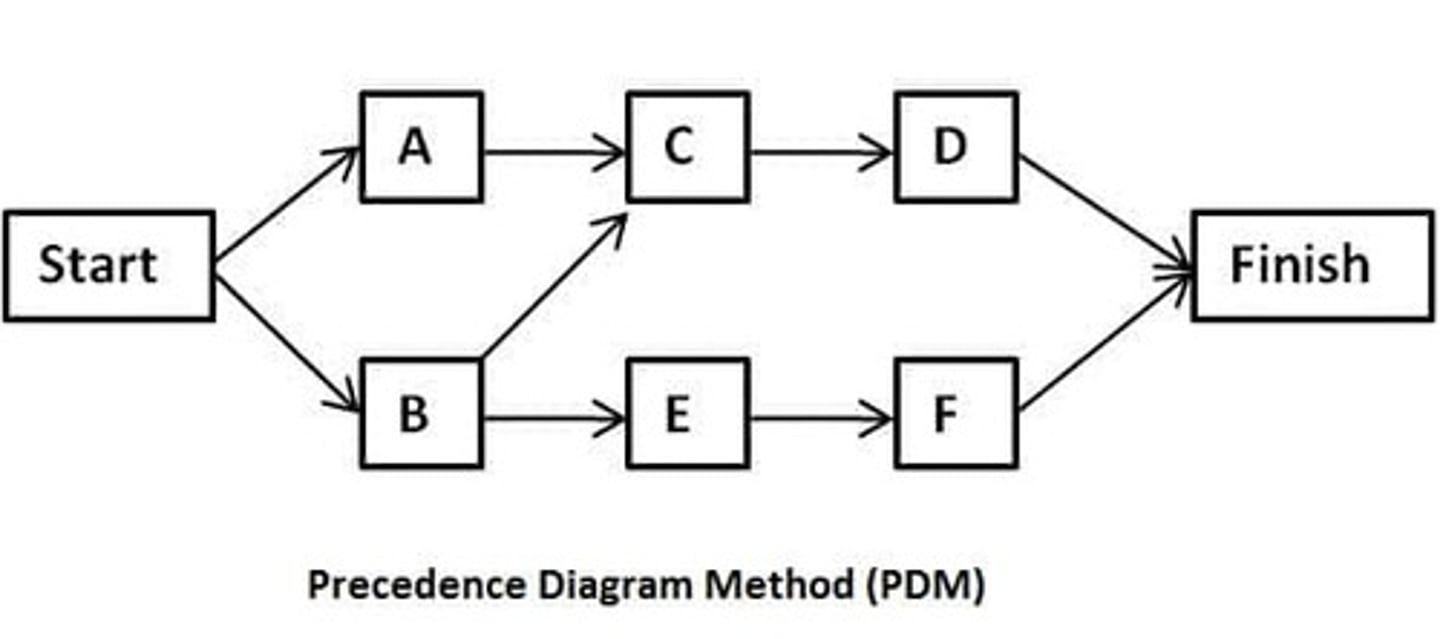
Precedence Diagramming Method (PDM)
• graphical representation of all work needed to be performed
• represents flow of project
• what work packages tie into another work package
Finish to Start
• most commonly used
• start of successors work package depends upon completion of its predecessor work package
Finish to Finish
completion of successor work package depends on completion of the predecessor work package
Start to Start
Start of successor work package depends upon start of its predecessor work package
Start to Finish
Completion of successor works package depends upon start of its predecessor work package
Mandatory Dependencies
• hard logic
• tangible limitation of packages that are tied together
• one work package must be completed before subsequent begin
• ex turn on computed before writing code
Discretionary Dependencies
• soft logic
• work packages tied together but don't have physical limitations
• work in unison or tandem
• ex cook dessert and dinner at the same time
External Dependencies
• work package relationship between project and non project activities
• non project activities outside project team control
• ex gas stations receive gas before can fill up gas tank
Internal Dependencies
project activities within control of the team
Lead
• amount of time successor activity can be advanced with respect to predecessor activity
• ex windows installed 3 wks before siding installed
Lag
• delay in successor work
• ex windows can't be scheduled to be installed until walls have been installed
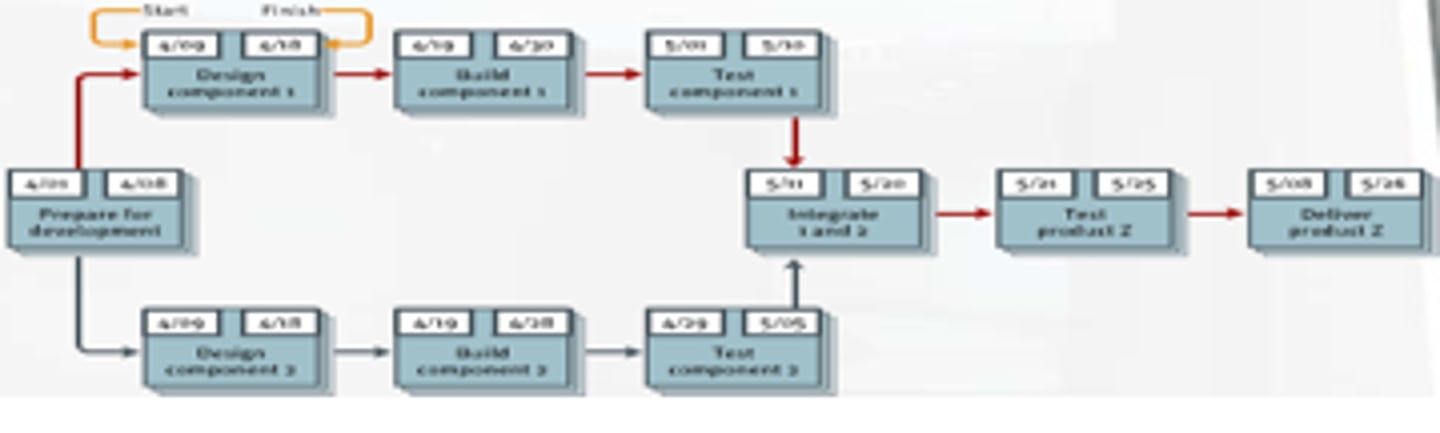
Project Schedule Network Diagrams
system wide drawings show entire project work packages from start to finish
Analogous/Top Down Estimating
• rely on historical info to predict estimates for current project
• used when there is limit info
• costs less in time and money but gives least accuracy
Bottom Up Estimating
• takes a very long time to complete but highly accurate
• breaks down work to lowest levels and then aggregate work back up to find overall duration
Parametric
technique that uses statistical relationship between historical data and other variables to calculate estimate for activity parameters
Three Point Estimate
• calculates expected duration using weight avg 3 estimated optimistic, pessimistic, and most likely
• (O + P + 4M)/6
Basis of Estimates
how estimates were developed and their range
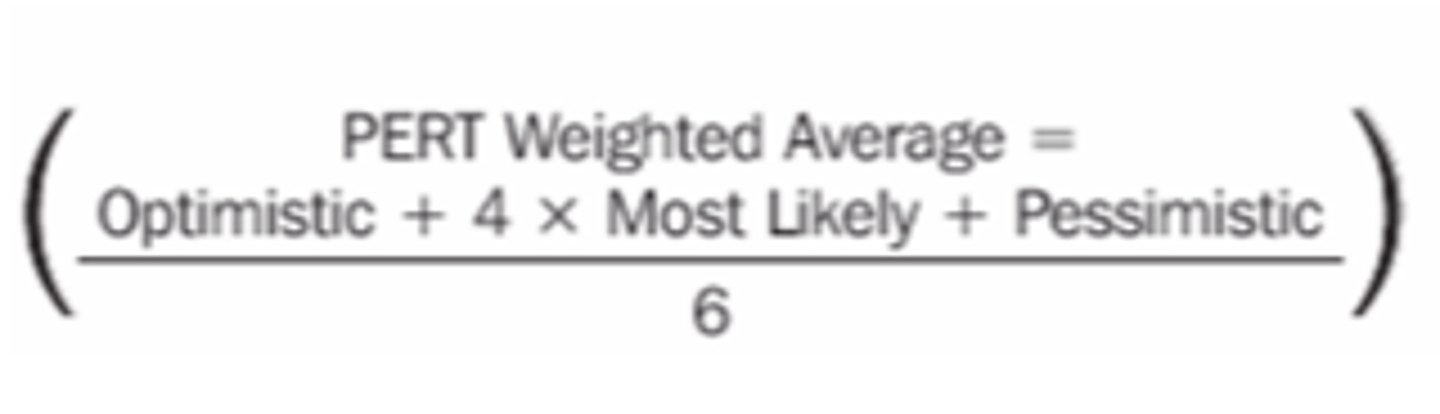
PERT
• scheduling tool that uses weighted average formula to predict length of activities and the project
• (optimistic + (4 x realistic) + pessimistic/6
Standard Deviation
(pessimistic - optimistic)/ 6
Triangle Distribution
(optimistic + realistic + pessimistic)/3
Critical Chain Method
method of planning and managing projects that puts more emphasis on the resources required to execute project tasks developed
Crashing Schedule
adding resources to a project activity
Fast Tracking
activities performed in parallel
Critical Path Method
• Used to identify longest sequence of dependent tasks required to complete a project
• Determines minimum total time needed to complete project and pinpoint tasks that can't be delayed without impact final project
Calculate Float/Slack
Float = LS-ES or LF-EF
Forward Pass
ES + Duration - 1 = EF
Backward Pass
Critical Path (LF) - duration + 1 - LS
Free Float
• amount of time task can be delayed without delaying early start of its immediate successor
• ES of next activity - EF of current activity - 1
Total Float
amount of time task can be delayed without delaying overall project completion date
Float
LF - EF
Definitive Estimate
-5% to +10%
Budget Estimate
-10% to + 25%
Rough Order of Magnitude Estimate
-25% to +75%
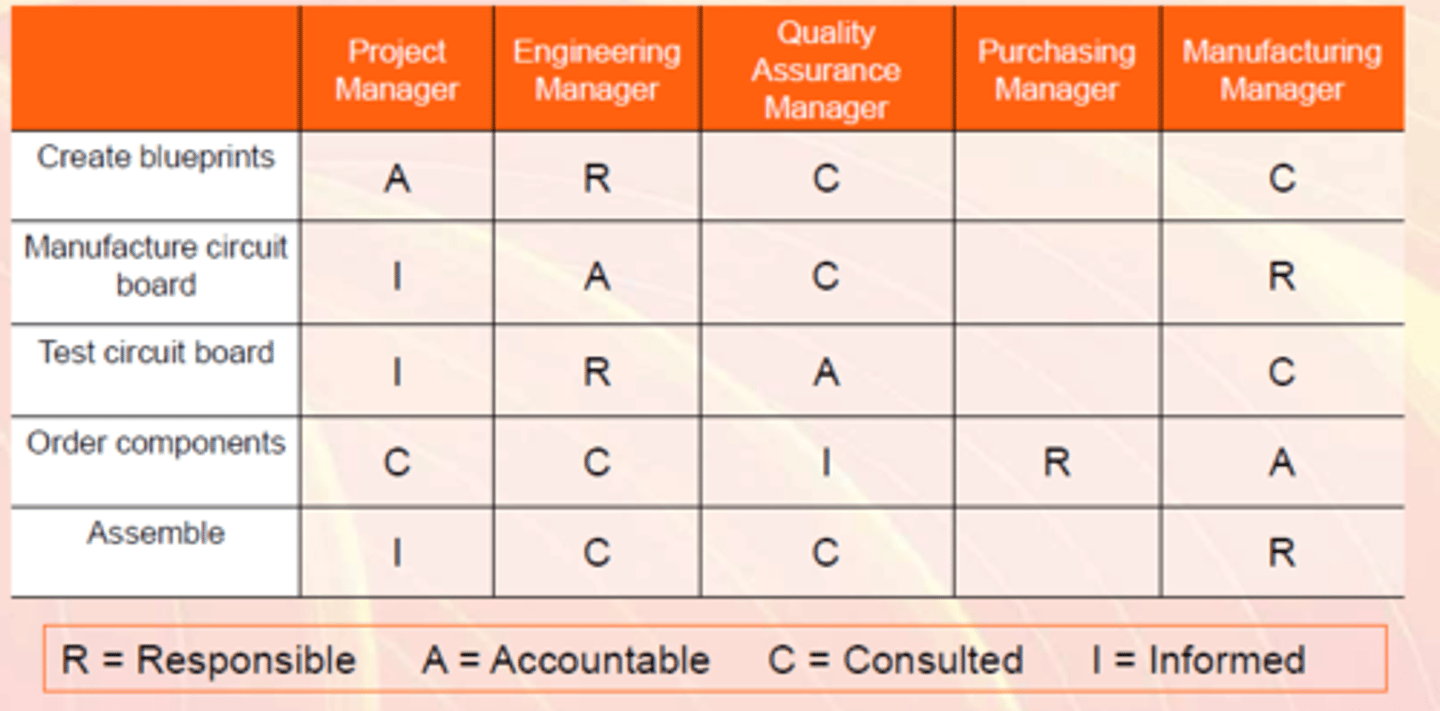
RACI chart
Responsible, Accountable, Consulted, and Informed, and prevents bottlenecks by clearly defining task ownership
Calculate Communication Channels
Channels = n(n-1)/2
n = number of people on the project
Negative Risks
threats
Positive Risks
Opportunities
Firm Fixed Price
Price stated in the agreement does not change, regardless of any type of environmental change.
Fixed Price Incentive Fee
Fixed-price contract with bonuses for meeting goals
Fixed Price Economic Price Adjustment
provides for upward and downward revision of the stated contract price upon the occurrence of specified contingencies
Time and Material Contract
• Time and material contract when buyer pays for both labor and material
• Buyer takes all the risk of cost overrun for both the labor and materials
• Should only be used when scope is high level
5 Levels of Stakeholder Engagement
unaware, resistant, neutral, supportive, and leading