Normality of Distribution
1/8
There's no tags or description
Looks like no tags are added yet.
Name | Mastery | Learn | Test | Matching | Spaced |
|---|
No study sessions yet.
9 Terms
frequency table
method or organizing data by listing every possible value in first column of numbers and frequency of each value as second column
skewness
mean, median, and mode not equal
interferes with validity of many statistical analyses
positively skewed
largest portion of data is below mean
mean>median>mode
negatively skewed
largest portion of data is above the means
mean<median<mode
kurtosis
degree of peakedness of frequency
extreme kurtosis can affect validity of statistical analysis because scores have little variance

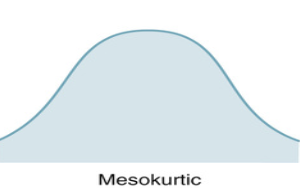
mesokurtic
kurtosis score of zero

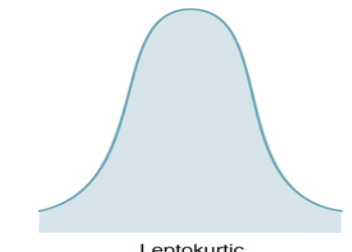
leptokurtic
kurtosis value above zero

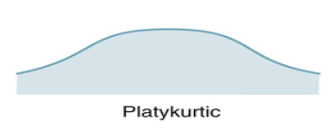
platykurtic
kurtosis value below zero that are negative
Shapiro-Wilk’s W test
formal test of normality that assesses whether a variable’s distribution is skewed and/or kurtotic
has ability to calculate both skewness and kurtosis by comparing shape of variables frequency distribution to that of a perfect normal curve