Research Methods in Psychology: Key Terms & Definitions
 Call Kai
 Learn
Learn Practice Test
 Spaced Repetition
 Match
Match Flashcards
 Knowt Play
1/70

There's no tags or description
Looks like no tags are added yet.
Name | Mastery | Learn | Test | Matching | Spaced | Call with Kai | Chat |
|---|
No analytics yet
Send a link to your students to track their progress
71 Terms
Cultural norms
the shared expectations and rules that guide behavior with a specific society.
Confirmation bias
a tendency to search for information that supports our preconceptions and to ignore or distort contradictory evidence.
Hindsight bias
the tendency to believe, after learning an outcome, that one would have foreseen it. This phenomenon could cause an individual to blame the victim in a crime.
Overconfidence
the tendency to be more confident than correct—to overestimate the accuracy of our beliefs and judgments. An example could be a person underestimated the amount of time it will take for them to solve a difficult puzzle.
Independent variables
The factor that is manipulated; the variable whose effect is being studied.
Confounding variables
A factor other than the factor being studied that might influence a study's results—a good experiment eliminates them.
Dependent variables
The outcome that is measured.
Random assignment
Each participant in an experiment has an equal chance of being placed into the control or experimental group(s). This process helps eliminate confounding variables.
Case study
One individual or group is studied in depth in the hope of revealing universal principles. The results may NOT generalize to the entire population.
Correlation
A measure of the relationship between two variables. It does NOT prove that one variable causes a change in another---it only shows that two variables are related.
Positive correlation
A correlation where as one variable increases, the other also increases, or as one decreases so does the other. Both variables move in the same direction. An example could be speeding and receiving traffic tickets.

Negative correlation
the relationship between two variables in which one variable increases as the other variable decreases. An example could be brushing your teeth and developing cavities.

Meta-analysis
a procedure for statistically combining the results of many different research studies.
Naturalistic observation
Observing and recording behavior in naturally occurring situations without trying to manipulate or control the situation.
Hypothesis
A proposed explanation made on the basis of limited evidence as a starting point for further investigation.
Falsifiable (hypothesis)
when asking questions, psychologists formulate inflexible predictions that can clearly be shown to be untrue with some observation.
Operational definition
a detailed description that defines a variable to such a degree that everyone collects data in the same way. It must be measurable. These help facilitate replication of a research study.
Replication
repeating the essence of a research study, usually with different participants in different situations, to see whether the basic finding can be reproduced.
Central tendency
a measure that represents the typical response or the behavior of a group as a whole (includes mean, median, and mode).
Variation
A measure used to describe the distribution of data (includes range and standard deviation).
Percentile rank
Percentage of scores falling at or below a specific score. For example, a person in the 90th percentile on a test scored as well as or better than 90% of test takers.
Mean
the arithmetic average of a distribution, obtained by adding the scores and then dividing by the number of scores.
Median
the middle score in a distribution; half the scores are above it and half are below it.
Mode
the most frequently occurring score(s) in a distribution. It would appear as the highest point on a frequency distribution.
Range
the difference between the highest and lowest scores in a distribution.
Normal curve
the symmetrical bell-shaped curve that describes the distribution of many physical and psychological attributes. Most scores fall near the average, and fewer and fewer scores lie near the extremes.

Wechsler Adult Intelligence Scale (WAIS)
Most widely used intelligence test today. It has a standard deviation of 15 and a mean/median/mode of 100. 68% of scorers earn between an 85 and 115. 95% of scorers earn between 70 and 130.
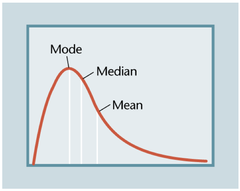
Positively-skewed distribution
A distribution in which scores pile up at the low end of the scale. An example could be an exam on which most students score poorly and a few score well---skewing the mean towards the higher scores.
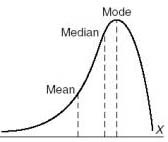
Negatively-skewed distribution
A distribution in which most scores pile up at the high end of the scale. An example could be an exam on which most students score well and a few score poorly---skewing the mean toward the lower scores.
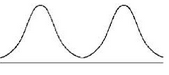
Bimodal distribution
a frequency distribution with two modes, which appear as two distinct peaks.
Standard deviation
a measure of variability that describes an average distance of every score from the mean; this measure can be used to show how consistent scores are.
Regression toward the mean
the tendency for extreme or unusual scores to fall back toward the average with repeated testing.
Sample
a subset of the population.
Population
The group being studied.
Representative sample
A sample that fairly reflects the characteristics of a population because each member of the population has an equal chance of being selected.
Random sampling
The key technique employed by researchers, which operates on the principle that every member of the population should have an equal chance of being selected for the sample.
Convenience sampling
a method of collecting samples by taking samples that are easily located around a location or Internet service. This method does NOT allow the results to be generalized to an entire population.
Generalizing
the ability to apply the findings of a particular research project to larger segments of society.
Experimental group
In an experiment, the group that is exposed to the treatment, that is, to one version of the independent variable.
Control group
In an experiment, the group that is not exposed to the treatment; it serves as a comparison for evaluating the effect of the treatment.
Placebo
an inert substance (like a fake pill)
Placebo effect
the phenomenon in which the expectations of the participants in a study can influence their behavior.
Single-blind study
Only the researcher knows if the participant is assigned to the control or experimental group—the participant is unware.
Double-blind study
Neither the researcher nor the participant knows if the participant is assigned to the control or experimental group—both are unaware.
Experimenter bias
A phenomenon that occurs when a researcher's expectations or preferences about the outcome of a study influence the results obtained.
Social desirability bias
The tendency of survey respondents to answer questions in a manner that will be viewed favorably by others.
Qualitative research
aims to gather and analyse non-numerical data in order to gain an understanding of individuals' social reality, including understanding their attitudes, beliefs, and motivation.
Structured interviews
interviews in which all applicants are asked the same set of standardized questions.
Self-report bias
systematic errors that can occur in self-report data because participants are unable or unwilling to answer accurately.
Wording effects
The effect that subtle changes in the words or order of words can have on a study participant--This can skew the results of a survey.
Quantitative research
Research that provides data that can be expressed with numbers, such as ranks or scales.
Likert scales
a rating scale used to measure survey participants' opinions, attitudes, motivations, and more. It uses a range of answer options ranging from one extreme attitude to another, sometimes including a moderate or neutral option. 4- to 7-point scales are the most popular.
Peer review
A process of subjecting an author's scholarly work, research, or ideas to the scrutiny of others who are experts in the same field.
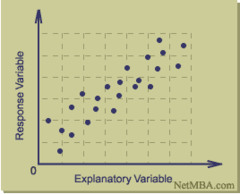
Scatterplot
a graphed cluster of dots, each of which represents the values of two variables; it can be used to show a correlation.
Correlation coefficient
a statistical measure of the extent to which two factors vary together, and thus of how well either factor predicts the other. A coefficient of 0 equals no correlation. +1 is a perfect positive correlation; -1 is a perfect negative correlation.
Effect sizes
a value measuring the strength of the relationship between two variables in a population. The most common way of quantifying and comparing outcomes across studies in meta-analytic reviews.
Statistical significance
a statistical statement of how likely it is that an obtained result occurred by chance. It is used to see if the differences betwen control and experimental group(s) occurred by chance.
P value
The probability of results of the experiment being attributed to chance. The p stands for probability. P values below 0.05 are statistically significant.
Directionality problem
a problem encountered in correlational studies; the researchers find a relationship between two variables, but they cannot determine which variable may have caused changes in the other variable.
Third-variable problem
a problem encountered in correlational studies; the researchers find a relationship between two variables, but that relationship is caused by a third, unidentified, factor.
Institutional review
federally-mandated, locally-administered groups charged with evaluating risks and benefits of human participant research at their institution.
Informed consent
an ethical principle that research participants be told enough to enable them to choose whether they wish to participate
Informed assent
Participant's agreement to participate in the absence of full understanding; commonly applies to individuals who have not attained legal majority and/or capacity.
Protection from harm
an ethical requirement for research participants to be protected from physical or psychological harm.
Confidentiality
an ethical requirement to hold information in confidence, not to be released to unauthorized individuals.
Deception
misleading or hidding the truth from study participants; must be justified by researchers and shown to be necessary in order to meet ethical guidelines.
Debriefing
an ethical requirement to give a post-experimental explanation of a study, including its purpose and any deceptions, to its participants
Non-experimental methodology
Research that lacks the manipulation of an independent variable. Researchers simply measure the variables as they naturally occur (in the lab or real world). It does NOT establish a causal relationship.
Experimental methodology
Experimental research studies involve the manipulation of one or more factors (termed "independent variables"), observation of the effects of these factors on some behavior (termed "dependent variables"), and control of other relevant factors.
Confederates
research actors who are commonly employed in psychology experiments to secretly participate along with actual subjects.
Illusory correlation
the perception of a relationship where none exists. For example, you may falsely believe that every time you wash your car, it rains.