stats + mechanics
1/27
There's no tags or description
Looks like no tags are added yet.
Name | Mastery | Learn | Test | Matching | Spaced | Call with Kai |
|---|
No analytics yet
Send a link to your students to track their progress
28 Terms
P (A / B)
P (A ∩ B) / P (B)
[P (B / A) x P (A)] / P (B)
P (A) , if independent
![<ul><li><p>P (A ∩ B) / P (B)</p></li><li><p>[P (B / A) x P (A)] / P (B)</p></li><li><p>P (A) , if independent </p></li></ul><p></p>](https://knowt-user-attachments.s3.amazonaws.com/20a4954c-be1a-4f90-8b71-cb16dcd0c9d4.png)
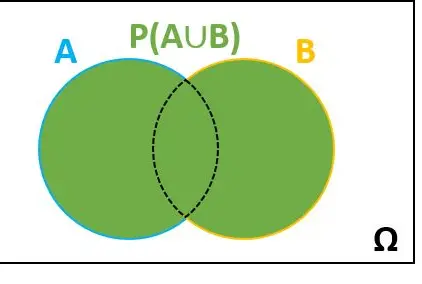
P (A ∪ B)
all of it
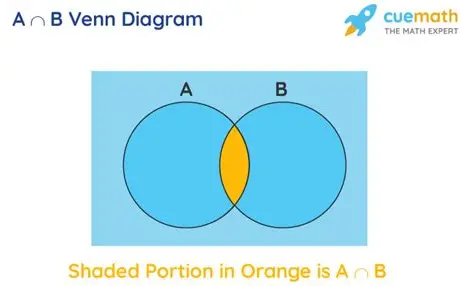
P (A ∩ B)
intersection
mutually exclusive
P (A ∩ B) = 0
independent
P (A) x P (B)
addition law
P (A ∪ B) = [P (A) + P (B)] - P (A ∩ B)
census
measures every member of a population
+ accurate result
- expensive, testing may destroy
sampling units
individuals of a population
sampling frame
list of sample units
random sampling
simple random sampling
equal change of being selected. uses a random number / lottery system
+ bias free
- needs sampling frame
systematic sampling
take every kth unit, where k = population / sample. pick a random number between 1 and k to start
+ quick to start
- needs sampling frame
stratified sampling
sample represents groups (strata) of a population. (sample / population) x strata for each strata, and picked randomly
+ reflects population
- population must be classified in strata
non random sampling
quota sampling
like stratified, but strata filled up by interviews / researcher
+ no sampling frame
- non random so potential bias
opportunity sampling
quota filled by who is available at the time
+ cheap and easy
- unlikely to be representative, researcher bias
types of data
qualitive - non numerical
quantitative - numerical
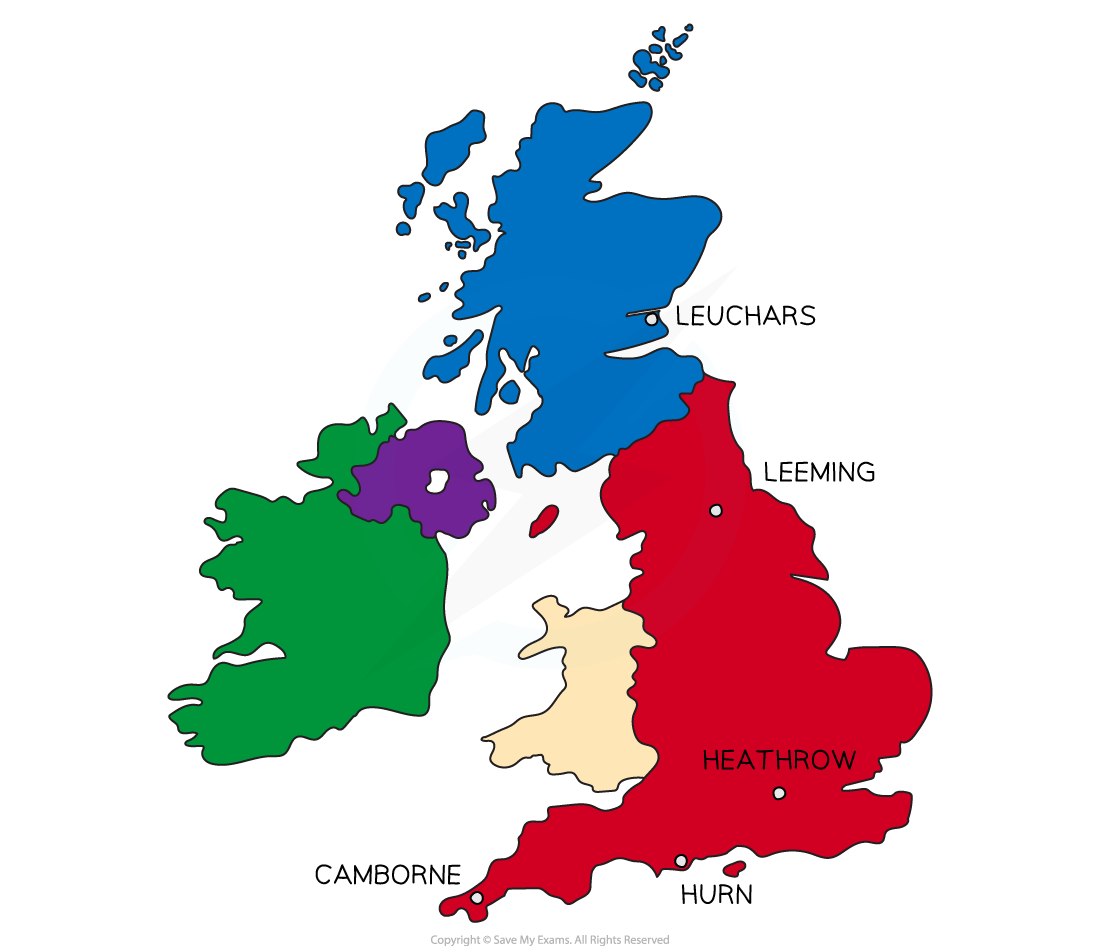
large data set - stations in UK
cambourne (coast, south)
hurn (coast, south)
heathrow (south)
leeming (north)
leuchars (coast, north)
coastal stations = windy, rainy
south = warmer, more hours in the day
recorded for 6 months only, may - october 1987 - 2015
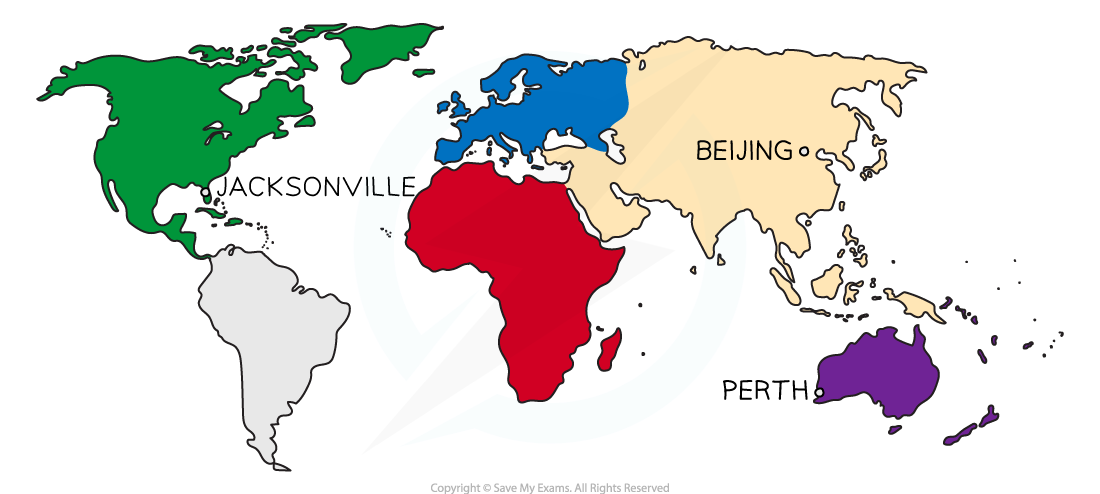
large data set - international stations
perth (australia)
southern hemisphere so seasons switched
very hot in summer
beijing (china)
really hot and rainy in summer
really cold in winter
jacksonville (florida, usa)
very warm
prone to hurricanes
large data set - data
rainfall
‘tr’ means trace, treat it as 0 in calculations
n/a
not available, so can’t be used in a sample
cloud cover
oktas, discrete values of 0 - 8. measures how many 1/8 of the sky is covered
max gust
knots, 1 kn = 1.15 mph
Σ
sum of
measures of location, learn how to do on calc come back
measure of central tendency
mean
-x = Σx / n
-x of grouped data = Σfx / Σf
mode
median
quartiles
for listed data -
Q1 = n / 4
Q2 = n / 2
Q3 = 3n / 4
where n is the number of sampling units
if a decimal, round up
if whole, find midpoint with next number
for grouped data -
Q1 = n / 4
Q2 = n / 2
Q3 = 3n / 4
percentiles , e.g., 57th = 0.57 x n
deciles , 10% chunks , e.g., D3 = P30 = 0.3 x n
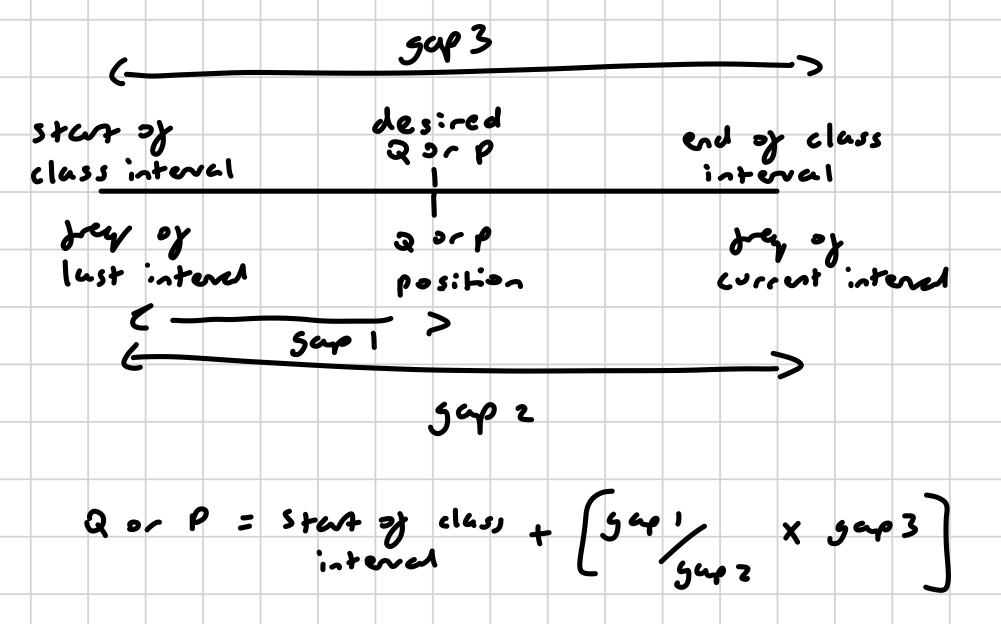
do not round. use linear interpolation
linear interpolation
for grouped data
cumulative frequency for quartiles or percentiles
find the class interval
measures of spread learn how to do on calc come baxj
interquartile range
IQR = Q3 - Q1
+ ignores extremes
interpercentile range
IPR = Pn2 - Pn1
variance
σ2 = Σ (x - x-)2 / n
or, the mean of the squares [(sum of x2) / n] - square of the mean [x-2]
if it’s frequency data, then σ2 = [(sum of fx2) / total frequency] - [fx-2] where fx is data class x frequency. midpoints if continuous
on calc, stats, put into list, calc, 1 var
standard deviation
how much data scatters around the mean on average
root of the sum of the squared deviations divided by number of values
σ = _/ (1 / n) x (x1 - x-)2 +(x2 - x-)2 + … + (xn - x-)2
negative if below the mean, positive if above the mean
square root of variance equation
coding
if y = ax + b,
then always y- = ax- + b
representations of data
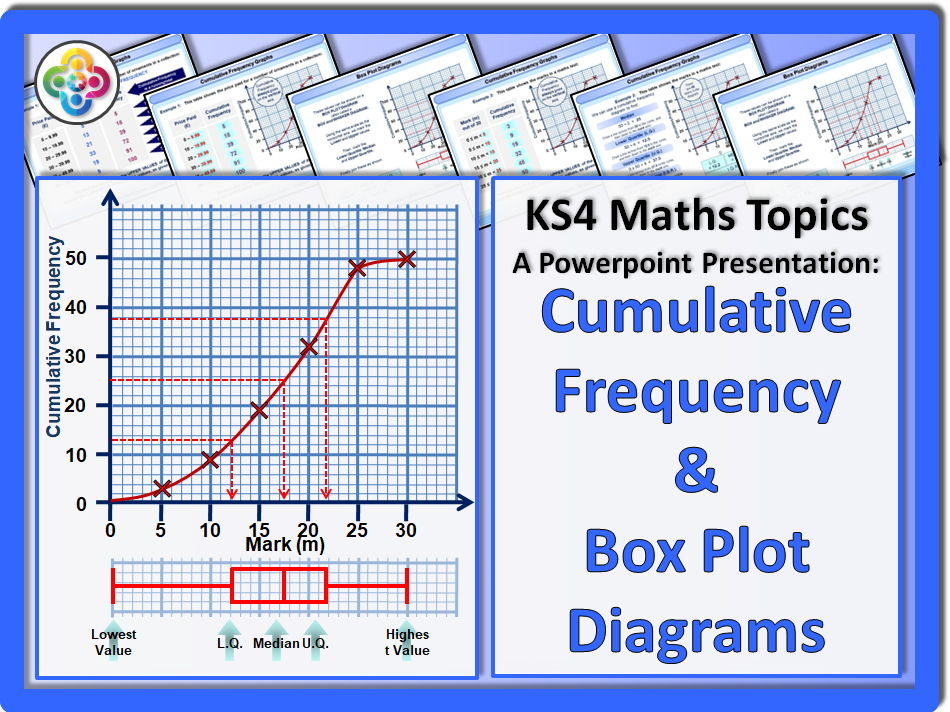
cumulative frequency
mark the quartiles on the y-axis and find the corresponding value on the x-axis
box plots
median, LQ, UQ, highest and lowest values, and outliers marked
can be used to compare location and spread of different data sets
can be made from a cumulative frequency graph
histograms
for continuous data
no gaps
frequency density = freq / class width
area = freq x k
compare = 1 measure of location, 1 measure of spread
regression and correlation
product moment correlation coefficient (PMCC)
-1 ≤ r ≤ 1
measures strength and + / - of correlation
regression line
line of best fit, y = a + b x
a = y when x = 0
b = how much y changes when x increases by 1
interpolation = estimating inside the data range
more reliable
extrapolation = estimating outside the data range
not reliable
if y = abx , exponential
log y = log a + x log b
y = c + m x
(m = log b, x = x)
if y = axn , polynomial
log y = log a + n log x
y = c + m x
(m = n, x = log x)
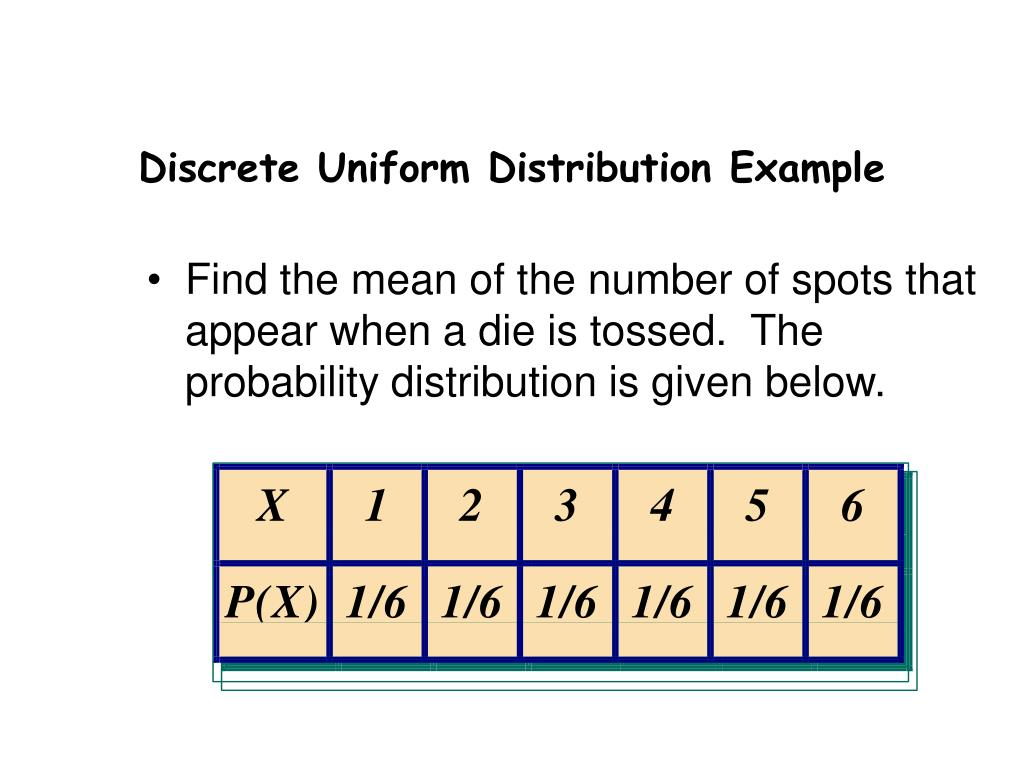
discrete uniform distribution
probabilities of outcomes are all equal
mean is in the middle, and is the same as the median, = (a + b) / 2
all value add up to 1
standard deviation = _/ (b - a)2 / 12
probability questions usually finding an interval. all probability the same, so find as ratio (d - c) / (b - a)
hypothesis testing
binomial distribution
normal distribution
outliers
> Q3 + k IQR
< Q1 - k IQR
measures of central tendency on grouped data
mean
midpoints of class
[sum of midpoints x frequency of class] / total frequency
median
total frequency (n) / 2
cumulative frequency to find which class the n / 2 is in
linear interpolation
mode
class with the highest frequency