PUBH 475 Week 13 – Relational (inferential) statistics Lectures
1/17
Earn XP
Description and Tags
Vocabulary flashcards related to inferential statistics.
Name | Mastery | Learn | Test | Matching | Spaced |
|---|
No study sessions yet.
18 Terms
Inferential Statistics
Explore relationships between at least two variables to test your hypothesis, work with a subset (sample) to generalize about the population; examples include t-tests, ANOVA, Chi-square, and correlation.
Null Hypothesis (H0)
There is no difference between variables or groups; mathematically, the correlation and mean equals zero. No difference or relationship H0: M1=M2 or H0: M1-M2=0 No correlation: H0: rxy=0
Alternative Hypothesis (H1)
There is a relationship or difference between variables or groups; can be nondirectional, directional, or correlative. difference or relationships; H1: M1=/M2, M1-M2=0, Correlation: H1: rxy=/0
Scoring
The sum or mean score of all variables in a scale; may require reverse coding to ensure all variables are in the same direction; sums are used for inferential statistics instead of the individual questions. Turns to continuous variable
Revised 3 Levels of Measurement for Inferential Statistics
Nominal (categorical), ordinal (if <5, then categorical if >6, then continuous, and interval/ratio (continuous)
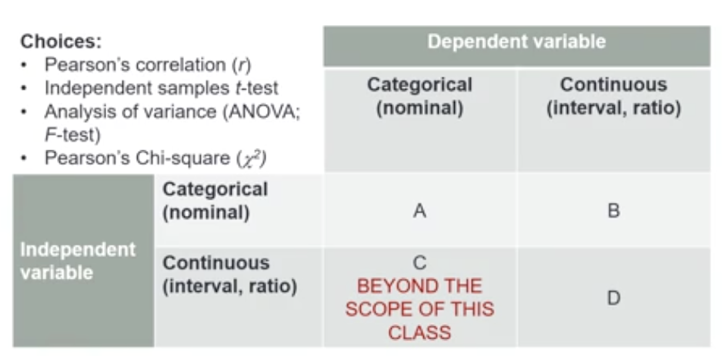
Inferential Statistic to run for a Categorical IV and a Categorical DV
Pearson’s Chi-square
Inferential Statistic to run for a Continuous IV and a Continuous DV
Pearson’s Correlation
Inferential Statistic to run for a 2-Level Categorical IV and a Continuous DV
Independent Samples T-test
Inferential Statistic for a 3 or More Categorical Level IV and a Continuous DV
ANOVA
Pearson’s Correlation Procedure
Examines the relationship between two continuous variables; test statistic is Pearson’s correlation coefficient (r); focuses on statistical significance, direction (positive or negative), and magnitude (0 to +- 1).
Independent Samples T-Test Procedure
Compares two categorical groups (IV) on a continuous dependent variable; test statistic is t; other t-tests include one sample and paired/dependent.
Analysis of Variance (ANOVA) or F-Test Procedure
Compares three or more categorical groups (IV) on a continuous dependent variable; test statistic is F; other F-tests include one sample and repeated measures.
Pearson’s Chi-Square Procedure
Examines the relationship between two nominal (categorical) variables; test statistic is x^2.
P-value
Probability value or level obtained in a test of significance; ranges from 0 (0%) to 1 (100%); used to determine whether to reject the null hypothesis; commonly used significance level is .05.
Procedure for Determining Significance
Run the test, examine the associated p-value, and make a decision to reject or fail to reject the null hypothesis; if p < .05, reject H0 and accept H1; if p >= .05, fail to reject H0; p between .05 and .10 indicates a trend towards significance.
Nominal Measurement
The weakest level of measurement, limiting the types of statistics that can be run.
Interval and Ratio Measurement
The strongest level of measurement, ranging from negative infinity to positive infinity, allowing several types of statistics to be run.
To determine which test to use we need to know the level of measurement for ?
Independent, Dependent, and each demographic variable