Water: cycle and sustainability issues
1/55
There's no tags or description
Looks like no tags are added yet.
Name | Mastery | Learn | Test | Matching | Spaced |
|---|
No study sessions yet.
56 Terms
What is water?
The only natural substance that can be found
on Earth in all three states
solid, liquid, and gas
water most dense at 4c
Key processes: from air to water Evaporation
Liquid → vapor, driven by solar radiation providing
energy for state change.
• Oceans dominate (86% of global evaporation).
50 - 85 % of O2 produced in oceans and
freshwaters
Oceans influence and regulate world
climate and weather – most rainfall
comes from oceans
• Sensitive to temperature, wind, and humidity
gradients
Key processes: from air to water Transpiration
Plants release water vapor via stomata.
Transpiration involves biological processes within plants, such as water uptake, storage and stomatal control
Sensitive to type of plant, temperature, wind, and humidity gradients.
Evapotranspiration = evaporation +transpiration, linking the biosphere to the atmosphere
Key processes: from air to water Sublimation
Direct solid ice → vapor transition
no liquid intermediate phase
important in cryosphere
Sensitive to atmospheric pressure and
humidity.
Example: freeze-drying techniques and dry ice mist
Deposition: Direct vapor → solid ice transition
Key processes: from air to water Condensation
Water vapor → liquid droplets or ice crystals in the atmosphere.
rain
Loss of energy: “warm” humid air meets “cold” air / surfaces →molecules slow down, and attraction becomes stronger.
aerosols up in the air where drops can latch onto
we want to have fewer aerosols
Forms clouds, dependent on temperature, pressure, and aerosols(cloud condensation nuclei).
Key processes: from air to water Precipitation
Rain, snow, sleet, hail.
Transfers water from atmosphere to land and ocean.
Most (~78%) fall over the oceans
Precipitation rates vary geographically and over time
Key processes: water on the ground
Infiltration & Percolation
Water enters soil, replenishes groundwater.
Controlled by soil texture, vegetation, land use.
Runoff
Surface flow of water back to rivers, lakes, oceans.
Major driver of sediment and nutrient transport.
Subsurface Flow
Groundwater flow through aquifers, much slower than surface water.
Residence times: days (shallow aquifers) to millennia
(deep aquifers)
Global Water-Cycle
The water cycle is the continuous
movement of water within the Earth System, linking the atmosphere, hydrosphere, lithosphere, and biosphere.
It is a closed system globally (no significant input or output of water to space),
but it contains many open subsystems where fluxes and
residence times differ.
SA can export rain water
Energy and feedbacks
Solar radiation drives evaporation and transpiration.
Condensation and evaporation processes regulate climate
through latent heat fluxes by release/absorption of heat.
What happens when we add more heat?
warming → more evaporation → more water vapor and
energy → amplifies warming through positive feedback →more rain and more extreme weather events.
speed up and intensify the cycle
But also, clouds can cool (by reflecting solar radiation) or
warm (by trapping longwave radiation)
Diversity of aquatic systems
Wide variety of morphology and connectedness in aquatic systems
These define characteristics, functions, processes and biota
Some characteristics:
• Latitude: tropical to polar
• Salinity: fresh – brackish - marine
• Flow: velocity and stagnation
• Size and depth
Nutrient richness
• Altitude
• Connectedness
latitude
explains ocean currents
Horizontal currents
mainly friction between water and wind
Earth rotation and Coriolis forc
Vertical ocean currents
Upwellings and downwellings
caused by density differences through
temperature and salinity
Thermohaline circulation driven by cold, salty
water sinking at the poles
continuous, slow-moving "conveyor belt" →
circulates water and heat throughout the world's
oceans, influencing global climate patterns and
sea levels
Salinity
Freshwater <1 % salinity
Marine water ~ 3.5 % salinity 22
Groundwater is saline in many places (also NL)
Landlocked lakes among the most saline environments e.g. Don Juan Pond 40.2% and Lake Assal 34.5%
Water column is not homogeneous
Sunlight travels to ~1000m deep
Light extinction depends on water clarity – aphotic zone = < 1 % sunlight
creates zonation for biota
= depth makes a big different in biota and biochem
Not only light changes with depth:
• temperature
• pressure
• oxygen
• macronutrients
• micronutrients
• associated biota
Lake zonation
Ecology:
Limnetic / pelagic: open water
Littoral: near the shore
Benthic: bottom of lake
Light: Euphotic vs aphotic
the first layer is warm and bottom is cold
Velocity
Lentic = slow moving water
- e.g., ponds, pools, lakes
Lotic = faster moving water
- e.g., streams, rivers
Wetlands = soil is saturated or
inundated at least part of the time
- e.g., marshes, swamps, intertidals, floodplains, bogs, …
Lakes and Rivers
Standing water (more or less)
Freshwater storage
More time for chemical and ecological interactions
Flowing water
Freshwater transport
Stronger geological influence
Rivers
Cover ca 0.6% of land surface
• Flow from high lands to lowlands
• Mostly fed by run-off and melt water
• Collect all water from the catchment
• Transport water to lakes and oceans
• Transport matter and organism
Headwaters:
- Lowest flow, erosion > deposition
Transfer zone:
- Flatter slope, more flow, erosionand deposition important processes
•Deposition zone:
- Highest flow, slope minimal,deposition > erosion
Flow = the volume of water moving
past a particular point during a
given time period
Lakes
• Account for ~ 3 % of Earth’s surface
vary from ephemeral ponds to permanent waterbodies
Lakes formed by:
• geological processes,
• movement of glaciers,
• rivers,
• human activities e.g.
reservoirs.
Primary succession
Lakes and ponds slowly turn into land
Biomass dies off / settles -> generating
nutrients and sediments.
Shallower systems allow for establishment of
submerged vegetation
Subsequently larger plants and animal
communities can grow
Secondary succession
Secondary succession happen when a previously established ecosystem recovers from a (natural) “disaster”.
The biodiversity of surrounding ecosystems plays a role in how fast this recovery happens
Wetlands
Cover ~ 6-7 % of land surface
• Peatlands, mangroves, seagrass
beds…
• Large water-sediment interaction
areas, hence important for carbon
and nutrient cycles
the water is not moving or standing its both
lot of potential for biochem to happen
High productivity:
- Support high concentrations of animals, provide nurseries
- Support cultivation of e.g. rice
Ecosystem services
- water filtration, storm protection, flood control and recreation.
Carbon sinks
if it takes up cos and stores it
- Store ca 30% of all land-based carbon
- As long as you keep them wet…
• Carbon source
- When drained -> carbon sources
Large-scale peatland restoration
Restoration effort
~ 50 % wetland surface lost since the 1900s
EU Nature Restoration Law
aims to rewet 15% of peatland areas. “Given their
importance, rewetting peatlands is important to
reach a number of EU objectives, including the
climate neutrality and biodiversity targets, as well
as goals of the Water Framework Directive”
LIFE PEAT RESTORE : restoring peatlands – sequester carbon
project area = one of the global emission Hot Spots, where the
potential to save greenhouse gas emissions is exceptionally hi
Last but not least: Groundwater
depends on how high groundwater is for the landscape
Groundwater ca 30 % of all freshwater
Groundwater levels help to dictate types of freshwater
ecosystems (e.g., marshes
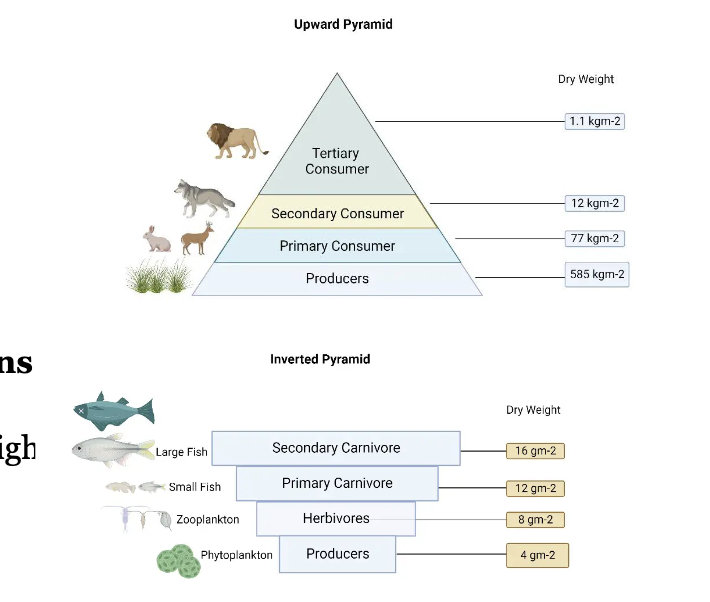
Biomass pyramid
Snapshot of the standing biomassper trophic level often given as dry- weight
often inverted in lakes and oceans
-> low standing primary producer biomass in the water column, but high production
healthy waters are not green

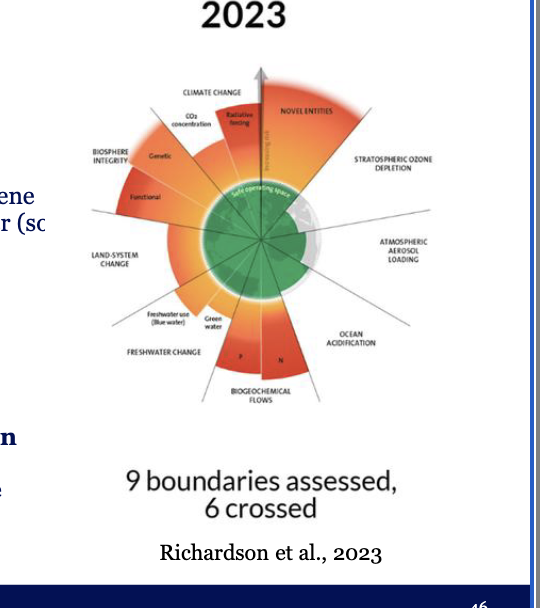
Freshwater change planetary boundary
water availability and quality are critical for ecosystems, agriculture, and human survival.
Original 2009 Approach
Focus: Global freshwater use (blue water = rivers, lakes,
groundwater) for consumptive use.
withdraw too much, ecosystems collapse and downstream users lose water
PB and sustainability issues
But this was criticized as freshwater resources and uses are highly regional and seasonal
2023 Refinement
• Freshwater change is now assessed by first establishing the Holocene baseline of blue water (lakes, rivers, groundwater) and green water (soil moisture from precipitation)
looks at original but also the indirect use like soil measure rather then rain fed water
Boundaries set:
- 4,000 km³/year of blue water use
- percentage of land where root-zone soil moisture deviates from baseline
variability
• Both blue water (groundwater depletion, river drying) and green water (soil moisture stress) are under pressure, indicated by the widespread increase in both abnormally dry and wet soil moisture conditions globally

Green water boundary
new boundary so why choose it?
considers the water cycle's terrestrial components: precipitation, evaporation, and soil moisture.
takes into account the role of water, especially soil moisture, in
- the resilience of the biosphere,
- securing terrestrial carbon sinks
- regulating atmospheric circulation
Link to deforestation
Link to deforestation
More tree cover leads to more transpiration
• More transpiration to more rainfall
• More rainfall + tree protection –> higher soil moisture
• Self-reinforcing feedback
vs:
Loss of tree cover and replacement by short vegetation
Less transpiration and drier soils
More difficult for trees to recover
Also a self-reinforcing feedback
-> see regime shifts a little late
= Deforestation effects
several regions of the Amazon will
be transformed into savannah and hard to bring the rainforest back
Stabilizing vs amplifying feedbacks
how cna we generalize whats happenign in the amazon?
Understanding these green water feedback
processes allows generalizing insights to other
systems,
• Characterising them by
• stabilizing (minus sign) or
• amplifying (plus sign) feedbacks
• green water-related changes in the Earth system are amplifying rather (more warming ) than stabilizing.
• Can lead to runaway change
Alternative stable states
Alternative stable states:
Complex systems that can occur in two or more internally stabilized states given the same external conditions
produces a:
Regime shift:
a sudden and fundamental shift in the structure, function, and feedback mechanisms of a system caused by passing a tipping point
hard to predict
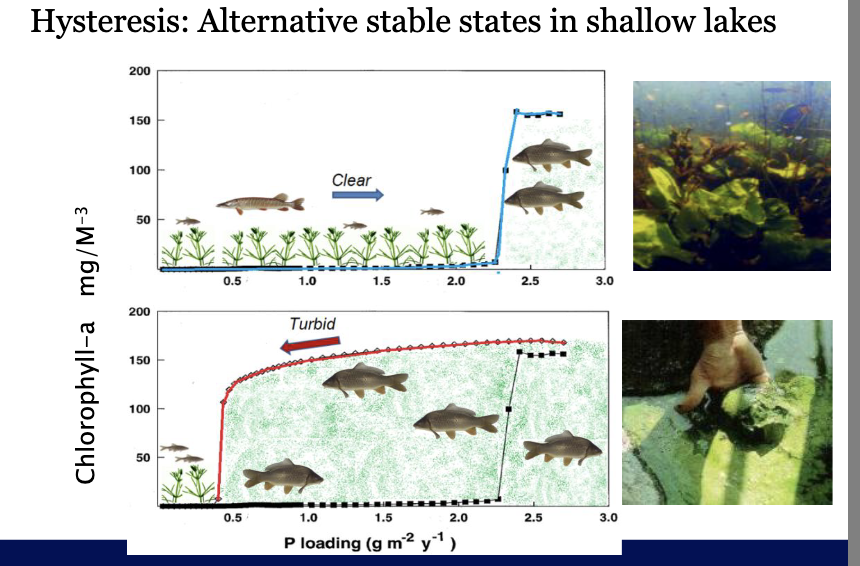
Regime shift in lakes
Regime shift: big, often sudden change in the
structure and function of an ecosystem despite
only incremental changes in drivers.
Classic example: clear and turbid lakes due to
phosphorus eutrophication and reoligotrophication
Characteristic of regime shifts:
Once it flips, it’s often hard to reverse because of
internal stabilizing feedback loops
Eutrophication regime shif
Clear state
• Macrophytes stabilise clear state through sediment
stabilisation, providing shelter for zooplankton.
• Piscivore fish control population of planktivore fish
Hysteresis: Alternative stable states in shallow lake
Turbid state
• Phytoplankton stabilise turbidstate through shading,changes in fish community(no visual predators).
• Dominance of benthic feeding fish prevent sediment stabilisation
takes alot of work and fertilizer to get back to how the lake was before

Alternative stable states
Complex systems have stabilizing feedback
cycles-> initially absorb stress without showing signs
of degradation
Hard to predict and to reverse
Why hard to predict?
• Due to internal feedbacks no easily visible
changes in ecosystem functions despite changing
nutrient concentrations.
Why Hard to Reverse?
Even if nutrient input is reduced, algae dominate because plants are gone.
Fish communities and food webs have shifted.
Restoration often requires major interventions
(dredging, fish removal, re-planting vegetation)
Apply knowledge: Alternative stable state
As a water manager, how can you use this concept
you could look at coagulants that take out the plankton
look at the inflow and sediment nutrition, dredging, p fixation reduction
look at biomanipulation
Ecosystem Services
To provide services reliably, systems need to be
resilient and resistant
Link to ecosystem services freshwater
What ecosystem services do you connect with water?
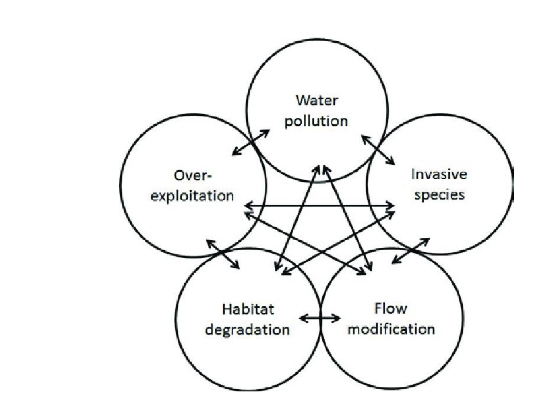
Human influences on freshwater
Aquatic systems are under multiple and often
interacting stresses
Rivers and lakes as sentinel
Rivers and lakes integrate all changes in
the catchment
- sentinels of global change
- sentinels of land use change
Observed effects in lakes and rivers
- Combination of external and internal
processes
- Explains the amount of research on lakes
despite their small landcove
Freshwater systems biodiversity hotspot
Freshwater habitats are extremely diverse per unit
habitat volume on Earth Freshwater ecosystems cover
less than 1% of Earth's surface yet are home to at least
140,000 specialist freshwater species i.e. 10% of Earth's
species.
Disproportionate diversity
loss
Major threats to aquatic system

Major threats to aquatic systems
dams
Marine sustainability issue
acidification , noise, habitat loss etc
Invasive species
Invasive species
Substantial variation in the spatial patterns of invasion
Main recipients: Global North, newly industrialized countries and small tropical island
Sources: South Americas and Eurasia
39% were introduced only intentionally
26% only unintentionally,
22% both intentionally and unintentionally dominant pathway for species invasions: horticulture and the nursery trade
example: invasive macrophytes
What is actually water quality?
Chemical (novel entities of concern, like chemical) and ecological status (species and biomass)
Water quality Water framework directive
looks at main rivers rather than small water bodies
the majority in the NL is small water bodies
Ecological Quality Small Waterbodies
citizen science campaign
we look across all water bodies, if 1 is bad they all score bad
only 4% were in good condition
Overharvesting: Water abstraction Lake Ara
unsustainable cotton cultivation and little rainfall
Water abstraction
Sinking of land due to groundwater abstraction
inking of land due to drying and decomposing peat
loosing heigh off the land
Bending the curve
1.Let rivers flow more naturally;
2.Improve water quality in freshwater
ecosystems;
3.Protect and restore critical habitats;
4.End overfishing and unsustainable sand
mining in rivers and lakes;
5.Prevent and control invasions by non-
native species; and
6.Protect free-flowing rivers and remove
obsolete dams
Threats to aquatic ecosystems
Habitat loss, fragmentation or degradation: e.g. dams and
reservoirs, urbanisation
Invasive species or diseases
Pollution: Eutrophication and other chemicals
Climate change: e.g. warming, changes in precipitation patterns
Overexploitation: Water withdrawal / overharvesting
water quality and quantity
If water is scarce, then you don’t worry about quality
But that has costs
Water Sustainability Issues: too much, too little, too dirty
Drinking water scarcity: quantity and quality
Drinking water scarcity occurs even in areas where there is plenty of rainfall and freshwater ->
physical and economical scarcity
Water scarcity affects 1 in 3 people on everycontinent of the globe
Almost 1/5th of the world’s population
(approx. 1.2 billion) live in areas where water isphysically scarce
More than 10% of people worldwide consume foods irrigated by wastewater that contain chemicals or disease-causing organisms
ex Kombolcha: Industrialising city, N.Ethiopia
Textile, pH (compliant)
steel works (Zn)
Brewery
(organics and
nutrients)
The Kuznets Curve – maybe, but much debated
species richness
per capita income
diversity is higher when people are poor
but ppl are rich enough and at one point care
Water footprint
Shows extent of water use in relation to human consumption
Expressed as water volume consumed and / or polluted (so quality only indirectly shown)
Calculated on various user levels (individual to global, private to corporate), processes and / or products and services
Types of Water Footprints
Blue water footprint
Consumption of surface water and groundwater
Examples: Irrigation from rivers or aquifers, water
for industrial processes, household tap water.
Case: Growing irrigated crops like rice in dry
regions → large blue water footprint
Green water footprint
Use of rainwater stored in the soil (moisture
available to plants).
Examples: Rainfed agriculture, forestry,
pastureland.
Case: Growing wheat in temperate regions with
rainfall → mostly a green water footprint
Grey water footprint
The amount of freshwater required to dilute
pollutants to meet water quality standards.
Examples: Runoff of fertilizers and pesticides
from fields, wastewater from factories or
households.
Case: Cotton farming → large grey footprint
because of pesticide and fertilizer runof
Global Human Water Footprint
Freshwater use
Nearly 8-fold increase from 1900-2010
World population
Nearly 8-fold increase from 1820-2019
most water is used for irrigation and livestock
industry uses it for dilution, steam, washing and cooling
top food products water use
beef, nuts, sheep/goats
freshwater exports
“virtual water”
domestic freshwater use
134 liters
Some critiques to take along
Oversimplification by providing one volumetric
number -> local overconsumption can not be
traded to another region.
Renewal rates differ regionally and by type
Grey water footprint lacks solid scientific
underpinnin
Solutions to freshwater sustainability
Solutions to the Freshwater Crisis:
- Bending the curve
- Efficiency in irrigation and industry
Sugarcane Upper Egypt
Traditionally irrigation is to flood it
water evaporates instead of sugarcane absorbing it
drip system helped reduce water evaporation and plants soaked it up
Precision farming sounds promising
- Lower input waste
- Increase yield
- Increase efficiency (time, expenditure,
resources)
But also has common challenges
- Upfront investment
- Adaptability and willingness to learn
- Compatibility and connectivity
- Sustainable diets (less water-intensive foods)
- Pollution control and grey water recycling
- Governance & transboundary cooperation
Today’s concepts
Water cycle components and key processes
stages
Some of the huge diversity in waterbodies and a few of their functions
HIPCO, but then in water
Regime shifts: concept and how it helps understand unexpected outcomes in complex systems
Some consequences of human alterations to water
And water foot printing across different sectors
a]