Unit 7 - Correlational Research SN
1/53
There's no tags or description
Looks like no tags are added yet.
Name | Mastery | Learn | Test | Matching | Spaced |
|---|
No study sessions yet.
54 Terms
another way of saying dependent variables
criterion variable
another way of saying independent variables
predictor variables
what is line of best fit?
A line drawn through the points on a scatterplot to reflect the general pattern in graph
correlation analysis
direction and strength of relationship between 2 variables
direct or positive relationship
the relationship that exists when the values of related variables move in the same direction
indirect or negative relationship
a relationship when one variable increases while the other variable decreases
what does correlation analysis indicate?
- the relative degree of consistency
- the variability in Y scores paired with X scores
regression anlaysis
- how closely the scatterplot fits the regression line (line of best fit)
- the relative accuracy of a prediction
outliers
numbers that are much greater or much less than the other numbers in the set (large vertical deviation)
leverage point
a point in a system in which a small change can yield large results (pulls the line of best fit into that point)
Pearson product-moment correlation (r)
determines the strength of a linear relationship between 2 variables
what is the range of values for the predictive relationship between two variables?
- ranges from -1.0 to 1.0
- the greater the r, the more "predictive" the relationship
what does the sign of the correlation coefficient determine?
negative or positive value for r determines the direction and strength of the relationship
can a high correlation coefficient between two variables prove causation?
a high correlation does not prove causation, nor does a low correlation eliminate causation
what concept does PPMC relies on?
relies on the concept of co-variance (how the x & y scores vary together)
general guideline of correlation relationship strength for psychology & sociology
0.00 - 0.10 = weak
0.11 = 0.30 = moderate
greater than 0.30 = strong
what is the ideal r-value in general?
greater than 0.70
what is the coefficient of determination?
r^2 more than equal to 0.49
3 types of non-linear relationships
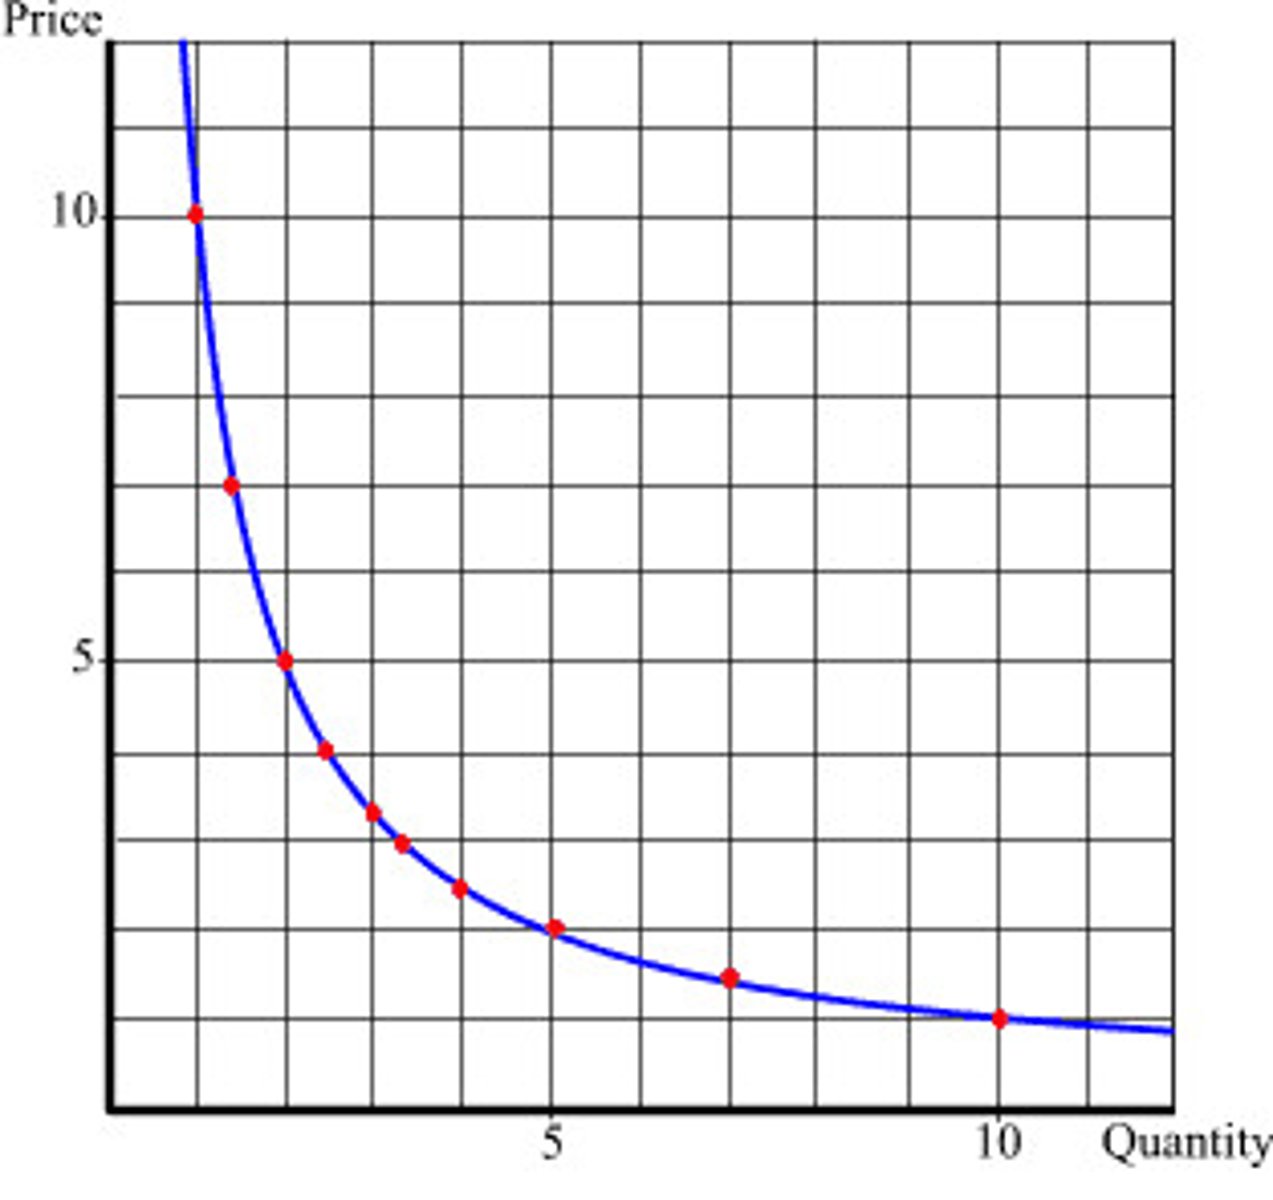
- inverse relationship
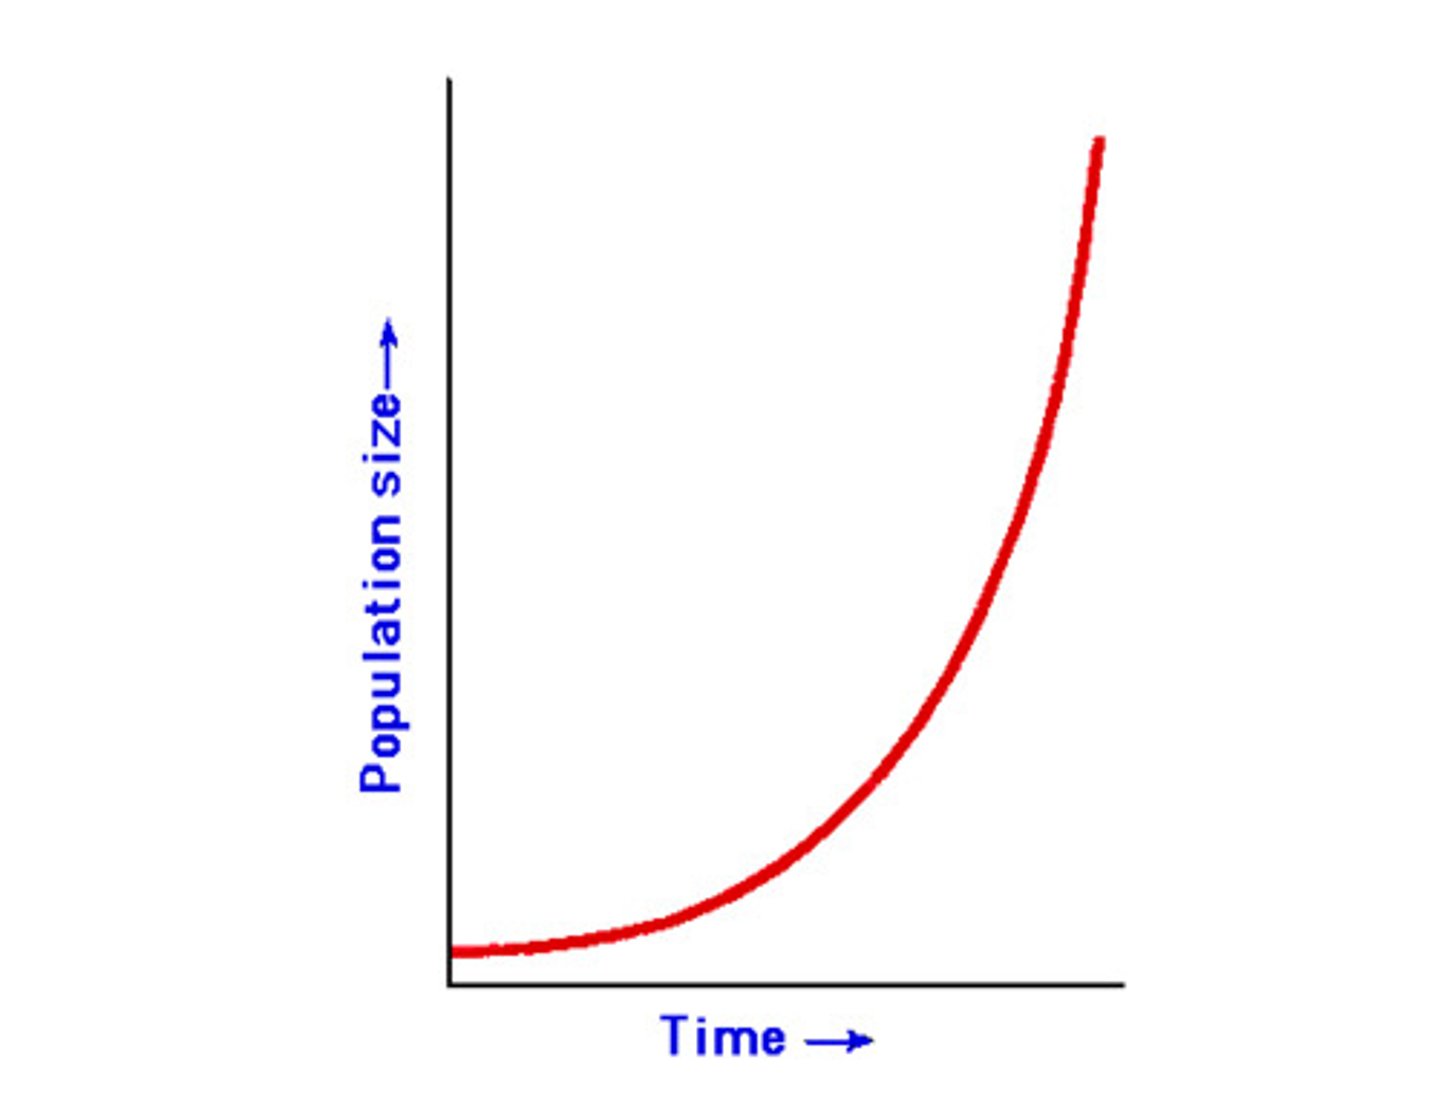
- direct relationship
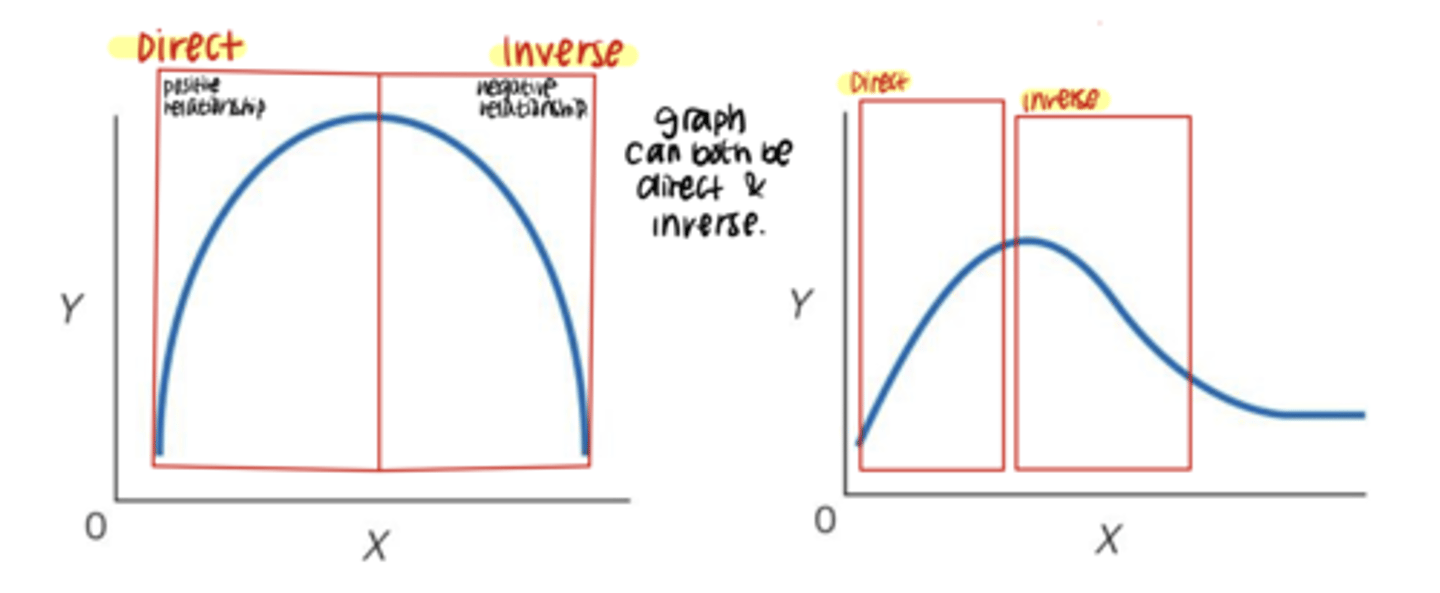
- direct & inverse relationship
Inverse nonlinear relationship
value of the y variable decrease as the value of the x variable increases
- small changes in a predictor variable (x) is related to wider ranges of variability along the y-axis
direct nonlinear relationship
as the x variable value increase, so does the value of the criterion variable
- magnitude of that relationship varies depending upon the region of x-variables
direct & inverse relationship
graph that starts at direct relationship to inverse relationship
what is X in the PPMCC
X = predictor variable (independent)
what is the Y in PPMCC
y = criterion variable (dependent)
what is the N in PPMC
total number of participants (or score)... XY pairs
limitation of PPMC
- if the range is low (low variability and distribution of score to too close to average), it is hard to detect a relationship
- does not explain cause and effect (it could be coincidental occurrence)
- extreme data points (outliers) can impact large effect
- relationship could be present but not evidence because it's not a linear relationship (PPMC only assumes linear relationship)
coefficient of determination
- main statistic used in regression analysis
- measures the proportion of the total variation in one variable that can be explained by the variation in the other variable.
- e.g if you are trying to predict a person's weight based on their height, R-squared would tell you how much of the variability in weight can be explained by the variability in height.
symbol for coefficient of determination
r^2
what happens with raw score in coefficient of determination?
raw score will deviate vertically (i.e on the scatterplot) from the regression line
what is the ^Y in linear regression?
^Y = predicted Y value (value along the line of best fit)

what is the X measured in linear aggression
X = measured X value (value that you put in the equation to predict outcome along the y-axis)
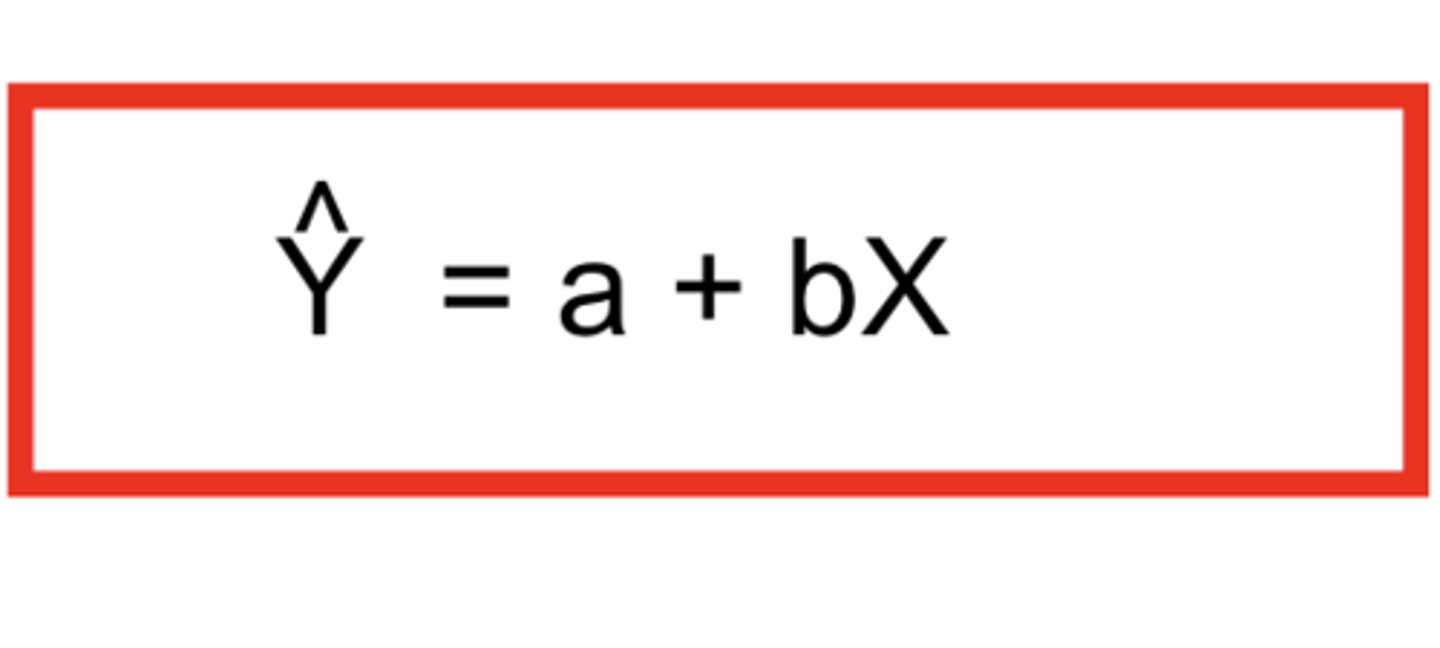
what is the a in linear regression?
a = Y intercept when X = 0
- y value when regression line hits the y-axis

what is the b in linear regression?
the slope of the regression line
- can measure the rate of change of y-variable
- can be positive or negative
- determine for inverse or direct relationship

what is r in linear regression
r = PPMC value

what is the Sy in linear of regression
standard deviation of Y (criterion/dependent)
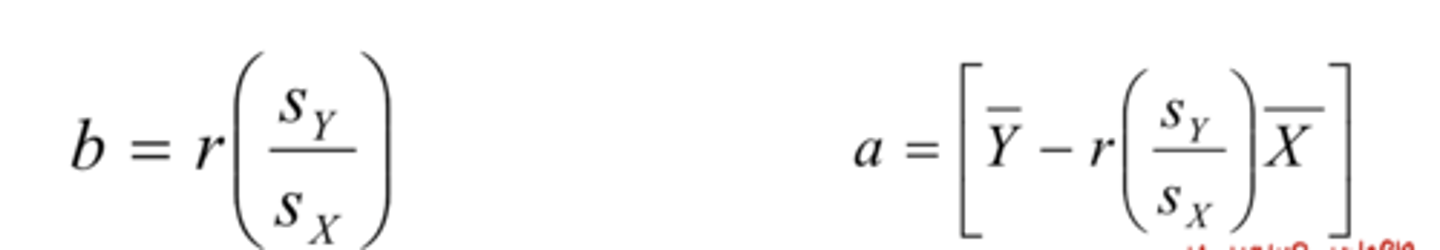
what is the Sx in linear regression
standard deviation of X (predictor/independent)

what is roof Y in linear regression
mean of y

what is roof X in linear regression
mean of x

residual
measures the difference between actual score and the score predicted by the line of best fit
standard error of the estimate
a one value number that provides us with an indication of how far we can expect the prediction to vary from actual value
covid-19
respiratory disease caused by a virus called SARS-CoV-2
SARS CoV-2
severe acute respiratory syndrome coronavirus 2
what was used to address the question of whether covid-19 vaccination worked?
- RCT (Randomized control trial)
- Examine historical data
randomized control trial
- establish "cause and effect" (required for government drug approval)
- the gold standard in research design intervention in the present day
- study volunteers randomly assigned to drug vs placebo groups
- volunteers followed up for months
- efficacy (how effective the study is)
benefit of correlational studies
can assist our understanding of human disease if use to analyse historical data
examining historical data
- not cause & effect
- examines effects of previous outcome
- past predicting future approach
does covid-19 vaccination work?
- yes
- units were new infections per vaccination rate
- correlation of 0.214 (weak to moderate correlation)
- has a positive direction relationship
- positive slop suggests that those countries with a HIGH vac rate predict a greater case count over the previous 28 days period
hypothesis testing
if there is statistically significant relationship between 2 variables
statistical (null) hypothesis
states that there is no relationship between the independent and dependent variables
alternative hypothesis
The hypothesis that states there is a difference between two or more sets of data.
non-directional hypothesis
open to the possibilities that relationship could be positive or negative
degrees of freedom
df - n-2
critical value
The dividing point between the region where the null hypothesis is rejected and the region where it is not rejected.
what indicates that the result of hypothesis is statisically significant?
r observed value is greater than or equal to r critical value