IB Economics - 2.1 - 2.4
1/49
There's no tags or description
Looks like no tags are added yet.
Name | Mastery | Learn | Test | Matching | Spaced | Call with Kai |
|---|
No analytics yet
Send a link to your students to track their progress
50 Terms
Market
A place where buyers and sellers meet and exchange different goods and services.
Demand
The willingness and ability of an individual to buy goods and services at different price levels.
Law Of Demand
The quantity demanded of a good or service is inversely proportional to its price, ceteris paribus.
Market Demand
The sum total of all the individual demands of the consumers in the market.
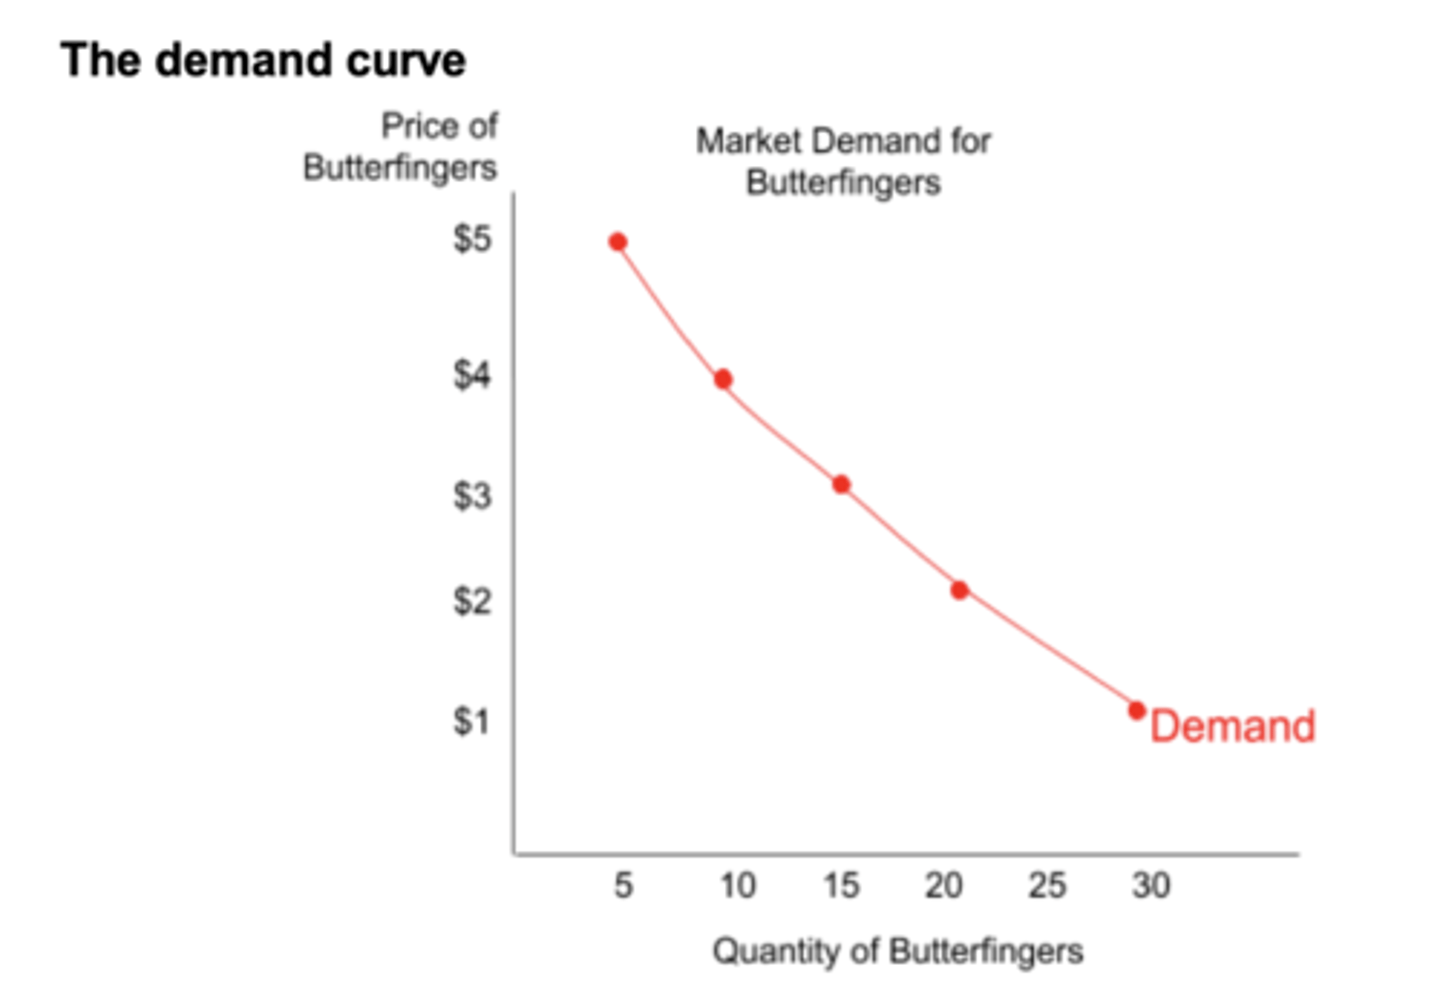
Demand Curve
A graph that shows the inverse relationship between QD and price.
Explanations for the law of demand
The income effect
The substitution effect
The law of marginal utility
The Income Effect
If the price decreases, the proportion of income it occupies in the consumer's income decreases. This increases the consumer's purchasing power, increasing their QD. (and vice versa)
The substitution effect
As the price of a good decreases, consumers switch from other substitute goods to this good because its price is comparatively lower. (and vice versa)
The law of diminishing marginal utility
As we consume additional units of something, the satisfaction (utility) we derive for each additional (marginal) unit grows smaller (diminishes). Therefore, consumers are only willing to buy more of a good when its price falls.
Movement VS Shift in the Demand Curve
Movements along the demand curve are caused due to changes in prices.
Shifts in the demand curve are caused due to non-price determinants.
Determinants of Demand (6)
- Tastes and Preferences of Consumers: A change in consumers’ tastes and preferences will cause demand for a good to either increase (if it is more preferred) or decrease (if it is less preferred)
- Other related goods' prices: Prices of substitute and complementary Goods
- Expectations of future prices: If consumers expect that prices in the future will rise, demand today will fall and vice versa.
- Incomes: The higher the disposable income of a consumer, the higher their demand for certain goods.
- Size of the market: An increase in the number of consumers will increase the demand for a good and vice versa.
- Special Circumstances: Changes in weather, natural disasters, wars, pandemics, etc.
Supply
The willingness and ability of producers to produce goods and services at different price levels.
Market Supply
The sum of all the individual suppliers of a market.
Law of Supply
The quantity supplied of a good or service is directly proportional to its price, ceteris paribus.
Supply Curve
A graph that shows the direct relationship between QS and price.
Vertical Supply Curve
Indicates that even if the price increases, QS cannot increase, as:
- There is no time to produce more of it in the short term (e.g. theatre seats)
- It is no longer produced (e.g. ancient artefacts)
Non-Price Determinants of Supply (7 (TFAR))
- Subsidies: Reduce the CoP and increase the supply.
- Taxes: Increase the CoP and decrease the supply
- Technology: New technologies can make supply more efficient
- Other related goods' prices
- Resource Costs
- Expectations of Producers: If firms expect prices to rise, they will increase the production beforehand and vice versa.
- Size of the market: If the number of firms in the market increases, supply increases and vice versa.
Other related goods' prices
If another good that a firm could produce rises in price, firms will produce more of it and less of what they used to produce, decreasing supply.
If substitutes in production get cheaper, firms will increase production of the now more profitable good, increasing supply.
(e.g. A firm produces milk and curd. If the price of curd increases, they will allocate more resources to increase the supply of curd and thus earn more profit. The supply of milk will decrease.)
Explanations of the law of supply
The law of diminishing marginal returns
Increasing marginal costs and the firm's supply curve
Short Run
A time period during which at least one FoP input is fixed. (e.g. a firm can hire more labour and buy more machines, but stay in the same factory. Since land is fixed, the firm is operating in the short run)
Long Run
A time period during which all FoP inputs are variable.
(e.g. a firm can hire more labour and buy more machines and shift to a different factory. Since all the FoP inputs have been changed, the firm is operating in the long run)
Total product
Total quantity of output produced by a firm
Marginal Product
The extra or additional product produced by one additional unit of variable input (usually labour).
Marginal Product Curve
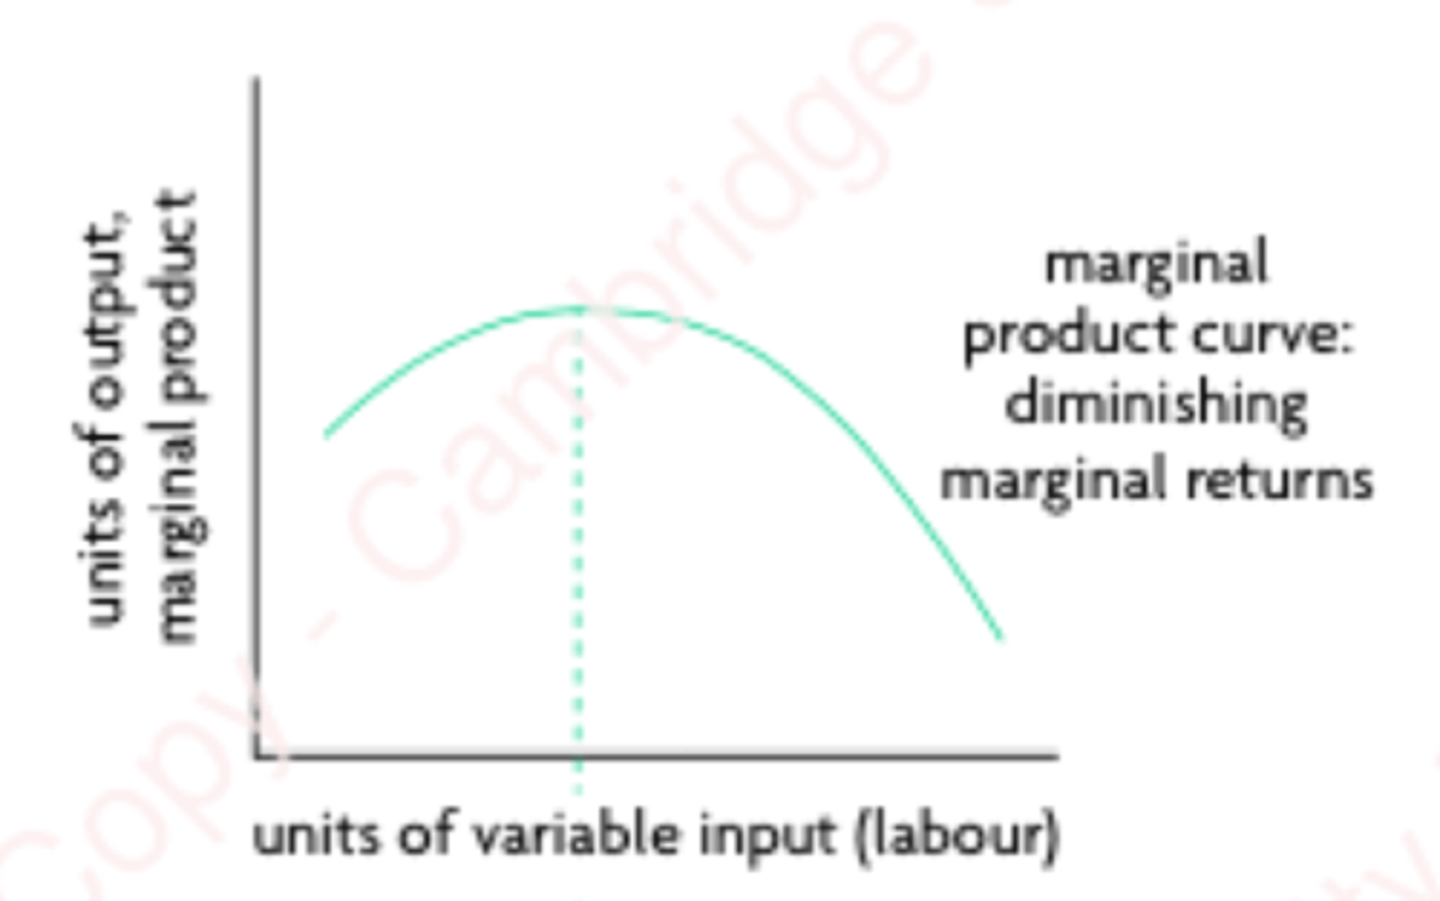
Law of diminishing marginal returns
As more and more inputs of a variable input (such as labour) are added to one or more fixed inputs (such as land), the marginal product of the variable increases at first, but there comes a point where it begins to decrease. This relationship assumes that the fixed input(s) remain fixed and that the production technology is also fixed.
Marginal Cost
The extra or additional cost of producing one or more units of output.
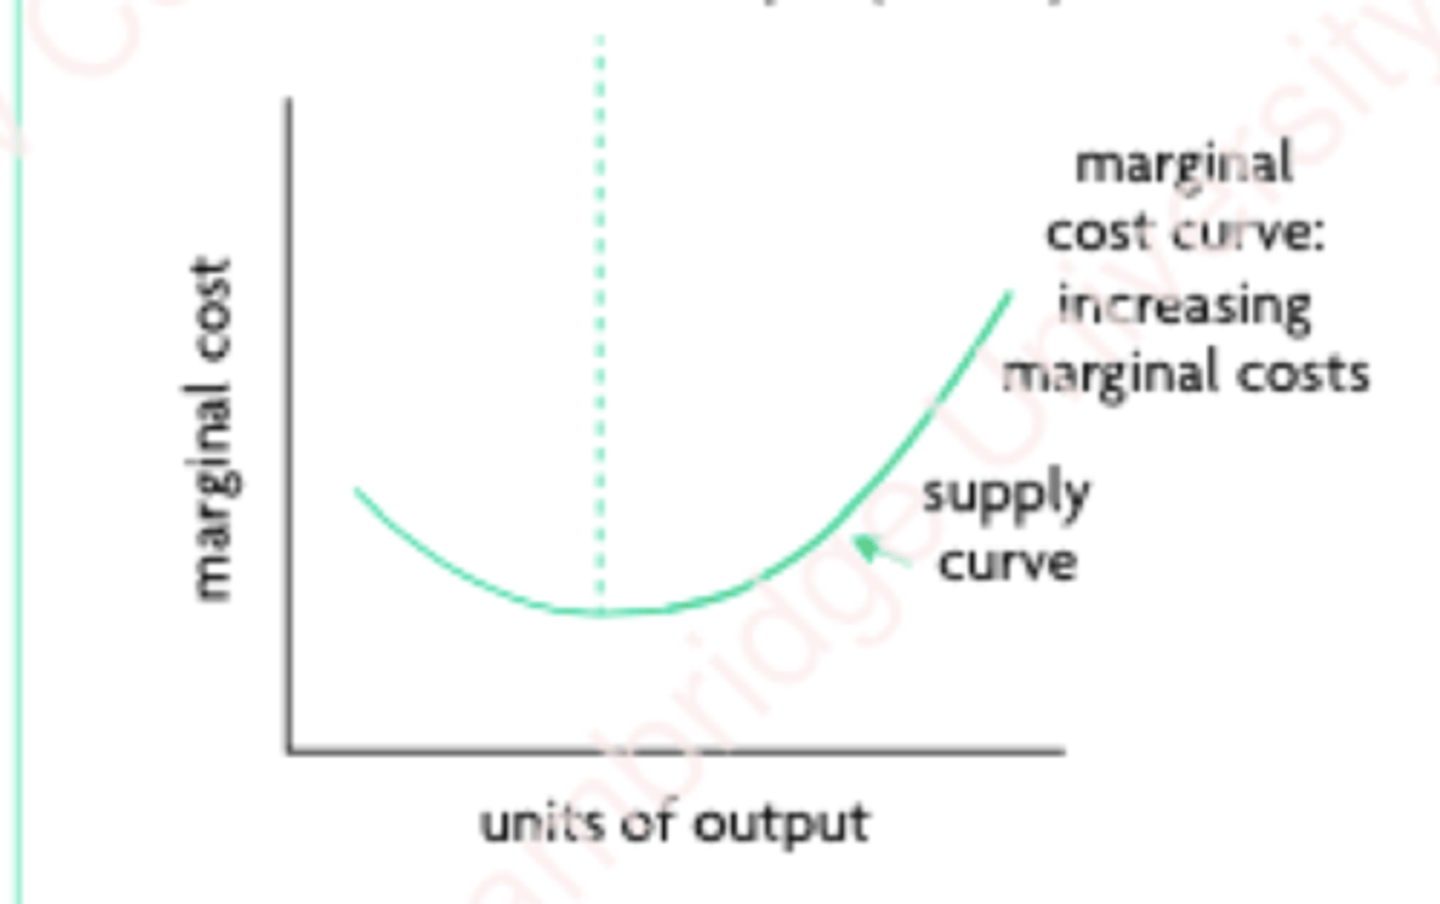
It decreases at first and then increases.
How marginal costs are related to diminishing marginal returns
When marginal product increases, marginal cost decreases; when marginal product is maximum, marginal cost is minimum; and when marginal product falls, marginal cost increases.
Marginal Cost Curve
Equilibrium Price
The price of a good at which QD = QS
Equilibrium Quantity
The quantity of output where in QD = QS
Surplus
When QS > QD
Shortage
When QS < QD
How to resolve a surplus
Decrease prices to increase QD
Decrease/Withhold supply to reduce QS
How to resolve a shortage
Increase prices to decrease QD
Increase production to increase QS
Consumer Surplus
The difference between the highest price a consumer is willing to pay for a good minus the actual price the consumer pays.
The upper triangle.
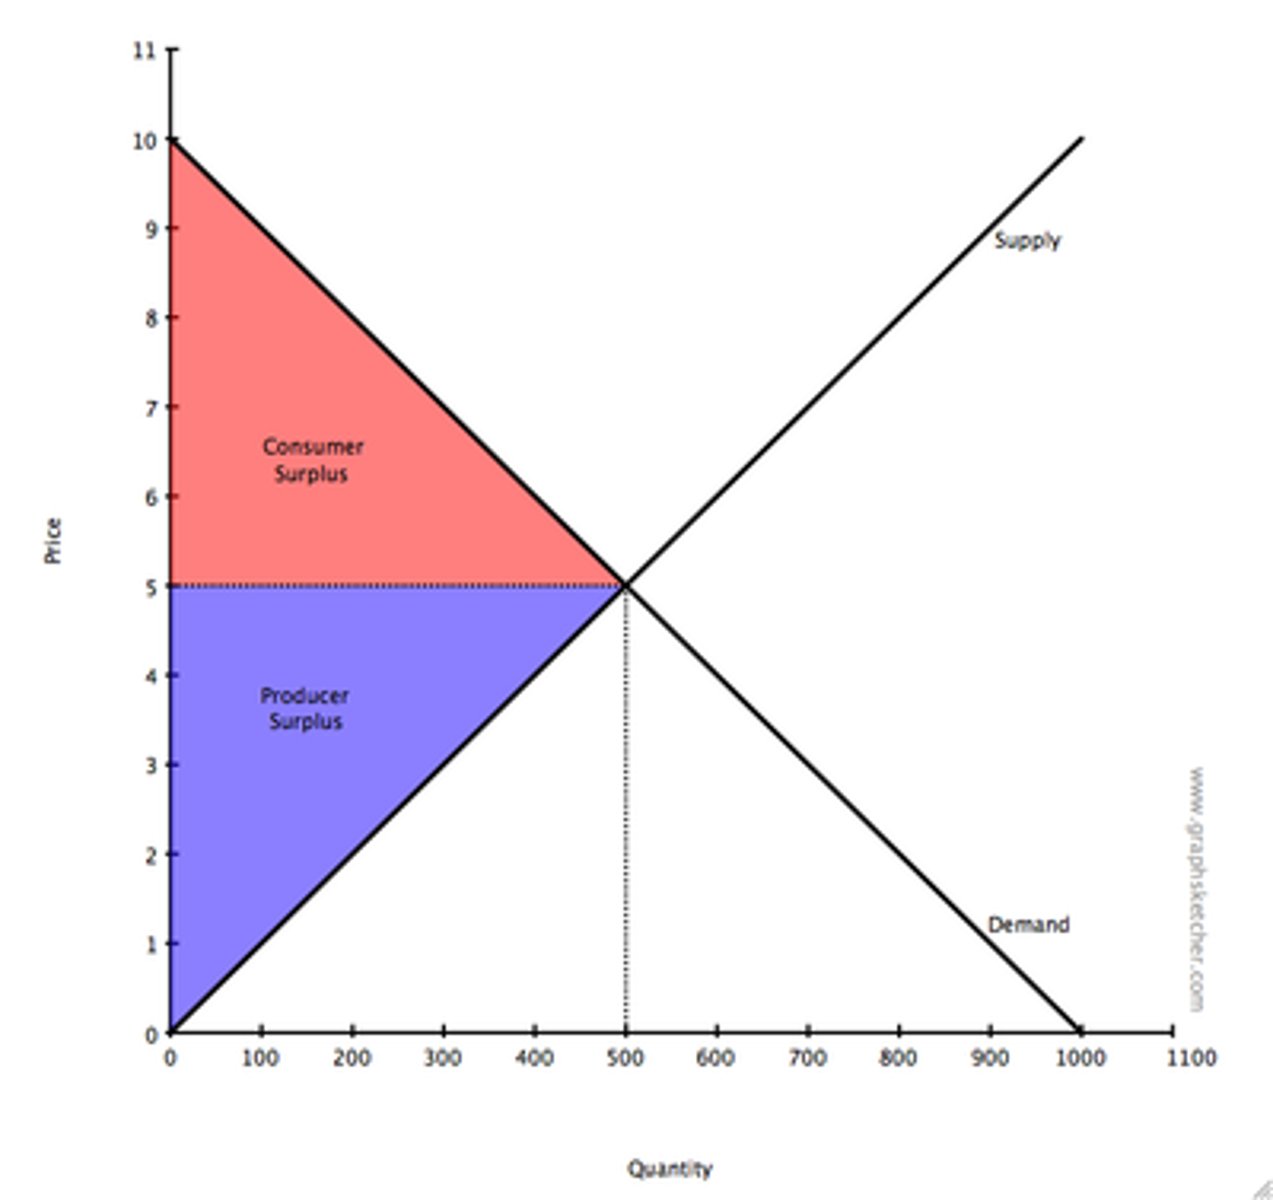
Producer Surplus
The difference between the lowest price a firm would be willing to accept for a good or service minus the price they actually receive.
The lower triangle.

Total surplus
Consumer surplus + Producer surplus
Allocative Efficiency
When a market maximizes consumer and producer surplus.
- The correct quantity is being produced
- Every unit produced is consumed
Marginal Social Benefit
Demand
The social benefit derived from the consumption of every additional unit of a good or service.
It decreases at higher levels of output because additional units of a good bring benefits to fewer and fewer people.
Marginal Social Cost
Supply
The social cost brought about by the production of an additional unit of a good or service.
Allocative Efficiency Formula
MSB = MSC
Deadweight Loss
Welfare loss due to price not being at equilibrium.
Rational economic decision making
Assumption that consumers will always try to maximise benefit and purchase for the lowest price whenever making purchasing decisions.
Assumptions of rational consumer choice
Consumer rationality: Preferences are certain and consistent.
Perfect Information: All possible information is available when making decisions
Utility maximisation: Maximising satisfaction
Limitations of the assumptions of rational behaviour
Biases:
- Anchoring to estimate the price of a product.
- Framing to present information differently
- Bounded Rationality: seeking a decision that will be good enough, rather than the best possible decision.
- Imperfect Information to not make optimal choices.
Behavioural Economics in Action
- Choice architecture
- Nudge theory
Nudge theory
A method designed to influence consumers' choices in a predictable way without offering financial incentives.
Choice Architecture
The design of environments in which people make choices by changing how options are presented.
Rational Producer Behavior
Profit Maximization
Alternative Business Objectives
- Corporate Social Responsibility - protecting the environment, supporting human rights and donating.
- Maximizing Market Share
- Growth Maximization
- Revenue Maximization
- Satisficing - achieving a satisfactory level of all objectives.