bio 181 chapter 3+4
1/91
There's no tags or description
Looks like no tags are added yet.
Name | Mastery | Learn | Test | Matching | Spaced | Call with Kai |
|---|
No analytics yet
Send a link to your students to track their progress
92 Terms

Which container has the lowest concentration of molecules?
a. Container A
b. Container B
c. Container C
d. Container D
Container B
Which series lists the containers in order of their concentrations of molecules, from lowest concentration to highest concentration?
a. D, C, A, B
b. A, B, C, D
c. B, A, C, D
B, A, C, D
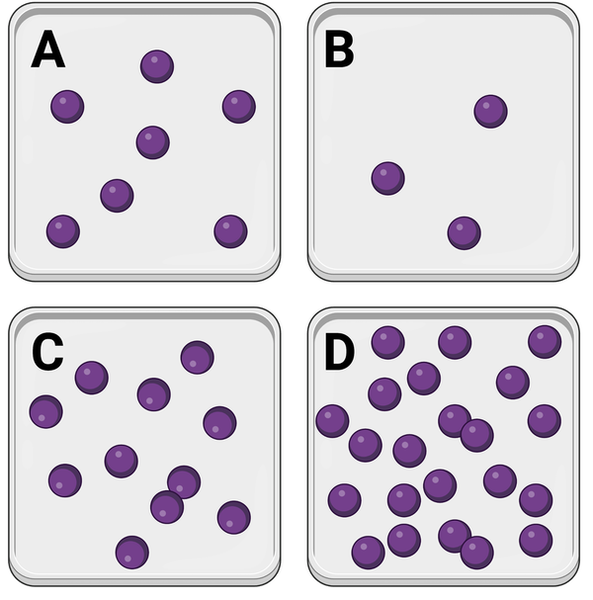
In which container would you expect to observe the greatest number of interactions between molecules?
In which container would you expect to observe the greatest number of interactions between molecules?
a. Container A
b. Container B
c. Container C
d. Container D
d. Container D
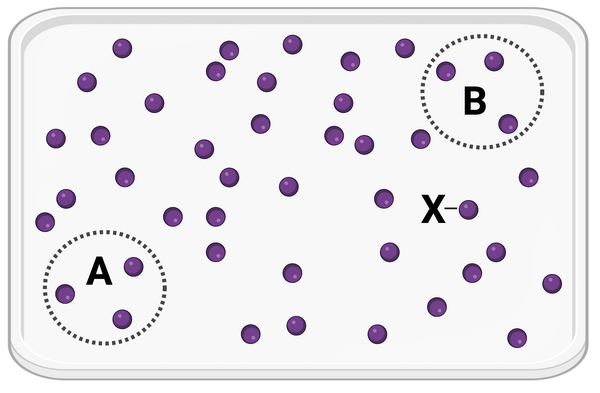
The figure shows a container in which a set of identical molecules (purple dots) are diffusing. Two areas of equal size are designated by dashed lines (area A and area B). The molecule labeled as X is the same distance from area A and from area B.
Which statement is correct?
a. Molecule X will more likely diffuse to area A before diffusing to area B.
b. Molecule X will more likely diffuse to area B before diffusing to area A.
c. Molecule X is equally likely to diffuse to area A or area B.
c. Molecule X is equally likely to diffuse to area A or area B.
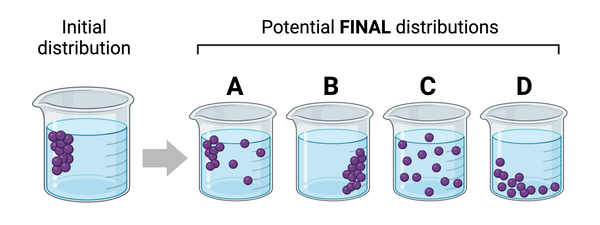
The figure shows an initial distribution of molecules (purple dots) dissolved in a beaker of water. Beakers A through D show four potential distributions of the molecules after some time.
Which of these potential distributions is most likely to be observed?
a. Distribution A
b. Distribution B
c. Distribution C
d. Distribution D
c. Distribution C
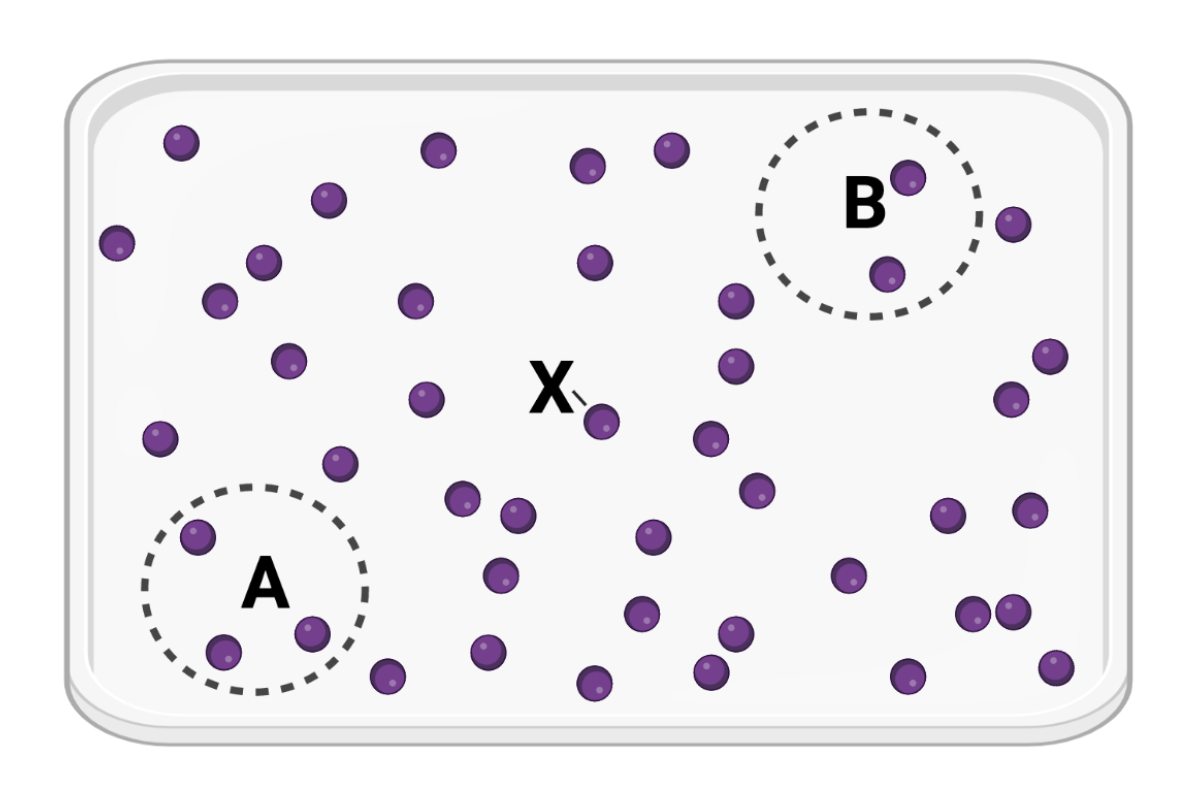
The figure shows a container in which a set of identical molecules (purple dots) are diffusing. Two areas of equal size are designated by dashed lines (area A and area B). The molecule labeled as X is closer to area B than it is to area A.
Which statement is correct?
a. Molecule X will more likely diffuse to area A before diffusing to area B.
c. Molecule X is equally likely to diffuse to area A or area B.
b. Molecule X will more likely diffuse to area B before diffusing to area A.
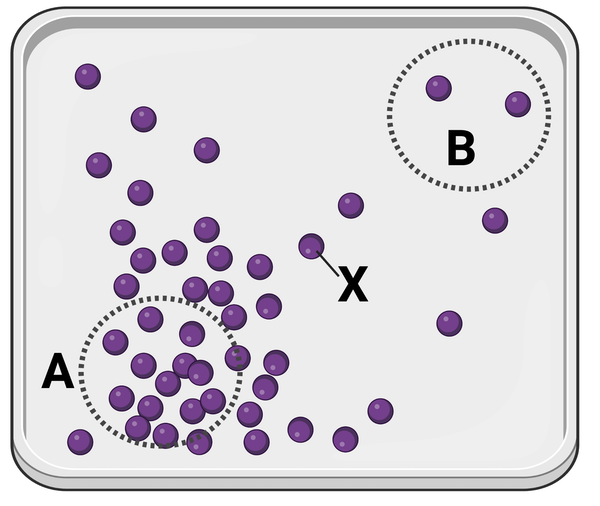
The figure shows a container in which a set of identical molecules (purple dots) are diffusing. Two areas of equal size are designated by dashed lines (area A and area B). The molecule labeled as X is the same distance from area A and from area B.
Which statement is correct?
a. Molecule X will more likely diffuse to area A before diffusing to area B.
b. Molecule X will more likely diffuse to area B before diffusing to area A.
c. Molecule X is equally likely to diffuse to area A or area B.
b. Molecule X will more likely diffuse to area B before diffusing to area A.
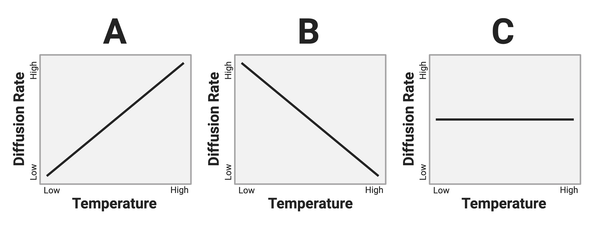
The figure shows three hypothetical relationships between temperature and the rate of diffusion.
Which graph shows the most likely relationship?
a. Graph A
b. Graph B
c. Graph C
a. Graph A
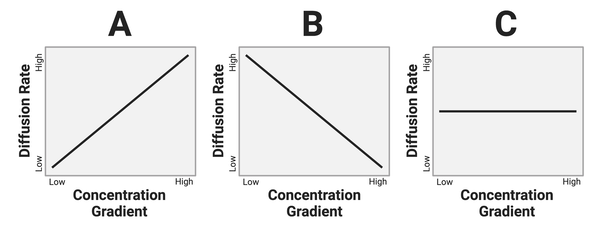
The figure below presents three graphs. Each graph below shows a relationship between the concentration gradient of a solute and the rate of diffusion in a solution.
Which graph shows the most likely relationship?
a. Graph A
b. Graph B
c. Graph C
a. Graph A
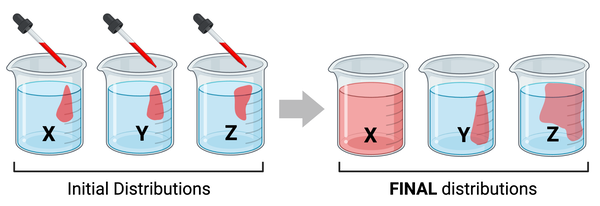
The figure shows the same amount of red liquid being added to each of three beakers of water (see initial distributions). The molecular mass of the molecules in the red liquid differs among beakers. After 10 minutes, you notice that the red liquid has diffused at a different rate in each beaker (see final distributions).
Which series lists the beakers in order of the molecular masses of the molecules, from highest mass to lowest mass?
a. X > Y > Z
b. Y > Z > X
c. Z > X > Y
b. Y > Z > X
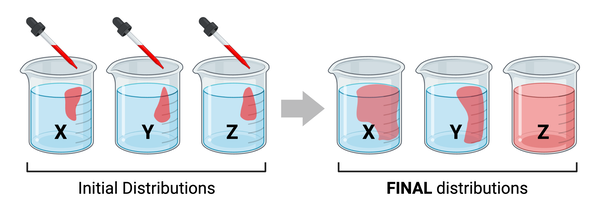
The figure shows the same amount of red liquid being added to each of three beakers of water (see initial distributions). The molecular mass of the molecules in the red liquid differs among beakers. After 10 minutes, you notice that the red liquid has diffused at a different rate in each beaker (see final distributions).
What are the most likely temperatures of the three beakers?
a. X= 0℃, Y= 50℃, Z= 95℃
b. X= 95℃, Y= 0℃, Z= 50℃
c. X= 50℃, Y= 0℃, Z= 95℃
c. X= 50℃, Y= 0℃, Z= 95℃

Which terms accurately describe the chemical nature of Region A? Select all that apply.
a. nonpolar
b. polar
d. hydrophilic
a. nonpolar
c. hydrophobic
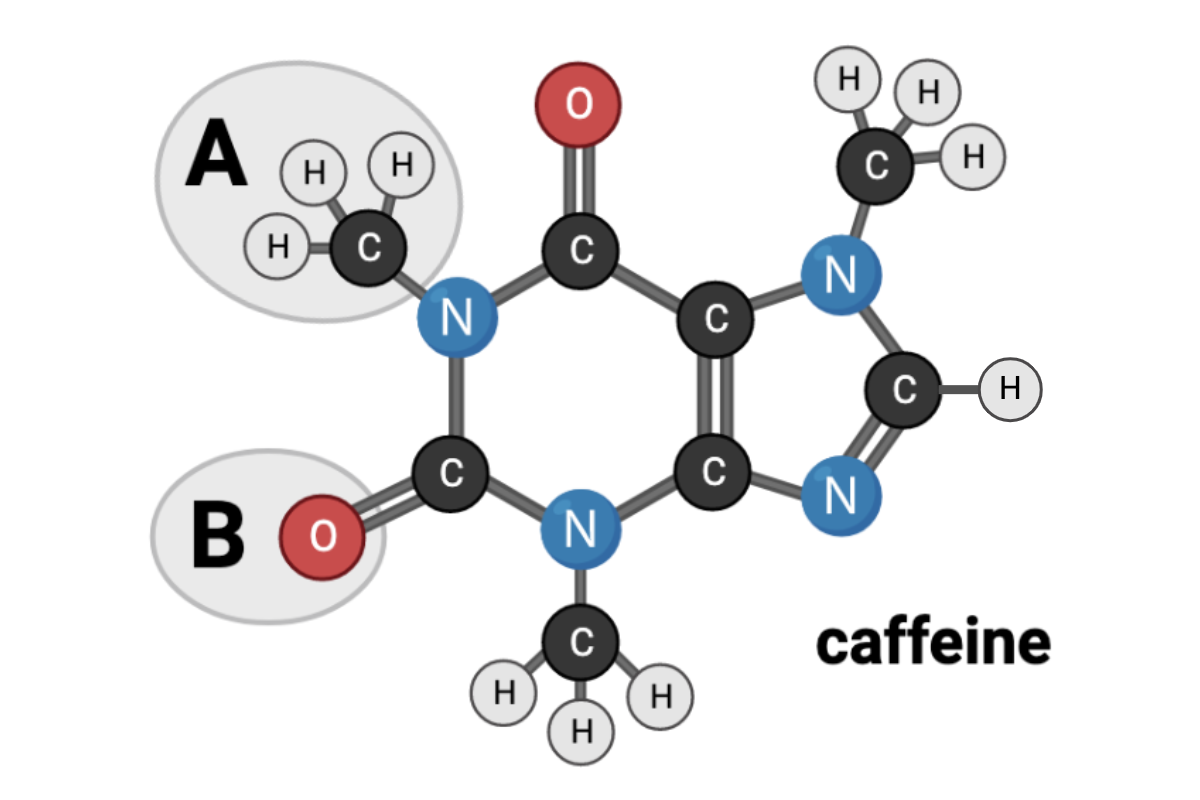
Which terms accurately describe the chemical nature of Region B? Select all that apply.
a. nonpolar
b. polar
c. hydrophobic
d. hydrophilic
b. polar
d. hydrophilic
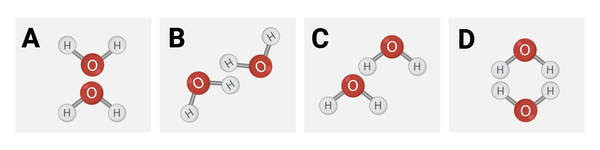
Which diagram shows how water molecules are most likely to interact?
a. Diagram A
b. Diagram B
c. Diagram C
d. Diagram D
c. Diagram C

Which chemical property most likely describes the unknown molecule?
a. negatively charged
b. positively charged
c. without a charge.
d. hydrophobic
e. nonpolar
a. negatively charged
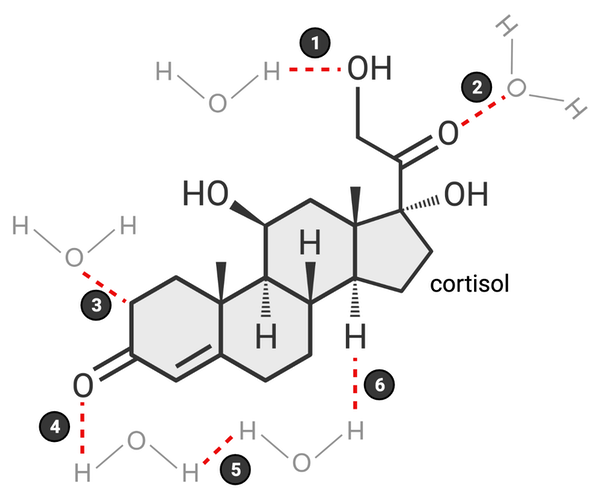
Which of these bonds accurately represents a hydrogen bond? Select all that apply.
a. 1
b. 2
c. 3
d. 4
e. 5
f. 6
a. 1
d. 4

Which chemical properties apply to Region X? Select all that apply.
a. water soluble
b. water insoluble
c. polar
d. nonpolar
e. charged
f. uncharged
g. hydrophobic
h. hydrophilic
a,c,e,h

Which chemical properties apply to Region Y? Select all that apply.
a. water soluble
b. water insoluble
c. polar
d. nonpolar
e. charged
f. uncharged
g. hydrophobic
h. hydrophilic
b,d,f,g

Which region is likely to interact with a molecule of water, and why?
a. Region X, because this region contains charged and polar molecules.
b. Region X, because this region contains only uncharged molecules.
c. Region Y, because this region contains charged and polar molecules..
d. Region Y, because this region contains only uncharged molecules.
a

Which region is unlikely to interact with water, and why?
a. Region X, because this region contains charged and polar molecules.
b. Region X, because this region contains only uncharged, nonpolar molecules.
c. Region Y, because this region contains charged and polar molecules.
d. Region Y, because this region contains only uncharged, nonpolar molecules.
d

Which structure would be the most stable and likely to occur?
a. Structure A
b. Structure B
c. Structure C
d. Structure D
c

The figure shows a solution of the phospholipids being dropped into a beaker of water. The boxes on the right (A through D) show four potential structures that the phospholipids may form.
Which claims are accurate? Select all that apply.
a. The phosphate region of a phospholipid has high affinity to water molecules and to the phosphate regions of other phospholipids.
b. The fatty acid region of a phospholipid is repelled by water molecules and by the phosphate regions of other phospholipids.
c. Both the phosphate region and the fatty acid region have high affinity to water molecules and to other phospholipids.
d. Both the phosphate region and the fatty acid region are repelled by water molecules and by other phospholipids.
e. The affinity between the phosphate regions of phospholipids is greater than the affinity between the fatty acid regions of phospholipids.
Correct answer.Should have been checked.
f. The affinity between fatty acid regions of phospholipids exceeds the affinity between the phosphate regions of phospholipids.
a,b,e

Lipids are transported in the bloodstream of an organism. To remain soluble in blood, lipids must be transported inside structures called lipoproteins. A lipoprotein has an outer surface exposed to blood and an interior that contains lipids, as shown in the figure.
Given that water is the most abundant molecule in blood, predict the chemical properties of a lipoprotein by filling in the blanks of the following statement.
The outer surface of a lipoprotein is ___________, and the interior is ___________.
a. hydrophilic; hydrophilic
b. hydrophobic; hydrophobic
c. hydrophilic; hydrophobic
d. hydrophobic; hydrophilic
c

Which series lists the molecules in order of hydrophilicity, from most hydrophilic to least hydrophilic?
a. C > B > D > A
b. A > D > C > B
c. A > D > B > C
a

Which series lists the molecules in order of their likelihood to diffuse through a phospholipid bilayer, from most likely to least likely?
a. C, B, A, D
b. A, D, B, C
c. D, A, C, B
d. B, A, C, D
b

Which molecule is likely the most charged or polar?
a. Molecule A
b. Molecule B
c. Molecule C
d. Molecule D
e. Molecule E
b

Which molecule is likely the least charged or polar?
a. Molecule A
b. Molecule B
c. Molecule C
d. Molecule D
e. Molecule E
c

Which molecule is likely the most hydrophilic?
a. Molecule A
b. Molecule B
c. Molecule C
d. Molecule D
e. Molecule E
b

Which molecule is likely the least hydrophilic?
a. Molecule A
b. Molecule B
c. Molecule C
d. Molecule D
e. Molecule E
c

How would osmosis affect the concentration of Cl- in the cell?
a. The concentration of Cl- inside the cell will increase, because water will diffuse from the inside of the cell to the outside.
Should have been checked.
b. The concentration of Cl- inside the cell will decrease, because water will diffuse from the inside of the cell to the outside.
Should not have been checked.
c. The concentration of Cl- inside the cell will increase, because water will diffuse from the outside of the cell to the inside.
Should not have been checked.
d. The concentration of Cl- inside the cell will decrease, because water will diffuse from the outside of the cell to the inside.
Wrong answer.Should not have been checked.
e. The concentrations of Cl- will remain the same.
a

Which claims are accurate? Select all that apply.
a. The concentration gradient would favor the net diffusion of Cl- out of the cell.
Should not have been checked.
b. The concentration gradient would favor the net diffusion of Cl- into the cell.
Should have been checked.
c. The concentration gradient would not favor a net diffusion of Cl- in either direction.
Wrong answer.Should not have been checked.
d. Because Cl- is charged, it cannot pass through a phospholipid bilayer by simple diffusion.
Should have been checked.
e. Because Cl- is partially charged, it cannot pass through a phospholipid bilayer by simple diffusion.
Wrong answer.Should not have been checked.
f. Because Cl- is uncharged, it can pass through a phospholipid bilayer by simple diffusion.
b,d
How would osmosis affect the concentration of sucrose in the cell?
a. The concentration of sucrose inside the cell will increase because water will diffuse from the inside of the cell to the outside.
Should not have been checked.
b. The concentration of sucrose inside the cell will decrease, because water will diffuse from the inside of the cell to the outside.
Should not have been checked.
c. The concentration of sucrose inside the cell will increase, because water will diffuse from the outside of the cell to the inside.
Should not have been checked.
d. The concentration of sucrose inside the cell will decrease, because water will diffuse from the outside of the cell to the inside.
Correct answer.Should have been checked.
e. The concentrations of sucrose will remain the same.
d

Which claims are accurate? Select all that apply.
a. The concentration gradient would favor the net diffusion of sucrose out of the cell.
Correct answer.Should have been checked.
b. The concentration gradient would favor the net diffusion of sucrose into the cell.
Should not have been checked.
c. The concentration gradient would not favor a net diffusion of sucrose in either direction.
Should not have been checked.
d. Because sucrose is charged, it cannot pass through a phospholipid bilayer by simple diffusion.
Wrong answer.Should not have been checked.
e. Because sucrose is partially charged, it cannot pass through a phospholipid bilayer by simple diffusion.
Should have been checked.
f. Because sucrose is uncharged, it can pass through a phospholipid bilayer by simple diffusion.
a,e

How would osmosis affect the concentration of ethylene in the cell?
a. The concentration of ethylene inside the cell will increase, because water will diffuse from the inside of the cell to the outside.
Should have been checked.
b. The concentration of ethylene inside the cell will decrease, because water will diffuse from the inside of the cell to the outside.
Wrong answer.Should not have been checked.
c. The concentration of ethylene inside the cell will increase, because water will diffuse from the outside of the cell to the inside.
Should not have been checked.
d. The concentration of ethylene inside the cell will decrease, because water will diffuse from the outside of the cell to the inside.
Should not have been checked.
e. The concentrations of ethylene will remain the same.
a

Which claims are accurate? Select all that apply.
a. The concentration gradient would favor the net diffusion of ethylene out of the cell.
Should not have been checked.
b. The concentration gradient would favor the net diffusion of ethylene into the cell.
Should have been checked.
c. The concentration gradient would not favor a net diffusion of ethylene in either direction.
Should not have been checked.
d. Because ethylene is charged, it cannot pass through a phospholipid bilayer by simple diffusion.
Wrong answer.Should not have been checked.
e. Because ethylene is partially charged, it cannot pass through a phospholipid bilayer by simple diffusion.
Wrong answer.Should not have been checked.
f. Because ethylene is uncharged, it can pass through a phospholipid bilayer by simple diffusion.
b,f

The solution outside the cell is ______________ to the solution inside the cell.
a. hyperosmotic
Should not have been checked.
b. isosmotic
Should have been checked.
c. hypoosmotic
b

The solution outside the cell is ______________ to the solution inside the cell.
a. hyperosmotic
Correct answer.Should have been checked.
b. isosmotic
Should not have been checked.
c. hypoosmotic
a

For which cells will the net diffusion of water be out of the cell? Select all that apply.
a. Cell A
Wrong answer.Should not have been checked.
b. Cell B
Should not have been checked.
c. Cell C
Wrong answer.Should not have been checked.
d. Cell D
d
Which condition causes a net diffusion of water out of the cell?
a. The concentration of water inside the cell is greater than the concentration outside the cell.
Correct answer.Should have been checked.
b. The concentration of water inside the cell is less than the concentration outside the cell.
Should not have been checked.
c. The concentration of water inside the cell equals the concentration outside the cell.
a

For which cells will the net diffusion of water be into the cell? Select all that apply.
a. Cell A
Should have been checked.
b. Cell B
Wrong answer.Should not have been checked.
c. Cell C
Correct answer.Should have been checked.
d. Cell D
a,c
Which condition causes a net diffusion of water into the cell?
a. The solute concentration inside the cell is greater than the concentration outside the cell.
Should have been checked.
b. The solute concentration inside the cell is less than the concentration outside the cell.
Wrong answer.Should not have been checked.
a

Which cell will experience the greatest net diffusion of water from inside to outside?
a. Cell A
Wrong answer.Should not have been checked.
b. Cell B
Should not have been checked.
c. Cell C
Should not have been checked.
d. Cell D
d

Which cell will experience the greatest net diffusion of water from outside to inside?
a. Cell A
Should not have been checked.
b. Cell B
Should not have been checked.
c. Cell C
Should have been checked.
d. Cell D
.
c

The figure shows the shape of red blood cells under a microscope, before and after adding a drop of Solution A to the slide. The cells shriveled immediately after Solution A was added.
Note: This information is repeated for question 10.
The cells were most likely suspended in a _________ solution.
The cells were most likely suspended in a _________ solution.
a. hyperosmotic
Correct answer.Should have been checked.
b. isosmotic
Should not have been checked.
c. hypoosmotic
a

The concentration of solutes outside of the cells was likely _________ the concentration of solutes inside the cells.
a. greater than
Should have been checked.
b. less than
Wrong answer.Should not have been checked.
c. equal to
a

The cells were most likely suspended in a ________ solution.
a. hyperosmotic
Should not have been checked.
b. isosmotic
Wrong answer.Should not have been checked.
c. hypoosmotic
c
The concentration of solutes outside of the cells was likely _________ the concentration of solutes inside the cells.
a. greater than
Should not have been checked.
b. less than
Should have been checked.
c. equal to
b
The cells were most likely suspended in a ________ solution.
a. hyperosmotic
Should not have been checked.
b. isosmotic
Correct answer.Should have been checked.
c. hypoosmotic
b
The concentration of solutes outside of the cells was likely _________ the concentration of solutes inside the cells.
a. greater than
Should not have been checked.
b. less than
Wrong answer.Should not have been checked.
c. equal to
c

How would the rate of net diffusion change if the concentration gradient across the membrane were to increase from 20 mM to 40 mM?
a. The rate of net diffusion would decrease to one quarter of the previous rate.
Should not have been checked.
b. The rate of net diffusion would decrease to one half of the previous rate.
Wrong answer.Should not have been checked.
c. The rate of net diffusion would increase to twice the previous rate.
Should have been checked.
d. The rate of net diffusion would increase to four times the previous rate.
Should not have been checked.
e. The rate of net diffusion would remain the same.
c

How would the rate of net diffusion change if the concentration gradient across the membrane were to decrease from 150 mM to 50 mM?
a. The rate of net diffusion would decrease to one quarter of the previous rate.
Should not have been checked.
b. The rate of net diffusion would decrease to one third of the previous rate.
Should have been checked.
c. The rate of net diffusion would decrease to one half of the previous rate.
Should not have been checked.
d. The rate of net diffusion would decrease to three quarters of the previous rate.
Wrong answer.Should not have been checked.
e. The rate of net diffusion would remain the same.
b

How would the rate of net diffusion change if the area of the membrane were doubled?
a. The rate of net diffusion would decrease to one quarter of the previous rate.
Should not have been checked.
b. The rate of net diffusion would decrease to one half of the previous rate.
Wrong answer.Should not have been checked.
c. The rate of net diffusion would increase to twice the previous rate.
Should have been checked.
d. The rate of net diffusion would increase to three times the previous rate.
Should not have been checked.
e. The rate of net diffusion would remain the same.
c

How would the rate of net diffusion change if the thickness of the membrane were to increase by 10%?
a. The rate of net diffusion would decrease by approximately 20%.
Should not have been checked.
b. The rate of net diffusion would decrease by approximately 10%.
Should have been checked.
c. The rate of net diffusion would increase by approximately 20%.
Should not have been checked.
d. The rate of net diffusion would increase by approximately 10%.
Wrong answer.Should not have been checked.
e. The rate of net diffusion would remain the same.
b

The diffusion of sodium ions through the cell membrane was observed for two cells. The rate of net diffusion for the first cell was three times greater than that for the second cell.
Which statements could explain this difference? Select all that apply.
a. The area of membrane that is permeable to sodium ions for the first cell was three times greater than the area for the second cell.
Should have been checked.
b. The area of membrane that is permeable to sodium ions for the first cell is one third of the area for the second cell.
Wrong answer.Should not have been checked.
c. The concentration gradient of sodium ions across the first cell was one half of the concentration gradient across the second cell.
Should not have been checked.
d. The concentration gradient of sodium ions across the first cell was three times greater than the concentration gradient across the second cell.
Correct answer.Should have been checked.
e. The thickness of the membrane for the first cell was one half of the thickness of the membrane for the second cell.
Should not have been checked.
f. The thickness of the membrane for the first cell was twice the thickness of the membrane for the second cell.
a,d

The figure shows four cells, each suspended in a solution of water. All cells have the same area and thickness of membrane. All cells are permeable to solutes. The internal and external concentrations of solutes are labeled in the figure.
Note: This information is repeated for question 7.
According to Fick's equation, which cell would experience the fastest rate of net diffusion of solutes through the membrane?
a. Cell A
Should have been checked.
b. Cell B
Should not have been checked.
c. Cell C
Should not have been checked.
d. Cell D
Wrong answer.Should not have been checked.
e. All cells would experience the same rate of net diffusion.
a

The figure shows four cells, each suspended in a solution of water. All cells have the same area and thickness of membrane. All cells are permeable to solutes. The internal and external concentrations of solutes are labeled in the figure.
According to Fick's equation, which cell would experience the slowest rate of net diffusion of solutes through the membrane?
a. Cell A
Should not have been checked.
b. Cell B
Wrong answer.Should not have been checked.
c. Cell C
Should have been checked.
d. Cell D
Should not have been checked.
e. All cells would experience the same rate of net diffusion.
c
Which statements accurately describe simple diffusion? Select all that apply.
a. Molecules move from an area of high concentration to an area of low concentration.
Should have been checked.
b. Molecules move from an area of low concentration to an area of high concentration.
Wrong answer.Should not have been checked.
c. No energy is required for this process to occur.
Should not have been checked.
d. Only kinetic energy is required for this process to occur.
Should have been checked.
e. A protein transporter is not required.
Should have been checked.
f. A protein transporter is required.
Wrong answer.Should not have been checked.
g. Molecules move directly through the phospholipid bilayer.
Should have been checked.
h. Molecules move directly through proteins called channels or carriers.
a,d,e,g
Which statements accurately describe facilitated diffusion? Select all that apply.
a. Molecules move from an area of high concentration to an area of low concentration.
Should have been checked.
b. Molecules move from an area of low concentration to an area of high concentration.
Should not have been checked.
c. A protein transporter is not required.
Should not have been checked.
d. A protein transporter is required.
Should have been checked.
e. Molecules move directly through the phospholipid bilayer.
Wrong answer.Should not have been checked.
f. Molecules move directly through proteins called channels or carriers.
Should have been checked.
g. This process transports nonpolar molecules.
Should not have been checked.
h. This process transports polar molecules.
Correct answer.Should have been checked.
i. This process transports charged molecules.
a,d,f,h,i
Carrier proteins transport molecules across the cell membrane by _________.
a. creating a pore for the molecule to diffuse through
Should not have been checked.
b. using energy in the form of ATP
Wrong answer.Should not have been checked.
c. binding the molecule and changing shape to allow passage through the membrane
Should have been checked.
d. using ion gradients to move the molecule across the membrane
c

Which statement(s) could accurately describe Molecule 1? Select all that apply.
a. This molecule is hydrophobic.
Correct answer.Should have been checked.
b. This molecule is small and hydrophilic.
Should have been checked.
c. This molecule is large and hydrophilic.
Should not have been checked.
d. This molecule is nonpolar.
a,b,d

The figure shows Molecule 2, an example of facilitated diffusion of molecules through a cell membrane.
Which statement(s) could accurately describe Molecule 2? Select all that apply.
a. This molecule is hydrophobic.
Should not have been checked.
b. This molecule is hydrophilic.
Correct answer.Should have been checked.
c. This molecule is nonpolar.
Should not have been checked.
d. This molecule could have a polar region.
Correct answer.Should have been checked.
e. This molecule could have a charged region.
b,d,e

The figure shows Molecule 3, an example of facilitated diffusion of molecules through a cell membrane.
Which statement(s) could accurately describe Molecule 3? Select all that apply.
a. This molecule is hydrophobic.
Should not have been checked.
b. This molecule is hydrophilic.
Should have been checked.
c. This molecule is nonpolar.
Wrong answer.Should not have been checked.
d. This molecule has a polar region.
Correct answer.Should have been checked.
e. This molecule has a charged region.
b,d,e

The figure shows the Structure 1 detail of the figure depicting examples of simple diffusion and facilitated diffusion.
Which statement(s) accurately describe Structure 1? Select all that apply.
a. This structure is a phospholipid.
Correct answer.Should have been checked.
b. This structure is a phospholipid bilayer.
Should not have been checked.
c. This structure is a protein.
Should not have been checked.
d. This structure has a hydrophobic region.
Should have been checked.
e. This structure has a hydrophilic region.
Should have been checked.
f. This structure is amphiphilic.
Correct answer.Should have been checked.
g. This structure has a nonpolar region.
Should have been checked.
h. This structure has a polar region.
Should have been checked.
i. This structure has a charged region.
a,d,e,f,g,h,i

The figure shows the Structure 2 detail of the figure depicting examples of simple diffusion and facilitated diffusion.
Which statement(s) accurately describe Structure 2? Select all that apply.
a. This structure is a phospholipid.
Wrong answer.Should not have been checked.
b. This structure is a phospholipid bilayer.
Should not have been checked.
c. This structure is a protein.
Correct answer.Should have been checked.
d. This structure is a channel protein.
Should have been checked.
e. This structure is a carrier protein.
c,d

The figure shows the Structure 3 detail of the figure depicting examples of simple diffusion and facilitated diffusion.
Which statement(s) accurately describe Structure 3? Select all that apply.
a. This structure is a phospholipid.
Should not have been checked.
b. This structure is a phospholipid bilayer.
Should not have been checked.
c. This structure is a protein.
Correct answer.Should have been checked.
d. This structure is a channel protein.
Should have been checked.
e. This structure is a carrier protein.
c,d

Which statement(s) accurately describe Structure 4? Select all that apply.
a. This structure is a phospholipid.
Wrong answer.Should not have been checked.
b. This structure is a phospholipid bilayer.
Should not have been checked.
c. This structure is a protein.
Correct answer.Should have been checked.
d. This structure is a channel protein.
Should not have been checked.
e. this structuer is a carrrier protein
c,e

Which statement(s) accurately describe Structure 5? Select all that apply.
a. This structure is a phospholipid.
Should not have been checked.
b. This structure is a phospholipid bilayer.
Correct answer.Should have been checked.
c. This structure is a protein.
Should not have been checked.
d. This structure is a channel protein.
Should not have been checked.
e. This structure is a carrier protein.
b

Based on the direction of flow depicted in the model, the concentration of Molecule 2 must be _________ of the cell.
a. higher on the outside than the inside
Wrong answer.Should not have been checked.
b. lower on the outside than the inside
Should have been checked.
c. the same on the outside and the inside
b

Based on the direction of flow depicted in the model, the concentration of Molecule 3 must be _________ of the cell.
a. higher on the outside than the inside
Correct answer.Should have been checked.
b. lower on the outside than the inside
Should not have been checked.
c. the same on the outside and the inside
a

Which process requires a concentration gradient to drive molecules across the plasma membrane, with or without a protein transporter? Select all that apply.
a. Process 1
Should have been checked.
b. Process 2
Correct answer.Should have been checked.
c. Process 3
Correct answer.Should have been checked.
d. Process 4
a,b,c,d

The figure shows a cell membrane with a channel that transports potassium ions. Four sites are labeled, representing regions of the protein with specific chemical properties. The table lists possible combinations of chemical properties of the amino acids at sites 1 through 4.
Which combination of chemical properties accurately describes a channel capable of transporting K+ ions through a membrane?
a. Combination A
Should not have been checked.
b. Combination B
Wrong answer.Should not have been checked.
c. Combination C
Should have been checked.
d. Combination D
c

The figure shows a cell membrane with a channel protein. Regions 1 and 2 contain numerous amino acids with a partial positive charge.
Which types of ions could diffuse through this channel? Select all that apply.
a. K+
Should not have been checked.
b. Na+
Wrong answer.Should not have been checked.
c. Ca2+
Should not have been checked.
d. Cl-
Correct answer.Should have been checked.
e. HCO3-
d,e
You are studying how a molecule called BD11 moves through the membrane of a red blood cell. Through some measurements, you observe the following points:
- BD11 is a large, polar molecule.
- BD11 can move through the membrane in either direction.
- BD11 always moves from a region of high concentration to a region of low concentration.
- No ATP is required for BD11 to move through a membrane.
- BD11 cannot pass through the membrane in the presence of a drug called FR14, but movement through the membrane resumes when the drug is removed.
Based on these observations, BD11 is most likely transported by ________.
a. simple diffusion
Wrong answer.Should not have been checked.
b. a channel protein
Should not have been checked.
c. a carrier protein
Should have been checked.
d. I do not know the answer.
c
Which statements accurately describe facilitated diffusion? Select all that apply.
a. This process requires that molecules move from an area of high concentration to an area of low concentration.
Should have been checked.
b. this process requires channel or carrier proteins.
Should have been checked.
c. This process requires energy in the form of ATP.
Wrong answer.Should not have been checked.
d. This process requires energy in the form of an electrochemical gradient.
Should have been checked.
e. This process enables nonpolar molecules to pass through a cell membrane.
Should not have been checked.
f. This process enables polar or charged molecules to pass through a cell membrane.
a,b,d,f
Which statements accurately describe primary active transport? Select all that apply.
a. This process requires that molecules move from an area of high concentration to an area of low concentration.
Should not have been checked.
b. This process requires carrier proteins.
Should have been checked.
c. This process requires channel proteins.
Should not have been checked.
d. This process requires energy in the form of ATP.
Should have been checked.
e. This process requires energy in the form of an electrochemical gradient.
Wrong answer.Should not have been checked.
f. This process enables nonpolar molecules to pass through a cell membrane.
Should not have been checked.
g. This process enables polar or charged molecules to pass through a cell membrane.
b,d,g
Which statements accurately describe secondary active transport? Select all that apply.
a. This process requires that some molecules move from an area of high concentration to an area of low concentration.
Should have been checked.
b. This process requires either carrier proteins or channel proteins.
Correct answer.Should have been checked.
c. This process requires energy in the form of ATP.
Should not have been checked.
d. This process requires energy in the form of an electrochemical gradient.
Should have been checked.
e. This process enables nonpolar molecules to pass through a cell membrane.
Should not have been checked.
f. This process enables polar or charged molecules to pass through a cell membrane.
a,b,d,f
Which statement best describes the difference between primary active transport and secondary active transport?
a. Primary active transport moves solutes directly through the membrane, but secondary active transport requires a carrier protein.
Wrong answer.Should not have been checked.
b. Primary active transport moves solutes from high concentration to low concentration, but secondary active transport moves solutes from low concentration to high concentration.
Should not have been checked.
c. Primary active transport requires ATP, but secondary active transport requires an electrochemical gradient.
c

The figure shows a cell membrane with an antiporter protein that transports sodium ions (Na+) and potassium ions (K+). Four sites are labeled, representing regions of the protein with specific chemical properties.
The table lists possible characteristics of the amino acids at Sites 1 through 4 identified in the figure.
Which combination of characteristics would produce a protein that can move Na+ and K+ through the membrane?
a. Row A
Correct answer.Should have been checked.
b. Row B
Should not have been checked.
c. Row C
Should not have been checked.
d. Row D
a

The figure shows the movements of hydrogen ions (H+), potassium ions (K+), and chloride ions (Cl-) through a cell membrane. The relative concentrations of each ion (high or low) are provided in the figure.
Which statement accurately describes the transport shown in the figure?
a. The transport of K+ into the cell does not require energy in the form of ATP.
Should not have been checked.
b. The transport of H+ into the cell requires energy in the form of ATP.
Should not have been checked.
c. The transport of K+ out of the cell occurs by facilitated diffusion.
Should have been checked.
d. The transport of Cl- out of the cell does not require energy in the form of ATP.
c

The figure shows the movements of hydrogen ions (H+), potassium ions (K+), sodium ions (Na+), chloride ions (Cl-), and sucrose molecules through a cell membrane. The relative concentrations of each ion or molecule (high or low) are provided in the figure.
Which statement accurately describes the transport shown in the figure?
a. The transport of K+ into the cell does not require energy in the form of ATP.
Wrong answer.Should not have been checked.
b. The transport of Na+ out of the cell does not require energy in the form of ATP.
Should have been checked.
c. The transport of sucrose out of the occurs by facilitated diffusion.
Should not have been checked.
d. The transport of Cl- into the cell does not require energy in the form of ATP.
b

The figure shows the movements of sucrose molecules and sodium ions (Na+) through a cell membrane. The type of transport (active vs. passive) is labeled above each protein.
The table shows four scenarios in which the concentration gradients of sodium ions (Na+) and sucrose molecules differ between the outside and the inside of the cell.
Which scenario is most likely given the function of the transport proteins shown in the figure?
a. Scenario 1
Should not have been checked.
b. Scenario 2
Should have been checked.
c. Scenario 3
Wrong answer.Should not have been checked.
d. Scenario 4
b

The figure shows a cell membrane with three different transport proteins (labeled A, B and C). The type of transport (active or passive) is labeled above each protein.
Given the function of proteins A and B, predict whether protein C is an ATPase pump engaged in active transport or a channel engaged in facilitated diffusion.
a. Protein C is an ATPase pump engaged in active transport.
Wrong answer.Should not have been checked.
b. Protein C is a channel engaged in facilitated diffusion.
Should have been checked.
c. There is insufficient information to determine the function of protein C.
b

The figure shows a cell membrane with an ATPase pump that transports hydrogen ions (H+) and a symporter protein that transports sucrose and H+. The ATPase pump maintains a greater concentration of H+ outside the cell than inside the cell. The symporter maintains a greater concentration of sucrose inside the cell than outside the cell.
Note: This information is repeated for question 2.
Which condition would increase the rate at which sucrose enters the cell?
a. Decreasing the concentration of sucrose outside the cell.
b. Increasing the concentration gradient of H+ such that the concentration outside the cell greatly exceeds the concentration inside the cell.
c. Increasing the concentration gradient of H+ such that the concentration inside the cell greatly exceeds the concentration outside the cell.
d. Reducing the concentration of ATP inside the cell.
b

The figure shows a cell membrane with an ATPase pump that transports hydrogen ions (H+) and a symporter protein that transports sucrose and H+. The ATPase pump maintains a greater concentration of H+ outside the cell than inside the cell. The symporter maintains a greater concentration of sucrose inside the cell than outside the cell.
Which statement accurately describes how the transport of sucrose would change if H+ channels were added to the membrane?
a. The H+ channels would decrease the concentration gradient of protons, slowing the transport of sucrose into the cell.
b. The H+ channels would increase the concentration gradient of protons, speeding the transport of sucrose into the cell.
c. The H+ channels would not affect the rate at which sucrose is transported into the cell.
___________________________________
Material is protected by copyright.
a

The figure shows a cell membrane with three types of proteins (labeled 1, 2, and 3). Collectively, these proteins maintain concentration gradients of potassium ions (K+), hydrogen ions (H+), and glucose molecules. The relative concentrations of these ions or molecules (low or high) are provided in the figure.
The table shows three descriptions (Row A, B, C) of the function of each protein.
Note: This information is repeated for questions 4 through 6.
Which row in the table accurately describes the functions of Proteins 1, 2, and 3 shown in the figure?
a. Row A
b. Row B
c. Row C
b

The figure shows a cell membrane with three types of proteins (labeled 1, 2, and 3). Collectively, these proteins maintain concentration gradients of potassium ions (K+), hydrogen ions (H+), and glucose molecules. The relative concentrations of these ions or molecules (low or high) are provided in the figure.
The table shows three descriptions (Row A, B, C) of the function of each protein.
Which statements accurately describe how the rates of transport would change if the concentration of H+ inside the cell increases? Select all that apply.
a. K+ would be transported out of the cell at a faster rate.
b. K+ would be transported out of the cell at a slower rate.
c. Glucose would be transported into the cell at a faster rate.
d. Glucose would be transported into the cell at a slower rate.
a,c

The figure shows a cell membrane with three types of proteins (labeled 1, 2, and 3). Collectively, these proteins maintain concentration gradients of potassium ions (K+), hydrogen ions (H+), and glucose molecules. The relative concentrations of these ions or molecules (low or high) are provided in the figure.
The table shows three descriptions (Row A, B, C) of the function of each protein.
Which statements accurately describe how the system would change if the concentration of ATP in the cell decreases? Select all that apply.
a. The concentration gradient of H+ would increase.
b. The concentration gradient of H+ would decrease.
c. K+ would be transported out of the cell at a faster rate.
d. K+ would be transported out of the cell at a slower rate.
e. Glucose would be transported into the cell at a faster rate.
f. Glucose would be transported into the cell at a slower rate.
b,d,f

The figure shows a cell membrane with three types of proteins (labeled 1, 2, and 3). Collectively, these proteins maintain concentration gradients of potassium ions (K+), hydrogen ions (H+), and glucose molecules. The relative concentrations of these ions or molecules (low or high) are provided in the figure.
The table shows three descriptions Row A, B, C) of the function of each protein.
Which statements accurately describe how the system would change if H+ channels were added to the membrane? Select all that apply.
a. The concentration gradient of H+ would increase.
b. The concentration gradient of H+ would decrease.
c. K+ would be transported out of the cell at a faster rate.
d. K+ would be transported out of the cell at a slower rate.
e. Glucose would be transported into the cell at a faster rate.
f. Glucose would be transported into the cell at a slower rate.
b,d,f

People with diabetes have an elevated concentration of glucose in their blood and urine. Normally, 100% of glucose in the urine is reabsorbed back into the blood prior to excretion.
The top figure shows the tubular cell of a kidney and the system of transport proteins involved in the reabsorption of glucose. At the bottom of the figure, the relative concentration gradients of glucose, sodium ions (Na+) and potassium ions (K+) are provided.
The bottom figure shows four hypothetical relationships between the concentration of glucose in the blood and the rate at which glucose moves through the sodium/glucose symporter (SGLT).
Which line accurately describes the relationship for the transport system in the kidney?
a. Line A
b. Line B
c. Line C
d. Line D
a

Which relationship(s) depends on the activity of the sodium/glucose antiporter (SGLT) protein? Select all that apply.
a. purple line (filtered glucose)
b. green line (reabsorbed glucose)
c. blue line (glucose in urine)
b,c

Which patterns would occur if the concentration of glucose in the blood was elevated by diabetes?
a. The concentration gradient of glucose between the urine to the tubular kidney cell would decrease.
b. The activity of the sodium/glucose symporter would decrease.
c. The concentration gradient of Na+ between the tubular cell and the blood would decrease.
d. The concentration gradient of K+ between the tubular cell and the blood would decrease.
e. The tubular lumen would contain more glucose than the sodium/glucose symporter (SGLT protein) can transport.
e

A patient with diabetes can be treated with a drug that inhibits the function of sodium/glucose symporters (SGLT proteins). Which patterns would occur if the activity of SGLT proteins was inhibited? Select all that apply.
a. Na+ would be transported at a faster rate.
b. Na+ would be transported at a slower rate.
c. The rate of Na+ transport would not change.
d. K+ would be transported at a faster rate.
e. K+ would be transported at a slower rate.
f. The rate of K+ transport would not change.
g. Glucose would be transported at a faster rate.
h. Glucose would be transported at a slower rate.
i. The rate of glucose transport would not change.
j. The amount of glucose in urine would increase.
k. The amount of glucose in urine would decrease.
l. The amount of glucose in urine would not change.
m. The amount of glucose reabsorbed into the blood would increase.
n. The amount of glucose reabsorbed into the blood would decrease.
o. The amount of glucose reabsorbed into the blood would not change.
p. The amount of glucose in the blood would increase.
q. The amount of glucose in the blood would decrease.
r. The amount of glucose in the blood would not change.
b,e,h,j,n,q