Module 5: Long-Run Aggregate Supply & Aggregate Demand
1/30
There's no tags or description
Looks like no tags are added yet.
Name | Mastery | Learn | Test | Matching | Spaced | Call with Kai |
|---|
No analytics yet
Send a link to your students to track their progress
31 Terms
Long-Run Aggregate Supply Curve (LRAS)
LRAS represents the total quantity of goods and services that an economy can produce when resources are fully employed.
It reflects sustainable production levels, assuming:
All prices adjust
Labor, physical capital, and other resources are efficiently used
(T/F): The price level has a significant affect on LRAS
FALSE - the price level has NO AFFECT on LRAS
Is Price Level a GDP Deflator? (Explain Why or Why Not)
Yes - Price Level is the broadest GDP Deflator as it covers how all prices in an economy move
What is the X axis of the LRAS Supply Curve?
Real GDP
What is the Y axis of the LRAS Supply Curve?
Price Level
What direction does the LRAS Run? And Why?
Vertically - this shows that in the long run, output depends on resources and technology - not prices
What does it mean when Markets are in equilibrium?
All markets in the economy - labor, goods, and capital are balanced. This means no one has an incentive to change prices or output.
Unemployment is at a natural rate (Full employment)
What does the LRAS represent?
Potential Real GDP, NOT MAXIMUM
How is long run growth shown by the LRAs
By an outward shift of the LRAS
increase shifts it to the right
decreases shifts it to the left
What causes the LRAS to shift?
POLE
+/- Labor (L)
+/- Other resources, past actions, and capital (O)
+/- Technology (P)
+/- Productivity (P)
+/- Human Capital and Education (E)
What is the Aggregate Demand Curve?
It shows planned purchase rates for all goods and services at various price levels with all other things held constant
Aggregate Demand Curve Equation
Consumption + Investment + Government Spending + Net Exports (Exports - Imports)
What is the shape of the Aggregate Demand Curve
It is downward sloping, because as price level rises, real GDP demand declines
What direction does the AD shift if a non-price level change increases aggregate domesting spending?
Right
What direction does the AD shift if a non-price level change decreases aggregate domestic spending
Left
What direction does AD shift if prices change?
It does not shift - it just moves along the AD line
What factors increase Aggregate Demand right?
Improvements in Economic conditions abroad → More exports
Decreased Value of Currency → More exports (things become cheaper for other countries so they buy more)
Increased Job Security and/or increased future income
Reduction in Real Interest Rates → higher consumption
Tax decreases → Higher consumption and investment
Increase in Money Circulated → impacts everything
How did you figure out the Equilibrium Price level>
It is where the LRAS and AD intersect
real expenditures for the economy are equal to potential production (GDP)
What is Secular Deflation and what causes it?
An increase in LRAS - this will result in a decrease in the price level in the long run
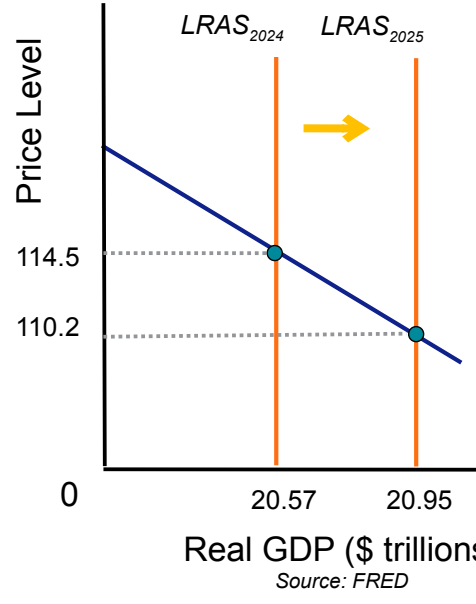
Explain what happens to GDP and Price level when the lRAS shifts right
DEFLATION
GDP: increases
Price Level: decreases
What happens to an economy that experiences a leftward shift in LRAS?
INFLATION
Price level: INCREASES
GDP: DECREASES
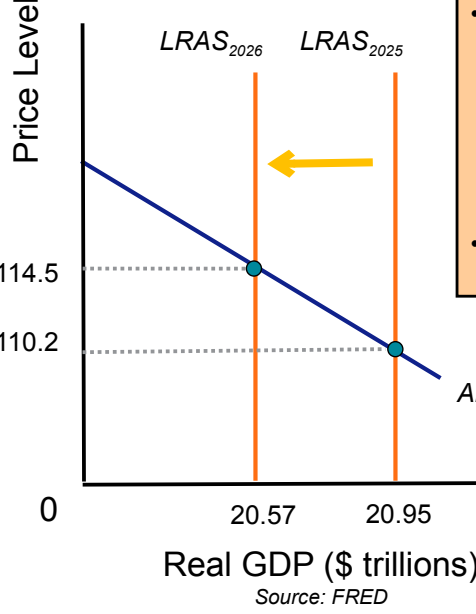
When LRAS shifts [RIGHT/LEFT], inflation occurs
Left
When LRAS shifts [RIGHT/LEFT], deflation occurs
Right
Explain what happens to Price Index and GDP when AD shifts right
Price Index: Increases
GDP: Remains the same
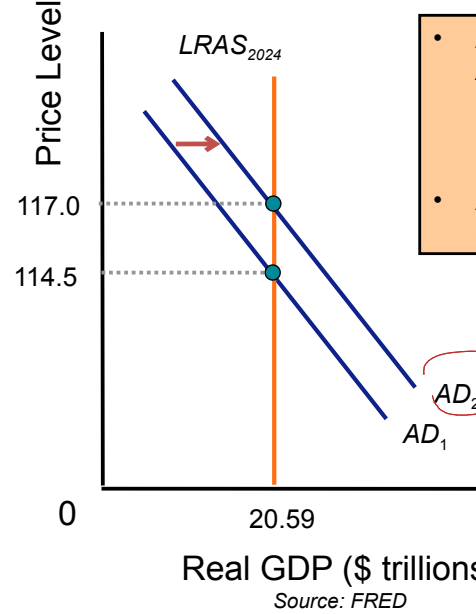
When AD shifts [RIGHT/LEFT], inflation occurs
Right
When AD shifts [RIGHT/LEFT], deflation occurs
Left
Explain what happens to Price Index and GDP when AD shifts left
Price Level: Decreases
GDP: Remains the same
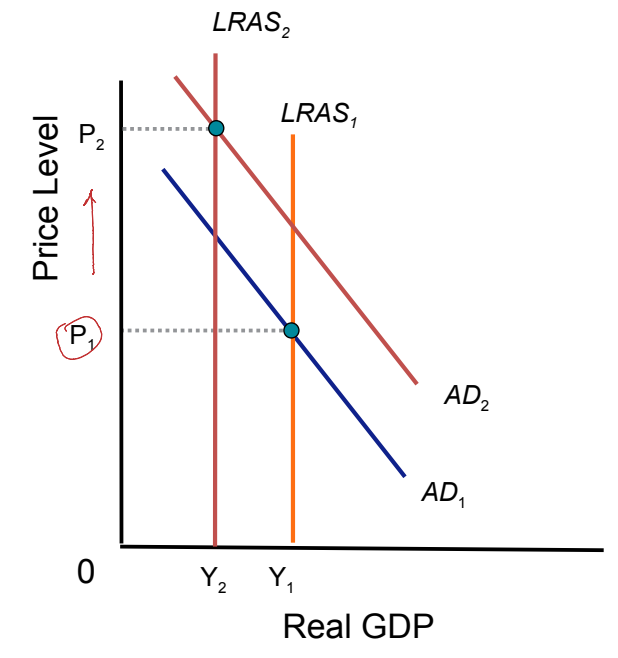
When both the LRAS and AD shift, where do you find the new equilibrium?
Where the NEW LRAS and AD intersect
(T/F): When the LRAS and AD shifts, changes in potential GDP are always clear
TRUE
When both LRAS and AD shift, when is it CLEAR to see the long run prices?
When the AD and LRAS move DIFFERENT DIRECTIONS
AD Right, LRAS left
AD Left, LRAS right
When both LRAS and AD shift, when is it INDETERMINATE to see the long run prices?
When AD and LRAS move the same direction
AD Right, LRAS Right
AD Left, LRAS Left