Research Methods & Statistics sem 1 '26
 Call Kai
 Learn
Learn Practice Test
 Spaced Repetition
 Match
Match Flashcards
 Knowt Play
1/82

There's no tags or description
Looks like no tags are added yet.
Name | Mastery | Learn | Test | Matching | Spaced | Call with Kai | Chat |
|---|
No analytics yet
Send a link to your students to track their progress
83 Terms
What are the three main components for answering a statistical question and what do they entail?
1) experimental design (research methods)
2) descriptive statistics (summarize data of a sample)
3) interference statistics (make predictions about population)
What are three types of measure in psychology and are they subjective or objective?
1) self-report (e.g. questionnaire); subjective
2) observational (observing participants); subjective or objective
3) physical (e.g. heartrate); objective
What is the difference between reliability and validity and what do they entail?
reliability; how consistent (similar results or variability?) is the measure and does it contain measurement error (random noise)
validity; does the instrument measure what it is supposed to measure (does it correspond with conceptual variable?)
What are the three types of reliability?
1) test-retest; correlation between test and retest
2) interrater; correlation between different raters
3) internal; cronbach’s alpha, correlation between different items (does someone score the same on item 1 as on item 2?)
Average inter-item correlation (AIC)
a measure of internal reliability for a set of items; it is the mean of all possible correlations computed between each item and the others
What are the three levels of quantitive variables?
1) ordinal; a ranked order in which distances between levels are not equal
2) interval
3) ratio
What are the 5 types of construct validity and are they subjective or objective?
subjective;
1) face; does the measure seem a good way to test the construct
2) content; does the measure cover all the aspects of the construct
objective;
3) criterion; does the test correlate with an observable criterion
4) convergent; is the test associated with other tests that measure the same construct
5) discriminant; is the test more strongly associated with a test that measure another construct or a test that measure the same construct
What is the problem with measuring something by self-report, observation or physically?
self-report; biases influence the results (e.g. availibilty heuristic) , people use shortcuts and formulation of questions/answers has influence
observation; biases influence the results (e.g. confirmation bias)
physical; lie detector test not reliable
Meta-analysis
way of mathematically averaging the effect sizes of all the studies that have tested the same variables to see what conclusion that whole body of evidence supports
Construct
psychological attribute which is not directly observable
Effect size
the magnitude, or strength, of a relationship between two or more variables
Confederate
an actor who is directed by the researcher to play a specific role in a research study
What is disinformation and and what are two critical reading techniques to spot it?
disinformation; news that is deliberately created to mislead or provoke
click restraint (pause) and lateral reading (checking claims on alternative, legitimate news sources)
What are two ways to gain knowledge?
1) Scientific research
2) Everyday methods; experience, intuition & authority
What are two problems with using experience to gain knowledge?
you cannot isolate variables, thus confounding variables could be present
no comparison group
What are the 5 biases when using intuition to gain knowledge?
good story bias; people tend to believe good stories
availibility heuristic; incorrectly estimating the frequency of something, relying on instances that easily come to mind rather than using all possible evidence
present-present bias; seeing a connection between two things that isn’t there
confirmation bias; seeking out evidence that confirms initial ideas and failing to seek out evidence that can disconfirm them
bias blind spot; thinking you are less biased than others
What are the two types of inference and what do they entail?
deductive; general claim to to specific observation (all dogs bark- bobby is a dog so he barks)
inductive; specific observation to general claim (‘all swans are white’)
What are the steps of the empirical cycle and what do they entail?
observation (specific)
induction; coming up with a theory that explains observation
theory (general)
deduction; deriving a hypothesis from your theory
prediction; event that will occur if your hypothesis is true (specific)
testing
results
evaluation
What are the four methods to correct research?
1) peer review
2) statistical testing (observation a coincidence?)
3) replication
4) control & random groups
What is falsifiability and why does a theory need to be falsifiable?
falsifiability; it needs to be possible to observe something that contradicts the theory
if a theory is not falsifiable then it has to be rejected
What are two problems with using authority to gain knowledge?
you don’t know how the person got the knowledge and shouldn’t believe them just because of their status
What are confounds and how do you control for those?
confound; another variable C that gives an alternative explanation for the relation between X and Y
by randomized sample and a control group
What are Merton’s four scientific norms?
universalism One of Merton’s four scientific norms, stating that scientific claims are evaluated according to their merit, independent of the researcher’s credentials or reputation. The same preestablished criteria apply to all scientists and all research. See also communality, disinterestedness, organized skepticism communalatyOne of Merton’s four scientific norms, stating that scientific knowledge is created by a community, and its findings belong to the community. See also disinterestedness, organized skepticism, universalism. disinterestedness One of Merton’s four scientific norms, stating that scientists strive to discover the truth whatever it is; they are not swayed by conviction, idealism, politics, or profit. See also communality, organized skepticism, universalism. organized skepticism One of Merton’s four scientific norms, stating that scientists question everything, including their own theories, widely accepted ideas, and “ancient wisdom.” See also communality, disinterestedness, universalism
What are two types of researchers and what are their goals?
applied; find a solution to a particular real-world problem
basic; enhance the general body of knowledge, without regard for direct application to practical problems
Self-correcting process
a process in which scientists make their research available for peer review, replication, and critique, with the goal of identifying and correcting errors in the research
Weight of the evidence
a conclusion drawn from reviewing scientific literature and considering the proportion of studies that is consistent with a theory
Preregistered study
a term referring to a study in which, before collecting any data, the researcher has stated publicly what the study’s outcome is expected to be
Reflexivity
a process in which researchers reflect on how their own values, biases, and experiences might shape the topics they study and the interpretations they make
Operationalizing
determining how the conceptual/construct variables in the hypothesis are measured or manipulated
What are three ways to be open in science?
1) transparency; e.g. describe choices and share code
2) sharing drafts/articles online
3) sharing findings through media, conferences and teaching
What are the two types of statistics and what do they measure?
descriptive (median, modus & mean) & inferential (standard deviation, margin of error) statistics
What are the two types of variability and what do they entail?
within sample variability (differences in one sample) & between sample variability (differences between samples)
What is the difference between a subject, sample and population?
subject= individual entities that are measured
sample= multiple subjects from a population
population= all the subjects of interest
What is the difference between a sample statistic and population parameters?
sample statistic= numerical summary of sample (measured)
population parameter= numerical summary of population (estimated based on sample)
What is the margin of error and how do we make it smaller?
% that sample statistic is off in comparison to population parameter(e.g. 3% margin in sample of 58%, population: 55-61%), decreases with bigger sample size
What are the two types of variables and what levels do they contain?
- quantitative (numerical); discreet (whole numbers) & continous (any value)
- categorical; nominal (no ranking) & ordinal (certain order)
What is the difference in graphs used for the two types of variables?
- quantitative; histogram, dot plot or stem-leaf plot
- categorical; bar or pie (less objective) chart
What is the difference between a histogram and a bar chart?
- histogram; quantitive data (intervals), more bars
- bar chart; categorical data, bars are separated
What is the difference between a histogram and a continuous distribution?
- histogram; sample
- continuous distribution; population (n>)
What is the difference in mean and median on skewed and symmetrical distributions?
- symmetrical; mean = median
- left-skewed; mean
Do extreme outliers affect the mean or medium more and why?
the mean, because the median is based on numerical order; thus not affected by extreme values
What are the four measures of variability?
Why is random sampling important?
so the sample is representative of and results can be generalized to the population
What are the two types of probability and what do they entail?
1) long - run probability; more trials cause probability to be less unpredictable and random than with few trials (short-run)
2) personal probability; degree of belief that the outcome will occur based on available information (Bayesian)
How do you calculate the range of a distribution?
max. value - min. value
What do the variance and standard deviation of a distribution mean?
variance (s^2)= how much values differ from each other (high= more variability)
standard deviation (s)= distance between values and the mean (= deviation) on average
What does the emprical rule of a bell shaped curve entail?
- the mean +- s = 68% of data
- the mean +- 2s = 95% of data
- the mean +- 3s = 100% of data
How do you write the mean and standard deviation differently for sample statistics and population parameters?
- sample statistics: x with - and s
- population parameters: mu and sigma
What do Q1, Q2, Q3 and IQR entail?
In boxplot:
- Q1= 25% of values (median of lower half)
- Q2= 50% of values (median of all)
- Q3= 75% of of values (median of upper half)
- IQR= Q1 to Q3; middle half of data
How do you spot an outlier in a normal distribution or boxplot?
- normal distribution: more than 3 standard deviations removed from mean (= z > 3)
- boxplot: more than 1.5 IQR removed from median (= Q1 - 1.5 IQR or Q3 + 1.5 IQR )
What does the z-score mean?
how many standard deviations a value is removed from the mean (negative=lower, positive=higher)
What is always the mean and standard deviation of a z-score?
mean= 0
standard deviation= 1
Why do we standardize variables and how?
when you want to compare two groups but their values are too different, by calculating their z-scores (mean/sd) (and sometimes combining them)
What is a linear transformation?
recalculating data to change the measure of units (e.g. from inches to centimeters)
How do you calculate the new mean, standard deviaton, IQR or median of a linear transformation if a price goes up by 10% or $10 gets added to it?
1) + 10%;
- y(mean) = c + dx= 0 + 1.1x
- sd (or IQR)= d x sd= 1.1 sd (or IQR)
- median stays the same
2) + $10;
- y(mean) = c + dx= 10 + x
- sd/IQR stays the same
- median = c + d = 10 + median
How do you measure the association between two categorical variables?
contingency table (explanatory variable on top);
- conditional proportions
- difference in proportions between two explanatory variables (n percentage points higher than..)
- ratio (n times more likely to/ n procent higher..)
How do you measure the association between two quantitative variables?
scatterplot;
- correlation coefficient r
- positive/negative z-score based on quadrants (top right and bottom left= ZxZy>0 and vice versa)
In a scatterplot/ the formula of correlation coefficient r, what do the variables x and y mean?
- x = explanatory variable
- y = response variable
What is the difference between response and explanatory variables?
- response; outcome (dependent)
- explanatory; prediction (independent)
2 response variables can occur (e.g. weed and alcohol intake; don't know which one explains the other)
Conditional proportion
proportion of response variable for one level of the explanatory variable
What does the correlation coefficient entail?
-1 < r < 1
1= positive slope (ZyZx > 0)
0= no association
-1= negative slope (ZyZx < 0)
outliers = less strength/closer to 0
In a scatterplot/ the formula of correlation coefficient r, what do the variables x and y mean?
- x = explanatory variable
- y = response variable
Law of large numbers
the more trials you have, the more likely a proportion of occurences of an outcome approaches a given number (e.g. 1/6 chance of throwing a 6 with a dice when doing 100 trials ipo 10 trials)
What is the difference between an event and a sample space?
- event; subset of sample space (one possible outcome, e.g. throwing a 6 with dice)
- sample space; all possible outcomes (throwing a 1,2,3,4,5 or 6 with dice)
What is the complement of an event?
everything but the event (e.g. throwing everything but a 6)

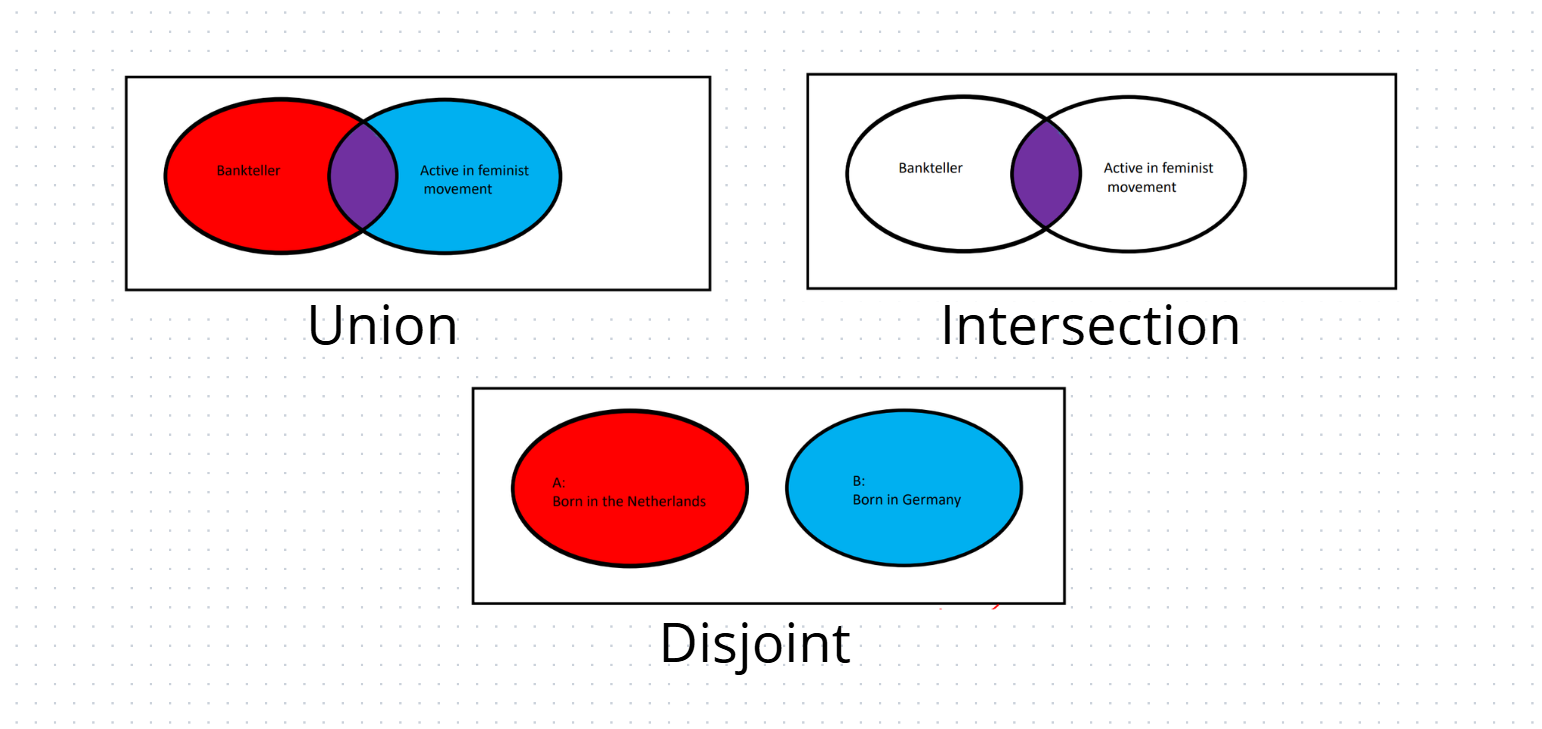
What is the difference between disjoint events and intersection/union of events?
disjoint; two events do not occur at the same time (dependent on each other) and have no outcomes in common
intersection; two events both occur at the same time and have all outcomes in common
union; two events occur seperately from each other or together and have some outcomes in common
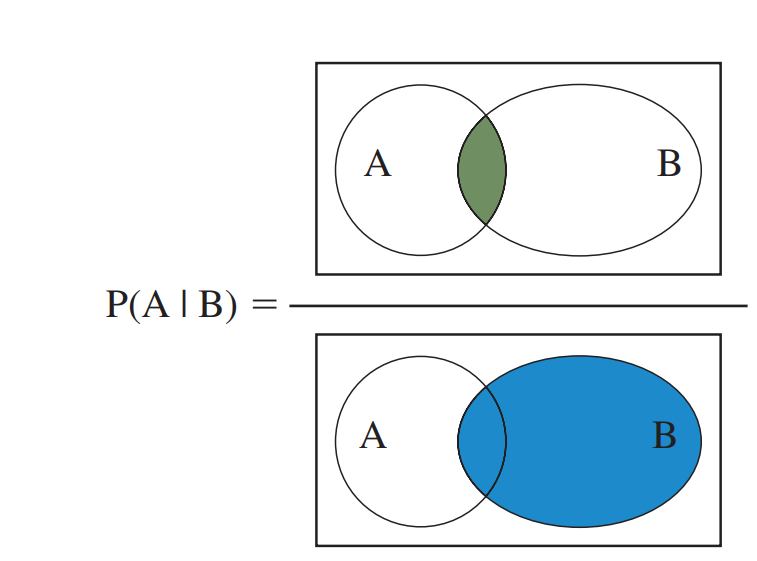
Conditional probability
chance of an event when another has already occured
What is the difference between disjoint events and independent events?
- independent; events do not rely on each other (outcome of one does not influence outcome of other, e.g. throwing with a dice)
- disjoint (dependent); events rely on each other (outcome of one influences the outcome of the other, e.g. someone’s nationality)
How do we make trials independent in a large and small population?
-large; random sample (without replacement)
-small; random sample with replacement
What is the difference between sampling with and without replacement and when is it used?
with replacement (in small sample); conditional probability is the same with each new trial (trials are independent)
without replacement (in small sample); conditional probabilty changes with each trial (trials are dependent)
without replacement (in big sample); conditional probaiblity is the same with each ne (trials are independent)
Probability model
model that shows sample space (all possible outcomes) and the assumptions on which probability calculations are based
Is coincidence an unusual event and why (not)?
coincidence is not an unusual event, because if the amount of opportunities is big there is a high chance of a coincident happening (law of large numbers)
Bayes' rule
last formula on formula sheet; sensitivity x prevalence / zelfde als teller + (1 - specificity x 1 - prevalence)
Gambler fallacy
the belief that the frequency of outcomes impact the probabilty of the next trial (e.g. no one has won in a casino for a long time, so probability of winning in next trials is higher (false!))
How do you check if two events are dependent or independent in a contingency table?
Independent if;
P(A given B) = P(A)
P(B given A) = P(B)
P(A and B) = P(A) x P(B)
What is the difference in probability for a short and long run?
probability approaches a given number in long runs (more trials)
Base rate neglect
ignoring the fact that P(A I B) is not the same as P(B I A)
Base rate
prevalence of something occurring (e.g P(ADHD)= 0.045)
What are the three methods used to calculate conditional probability?
1) tree diagram
2) Baye’s theorem
3) contingency table
Monty Hall problem
problem explaining Baye’s theorem; 3 doors; 2 goats and 1 car, most of the time switching doors results in winning the car (because probabilty of goat goes down)
What is the difference between calculating sensitivity anbd specifity in conditional probability?
sensitivity; P(POS I S) ) state tested for is present and the test is positive
specificity; P(NEG I Sc) state tested for is not present and the test is negative