Term 3 - 2.1 Individuals, Populations, Communities, and Ecosystems
 Call Kai
 Learn
Learn Practice Test
 Spaced Repetition
 Match
Match Flashcards
 Knowt Play
1/38

There's no tags or description
Looks like no tags are added yet.
Name | Mastery | Learn | Test | Matching | Spaced | Call with Kai | Chat |
|---|
No analytics yet
Send a link to your students to track their progress
39 Terms
Subspecies (5)
Subspecies:
Sometime organisms overlap geographically
Can share genes, but they usually don't
E.g. Tigers
Are still technically the same species genetically, they just occupy different habitats
Don't reproduce, but are able to
Ring Species (4)
Ring species:
E.g. Species of salamander that live in overlapping populations of subspecies on either side of the San Joaquin valley
Those subspecies can all interbreed, except for two
At the southern part of the ring, two subspecies can't interbreed
Though, genes can still flow between them indirectly
2.1.1 Key Elements of the Biosphere (4)
2.1.1 Key Elements of the Biosphere:
Individual: One living organisms
Population: Group of the same species living in a species area
Community: populations of different species interacting
Ecosystem: Community + physical environment
2.1.19 Components of Habitat (3)
2.1.19 Components of Habitat:
Geographical location: the broader physical area where the species is found, such as a specific forest, river, mountain range, or coastal area
Physical conditions: climatic and environment conditions
Ecosystem type: The specific type of ecosystem—whether it be a desert, wetland, forest, grassland, or coral reef—provides the structural framework of the habitat
2.1.2 Species Model 1 (2)
2.1.2 Species Model:
The species model, often used in environmental studies and conservation, involves focusing on dividual species for protection and management
While this approach has its merits, it also has several problems and limitations
2.1.2 Species Model 2 (4)
Narrow focus: biodiversity is overlooked, ecosystem interactions are ignores
Resource allocation: funding and effort imbalanced, inefficiency in funds
Ecological complexity: species may not exist or keystone species misidentification
Climate change adaptation: does not account for the dynamic nature of ecosystems, adaptation needs are not met
2.1.2 Species Model 3 (4)
Ethical considerations: the model can reinforce an anthropocentric views prioritising certain species can lead to conflicts with local communities
Policy and legislation: conservation laws and policies often target specific species and create fragmented approaches
Short-term focus: prioritise immediate conservation actions over long-term ecological health, potentially ignoring factors like genetic diversity and ecosystem resilience
Sustainability: ensuring the sustainability of species populations often requires addressing broader environmental issues such as habitat destruction, pollution, and climate change, which the species model may not fully encompass
2.1.3 Classification (1 + 8)
2.1.3 Classification:
The classification of organisms is known as taxonomy
Domain
Kingdom
Phylum
Class
Order
Family
Genus
Species
2.1.26 Cladogram (4 + 4)
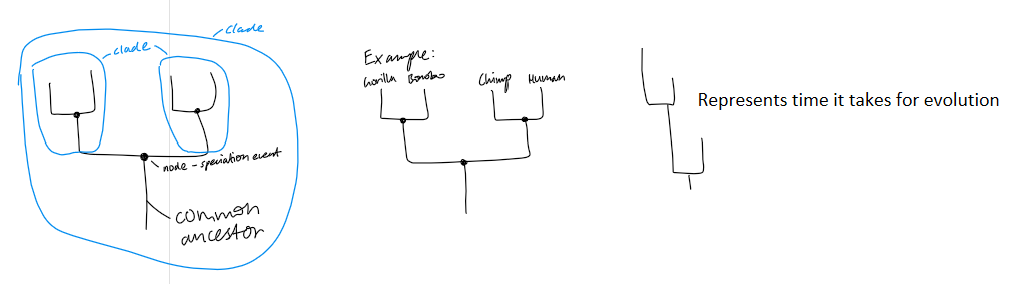
2.1.26 Cladogram:
Cladistics: method of classification mapping evolutionary lineages
Focuses on relationships within a clade: a group of organisms including an ancestor and all its descendants
Represents a single branch on the tree of life, enhancing understanding of species evolution
A cladogram not only illustrates evolutionary relations and common ancestors, but it also helps taxonomists to test the hypothesis of adaptation phenomenon by showing the:
Origin of the characteristics
Disappearance and formation of characteristics
Direction of change of characteristics
Relative frequency of the change
2.1.26 Benefits of Cladistic Classification (3)
2.1.26 Benefits of Cladistic Classification:
Improve Accuracy: Cladistics accurately depicts evolutionary relationships by emphasising descent from common ancestors over superficial trats
Uncovering True Lineages: Genetic and biochemical advances have corrected misclassifications (e.g. red panda) through refined cladistics analyses
Detailed Evolutionary Insights: Cladograms trace trait origins modifications, and extinctions within lineages, deepening understanding of adaptive changes over time
2.1.11 Density-Dependent Factors (6)
Density-dependent: factors that inhibit growth because of the environment; the more individuals, the greater the impact these will have; individuals have to compete for density-dependent facts; prevent populations from going beyond the carrying capacity; predators
2.1.11 Density-Dependent Factors:
Density-dependent factors: Limiting factors that contribute to determining carrying capacity while depending on the density of the population
Competition for resource
Predation and herbivory
Disease and parasites
Intraspecies interactions
Territoriality
2.1.11 Density-Independent Factors (6)
Density-independent: has nothing to do with the no. of individuals in a population; natural disasters such as floods, drought, forest fires
2.1.11 Density-Independent Factors:
Density-independent factors: Unlike density-dependent factors, these limiting factors affect the population regardless of its size
Climate and weather
Natural disasters
Habitat destruction
Availability of abiotic factors
Human activities
2.1.12 J Curves (2)
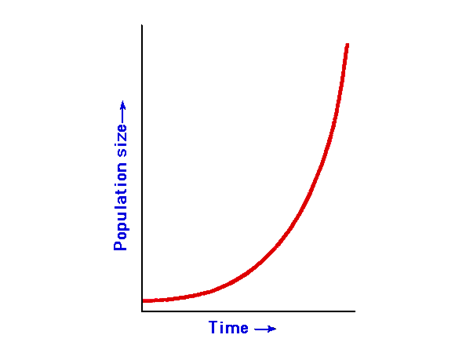
Exponential growth is seen in new populations - J shaped curve
2.1.12 J Curves:
This type of growth assumes unlimited resources, no competition, and no other environmental constraints
Under these ideal conditions, every individual has the same chance of surviving and reproducing, leading to rapid population increases
2.1.12 S Curves (4)
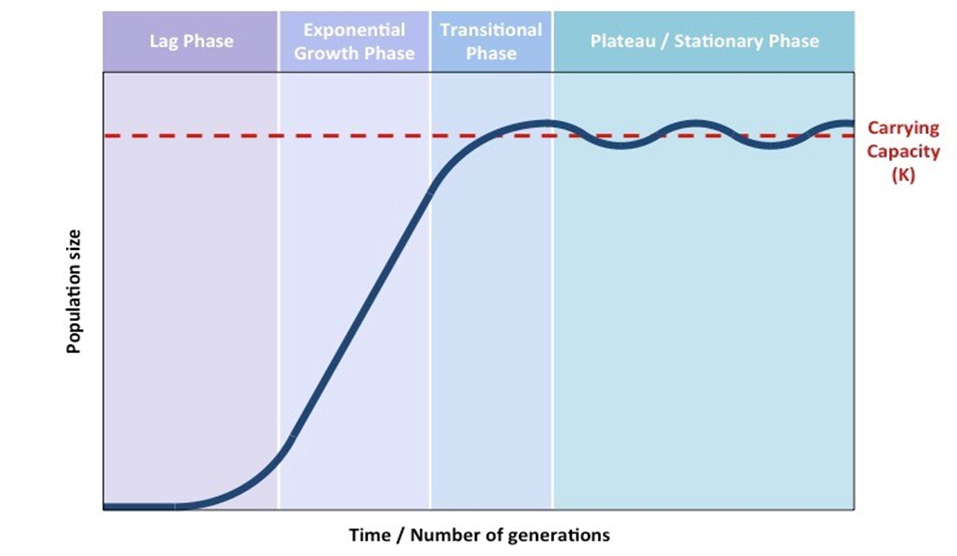
Logistical growth - S shaped curve
2.1.12 S Curves:
When resources are limited - they are limiting factors
Exponential growth is only possible for a short period of time because as the population grows resources are depleted and the growth rate slows and will eventually plateau off
This type of curve is typical of k-strategists
As the population approaches its carrying capacity, density-dependent factors such as competition for food, predation pressure, and disease prevalence increase, slowing down the growth rate and stabilizing the population size

2.1.12 Boom and Bust Cycles (1)
2.1.12 Boom and Bust Cycles:
Some populations exhibit "boom and bust" patterns, characterized by rapid increases in population size followed by sudden declines, often well below the initial starting point
2.1.8 Ecological Niche (2)
2.1.8 Ecological Niche:
A niche describes the role an organism plays in its environment, including its interactions with other organisms, its habitat, and its diet
Encompasses the range of biotic and abiotic conditions that species needs to survive, grow, and reproduce
2.1.28 Fundamental and Realised Niche (3)
2.1.28 Fundamental and Realised Niche:
No two species can have the same ecological niche in the same place at the same time
Fundamental niche: the entire range of conditions in which a species could live
Realised niche: the actual conditions under which the species lives (usually due to competition)
2.1.23 Consequences of Losing Keystone Species (3)
2.1.23 Consequences of Losing Keystone Species:
Trophic Cascades: Removing a keystone predator can cause prey overpopulation, leading to overgrazing and ecosystem degradation (e.g., deer overgrazing without wolves)
Habitat Changes: Loss of key herbivores (e.g., elephants) alters ecosystems, promoting dense growth that impacts fire regimes and grasslands
Biodiversity Loss: Keystone species' extinction reduces ecosystem diversity by disrupting food webs, habitat formation, and population control
2.1.15 Random Sampling (1 + 3)
2.1.15 Random Sampling:
Need a map with a numbered grid
Random points
Random areas
Random lines
2.1.15 Random Sampling Advantages & Disadvantages (1 + 2, 1 + 2)
2.1.15 Random Sampling Advantages & Disadvantages:
Advantages:
Least biased method - every item has the same chance of being selected
Suitable for large populations
Disadvantages:
You may not have access to some of the sample points
In large study areas the sample points may miss some places
2.1.16 Quadrat Sampling (2)
2.1.16 Quadrat Sampling:
Quadrat sampling is a method to estimate the abundance of non-mobile species (e.g. plants, snails) by dividing the area into sections and counting organisms within random quadrats
Particularly useful in homogenous environments
2.1.16 Types of Quadrat Sampling (3)
2.1.16 Types of Quadrat Sampling:
Number of species - the number of plants within the given area of the quadrat (m2)
Frequency - how often does a plant occur in each quadrant
Population - the average number of individual organisms within the quadrat area
2.1.16 Population Density (3)
2.1.16 Population Density:
The number of individuals per unit area
Calculation: D = ni/A
D = density; n = number of individuals in species; A = sampling area
2.1.15 Line Transects (5)
Line transect: put down a line and record everything touching that line - organisms found at the regular sample points are recorded
2.1.15 Line Transects:
A measured line is randomly placed across the area in the direction of an environmental gradient
Systematic sampling method
A straight line that cuts through a natural landscape so that standardized observations and measurements can be made
All species touching the line are recorded along the whole length of the line or at specific points along the line
Measures presence or absence of species Usually every 1 meter
2.1.15 Belt Transects (2 + 2, 1)
Belt transect: put down a line and utilise quadrats to count at intervals - quadrates are placed at regular sample points and the abundance of the organisms within each recorded
Both these are used for things that do not move (or very slow organisms e.g. snails) - non-motile/sessile
2.1.15 Belt Transects:
Belt transect is a systematic sampling method
It is a rectangular area centred on a line that is set across an area having a clear environmental gradient
Slow moving animals (limpets, barnacles, snails) are collected, identified then released
For plants an percent coverage is estimated
Data collection should be completed by one individual as estimates can vary person to person
Ectothermic Organisms (1)
Ectothermic organisms are organisms whose temperature matches that of their environment - they cannot control their body temperature - have to live in an environment suited to them
Endothermic Organisms (1)
Endothermic - can regulate their body temperature
Carrying Capacity (1)
Carrying capacity: the no. of organisms that a habitat can sustain with the resources it has available
Interspecific Competition (1)
Interspecific competition - competition between different species
Intraspecific Competition (1)
Intraspecific Competition - competition between the same species
Niche differentiation/niche partitioning (1)
Niche differentiation is the evolutionary process where competing species use the environment differently, allowing them to coexist by reducing direct competition
Three Types of Ecological Outcomes from Competition (3)
Competition exclusion - Competitive exclusion (also known as Gause's law) is an ecological principle stating that two species competing for the exact same limited resources cannot stably coexist in the same place
Coexistence (e.g. barnacles)
Niche differentiation/niche partitioning (e.g. woodpecker - Different species of woodpeckers might live in the same forest, but one type hunts for bugs only at the very top of the trees, while another hunts only near the ground. They "partition" (divide) the tree so everyone gets to eat)
Starfish experiment
Only way to figure out if a species is a keystone species is by removing a species and seeing its effects
Robbert Paine threw a purple starfish from the rocks into the bay
Intertidal zones - ecosystem within the pool - he manipulates the starfish
Bottom-up control - number of producers is responsible for the diversity of the whole food web - not wrong but is incomplete - didn't explain how herbivore populations didn't just eat all of the producers
Top-down control - predators regulate populations of the prey
Food web is diverse because of both bottom-up control and top-down control
Green world hypothesis - predators make sure we don't have too many herbivores so that way we have enough producers
Paine started by identifying all organisms, starting mapping out who eats who
Pisaster ochraceus (purple starfish) was at the top of the food chain
They're eating mussels
Throw 60-70 feet out into the deep water
Within a year and a half, the ecosystem started changing - no. of species on the rock decreased from 15 to 8 - species richness decreased - biodiversity decreased
After three years went down to 7
After seven years resulted in monoculture - 1 species remaining - mussels
NEED TO KNOW THIS EXPERIMENT AS AN EXAMPLE
Keystone species are small in amount but have a disproportionately large effect on the ecosystem
Yellowstone wolves
Geography and rivers were changed by their removal
Widespread trophic cascade - ecological process which starts at the top of the food chain and tumbles down to the bottom
When you remove an apex predator the effect is seen in every trophic level underneath
Trophic cascade is top-down
Yellowstone national part in the US - wolves were introduced in 1995
This case study will also come into play in conservation ! - removed and brought back
Absent for 70 years - number of deer, because there was nothing to hunt them, built up
Deer eat grass and destroyed trees and vegetation because of their antlers - caused soil erosion - abiotic factors were affected - almost no trees and no grass - nothing to stabilise river bank
As soon as the wolves arrived, even though they were few in number, they killed deers and changed their behaviour - deer avoided certain parts of the park - those places started to regenerate - height of trees quintupled in just six years
Birds started moving in - organisms that moved away did, but now they returned
Number of beavers increased - are known as ecosystem engineers - make dams to control flow of water, preventing flooding in certain areas, create habitats and niches for other species
Wolves killed coyotes - no. of rabbits and mice began to rise --> more hawks, eagles
Bears population began to rise because there were more berries growing on the regenerating shrubs - bears reinforced wolves by killing calves of the deer
Wolves changed the behaviour of the rivers - began to meander less, less erosion, the channels narrowed, more pools formed (more habitat/niches for other organisms), more riffle sections
The regenerating forest stabilised the banks so they collapse less often
Wolves transformed not just the ecosystem, but also its physical geography
GOOD CASE STUDY TO USE !!
Bees and flowers
When flowers open up, bees are attracted by scent and colour and go and pollinate - but when flowers open up at the wrong time the bees cannot pollinate - bees go to the flower to eat and as a side effect they pollinate - pollen needs to be moved from male part of flower to female part of the flower - when the bee arrives on the flower the pollen gets stuck on the bee's hair - moves pollen from one flower to another - mutualism - have evolved together - loss of one species of bees affects one species of plant - every species of organism has a species of flower they pollinate - if one species of bees goes down, the flower they pollinate goes down too
Global warming - temps are rising - winters are decreasing, are not staying cold for long enough - flowers are flowering earlier - bees haven't cued up to that yet - flower dies before it's been pollinated
Climate change has altered the time of year plants flower
Flowers bloom earlier and flowering to end later - flowering season has extended - longer springs
All flower at the same time --> bees are confused --> survival of flowers and bees suffer
If bees are not able to feed from flowers they have historically in the past --> decline in populations of that flower
Fruits and vegs are going to decline
Intrinsic and aesthetic value of flowers will decline bc flowers are declining
Mark-recapture Technique (6)
Random sampling
Getting an estimate of the population
Step 1: Capture and count foragers
Step 2: Marking/tagging the foragers
Step 3: Release marked foragers - need to allow the marked foragers to mix back with the population
Step 5: Recapture and count more foragers
Step 6: Count how many of the recaptured foragers are marked
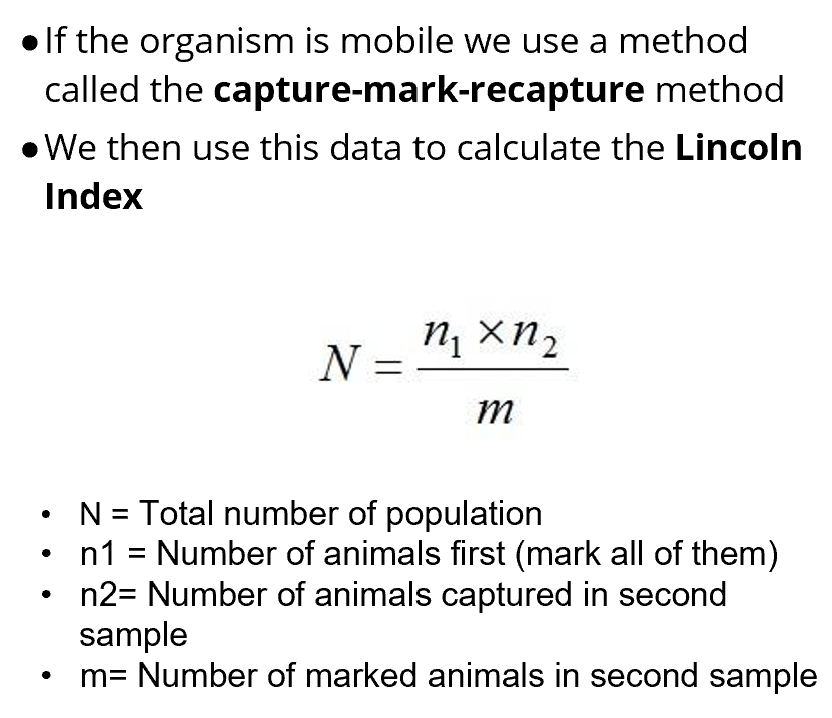
Population size estimate = (M x N)/R where M is the number of individuals caught and marked initially, N is the total number of individuals recaptured, and R is the number of marked individuals recaptured
Lincoln Index
Population size estimate = (M x N)/R where M is the number of individuals caught and marked initially, N is the total number of individuals recaptured, and R is the number of marked individuals recaptured
Branching Dichotomous Key

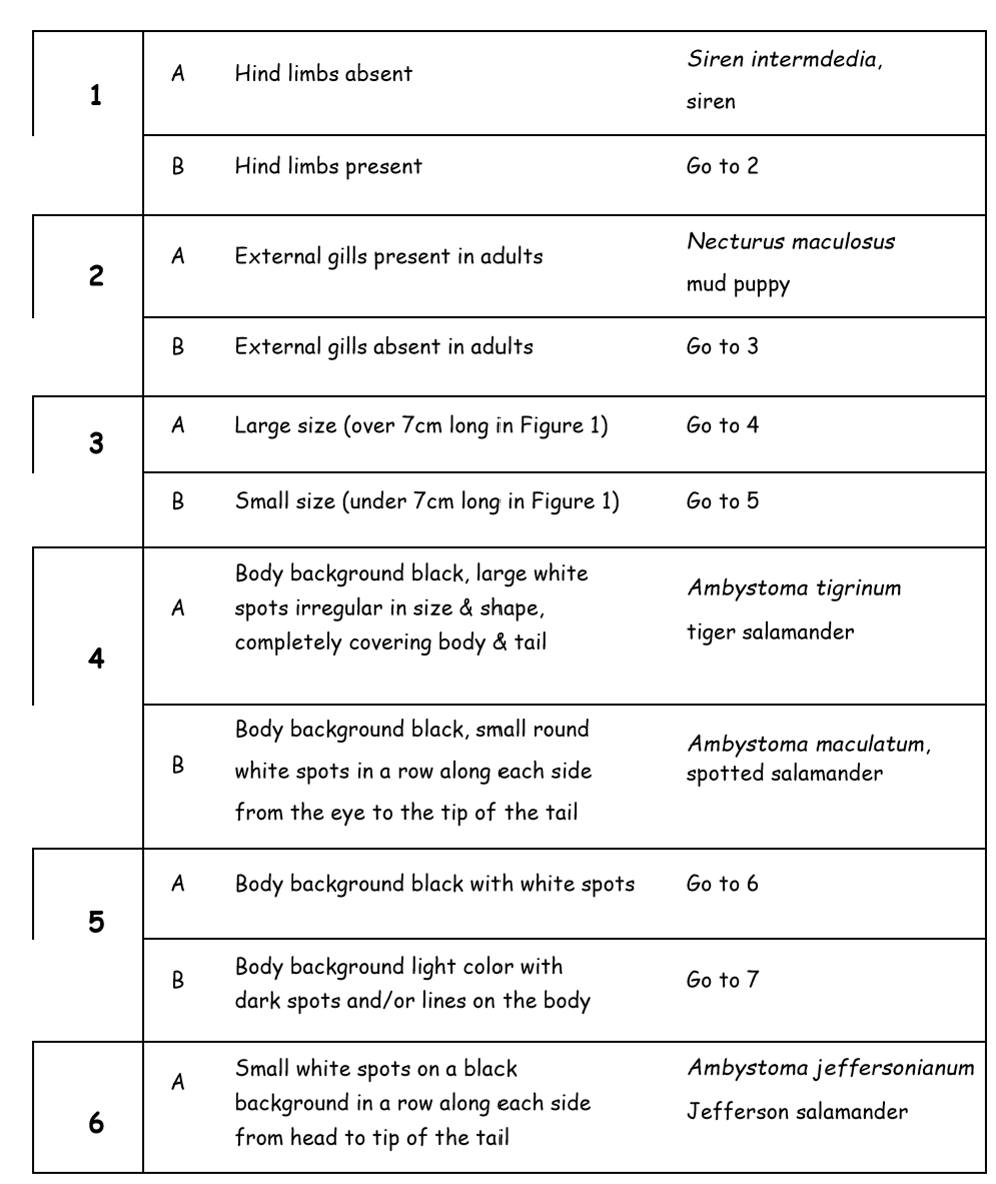
List Dichotomous Key