MICRO T8 - Distribution of Income
1/24
Earn XP
Name | Mastery | Learn | Test | Matching | Spaced | Call with Kai |
|---|
No analytics yet
Send a link to your students to track their progress
25 Terms
What is the difference between income and wealth?
Income is a flow of money going to factors of production
Wealth is the current value of a stock of assets owned by someone or society as a whole
What are some factors influencing inequality?
Skills bias arising from technological change – super-high pay for some people
Rising share of capital income – concentrated among the rich (Piketty)
Tax systems have become less progressive + Welfare cuts
Rise in scale of in-work poverty, reduced employee bargaining power
Hollowing out of employment in manufacturing, increasing economic inactivity
What are the consequences of high relative poverty (inequality) for economic growth?
Causes a self-perpetuating poverty cycle as there is limited access to health care and education, Volatile incomes, high debts and low savings
Misallocation of scarce resources as capital investment in society is skewed towards the preferences of the rich. Low collateral which limits growth of entrepreneurship
Social and political unrest/tensions because of increased pressure on state welfare systems, rise of the informal economy and high interest rate loans (doorstep lenders)
How can inequality drive economic growth?
Encourages competition and effort among workforce
Incentivizes risk: taking behaviour by entrepreneurs + incentives to invest in education – both good for innovative / competitiveness
Helps to build up market demand for certain consumer goods that require a minimum purchasing power in poor economies (cars)
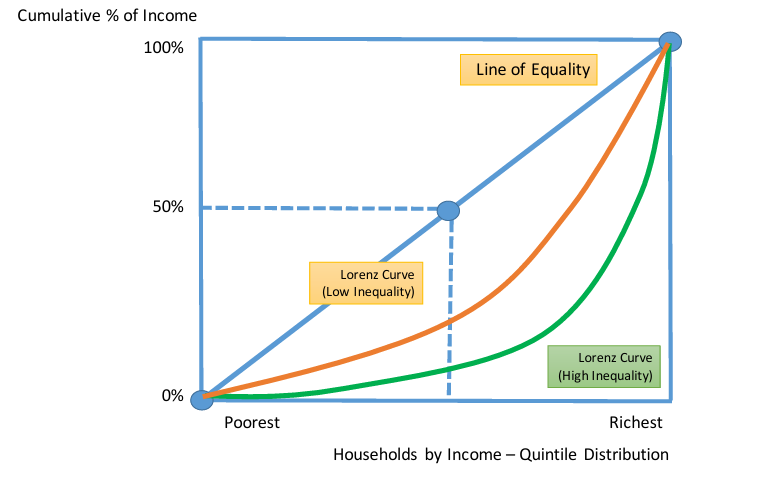
What is the Lorenz Curve?
Gives a visual interpretation of income or wealth inequality
The diagonal line shows a situation of perfect equality of income i.e. 50% of population has 50% of income
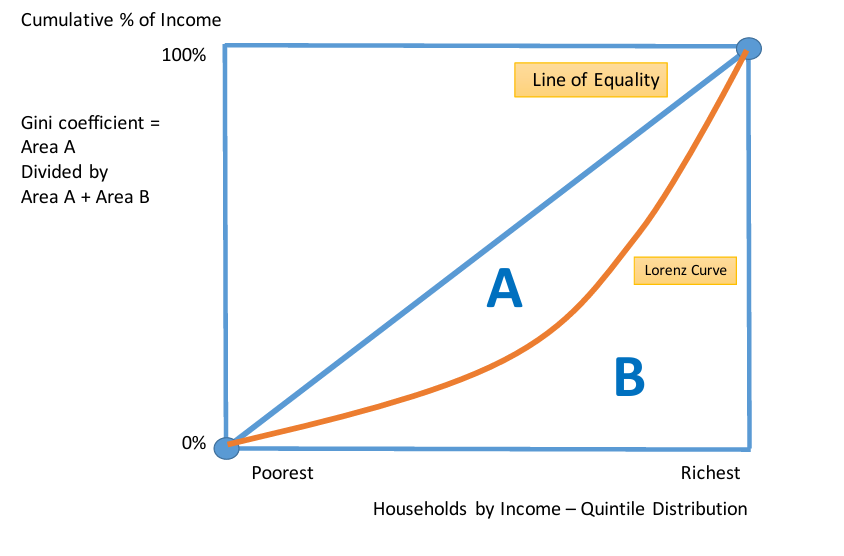
How can the Lorenz Curve measure the Gini coefficient?
Between 0 and 1
The higher the number, the greater the degree of income inequality. At 0 everyone has the same income
At 1 a single individual receives all the income
Absolute Poverty
When a household does not have sufficient income to sustain even a basic acceptable standard of living or meet basic needs
Absolute poverty thresholds will vary between developed and developing countries
The extreme poverty measure now used by the World Bank is the percentage of the population living on less than $1.90 a day (PPP)
Relative Poverty
A level of household income that is considerably lower than the median level of income within a country
The official UK relative poverty line is household disposable income (adjusted for household size) of less than 60% of median income
Official Poverty Line
An income level that is considered minimally sufficient to sustain a family in terms of food, housing, clothing, medical needs, and so on.
What are the main causes of absolute or extreme poverty?
Population growing faster than GDP in low income countries
Severe savings gap - families unable to save and living on less than $1.90 per day
Absence of basic public services
Effects of endemic corruption in government and business
High levels of debt and high interest rates
Damaging effects of civil wars and natural disasters
Low employment rates, vulnerable jobs and poverty wages
Absence of basic property rights
What are welfare state transfers?
Universal child benefits / unemployment benefit
Public or state pensions
Conditional welfare transfers e.g. Conditional on attending unemployment programmes
Targeted welfare payments- linked to income
What are some examples of state provided services to help inequality?
Education - reduces inequality of market incomes
Health care – state provided health services
Social housing - Provided by local authorities
Employment training
What are some examples of redistributive welfare transfers that reduce inequality?
Higher child benefit and the triple lock on state pensions
Expanded supported for disadvantaged students in paying tuition fees
Public goods free at the point of consumption
Minimum income scheme + capital endowments for young people
What are some examples of progressive income, consumption and wealth taxes that reduce inequality?
Higher taxes on property
Increased income tax allowances and higher marginal rate on incomes above £100,000
Progressive consumption tax
What are some examples of strengthening wage floors and employment rights in the labour market that reduce inequality?
National Living Wage, rising minimum wage
Improved employment rights, affordable child care, tackling monopsony employers
What are some examples of tackling structural barriers to employment that reduce inequality?
Early years education and more nutritional school meals to improve brain development
Improved access to new technologies in disadvantaged communities
Better vocational education, coding, STEM subjects
Targeted measures to address long term unemployment
What are some underlying causes of inequality?
Skills bias arising from technological change – super-high pay for some people
Rising share of capital income – concentrated among the rich (Piketty)
Tax systems have become less progressive + Welfare cuts
Executive pay and bonuses rising faster than for ordinary employees
Rise in scale of in-work poverty, reduced employee bargaining power
Increasing deep regional economic inequalities
Hollowing out of employment in manufacturing, increasing economic inactivity
Evaluate the following policy to lower inequality, providing a real world example.
Higher minimum wage
2024 NLW increased 10% from 2023
Boosts work incentives and take-home pay
HOWEVER, Might cost some jobs and lead to higher prices
Evaluate the following policy to lower inequality, providing a real world example.
Free provision of services
Free NHS treatment, state education
Access to merit goods not based on ability to pay
HOWEVER, Universal access not as effective as targeted provision
Evaluate the following policy to lower inequality, providing a real world example.
Higher rates of income tax
45% top rate of income tax may be raised to 50% again
Progressive taxes on the rich lower inequality and raise revenue
HOWEVER, High taxes on the rich may reduce their incentive to earn and be productive, potentially lowering overall tax revenue (Laffer Curve effect)
Lowering regressive taxes could significantly reduce government revenue, leading to potential austerity measures.
Evaluate the following policy to lower inequality, providing a real world example.
Investment in training
Subsidies for workplace training / internships
Helps to raise productivity, jobs and real wages
HOWEVER, Effective in the long run but risk of the free rider problem
Evaluate the following policy to lower inequality, providing a real world example.
Subsidies for childcare
2014 - max Govt contribution of £2,000 a year for each child
Improve incentives for mothers to look for and take work
HOWEVER, Effective, but quality of childcare needs improving
Horizontal Equity
The identical treatment of identical individuals or groups in society in identical situations.
Vertical Equity
The different treatment of individuals or groups which are dissimilar in characteristics.
What are some evaluative points for redistribution of income?
Incentives: Many policies risk distorting incentives, potentially leading to inefficiency.
Government Finances: The ability of governments to afford these policies is a critical consideration.
Equity vs. Efficiency: Balancing fairness with economic efficiency is challenging.
Normative Judgments: Government intervention based on fairness may not always lead to the best economic outcomes.
Extent of Inequality: Assessing whether inequality is severe enough to warrant intervention.