AICP Section 1.A - Research and Assessment
1/19
Earn XP
Description and Tags
Conducting Research and Acquiring Knowledge
Name | Mastery | Learn | Test | Matching | Spaced |
|---|
No study sessions yet.
20 Terms
Qualitative Data for Research
Non-numerical information to understand community conditions and experiences, especially through methods such as interviews, focus groups, and observations
Good for deep insights into stakeholder perspectives and understanding contextual factors
Related: Case studies, narrative data, field notes, participatory research, nominal data, ordinal scale
Quantitative Data for Research
Collection and analysis of numerical data, usually gathered through surveys, censuses, and records to identify patterns, trends, and correlations at the community level.
Related: Continuous data, discrete data, interval scale, mean, average, median, mode, range, ratio scale, index, standard deviation, variance, Z-score, inferential statistics, decennial census, american community survey
Mean
Average - Find sum of all numbers, then divide by the amount of numbers
Median
Middle - Middle value when numbers are ordered
Mode
Most - Value which is written the most in a set
Range
Largest to Smallest - The largest number subtracted by the smallest number
Standard Deviation
A measure of the amount of variation or dispersion in a set of values, indicating how much the values deviate from the mean.
1 S.D. = 68% of data
2 S.D. = 95% of data
3 S.D. = 99.7% of data
Z-Score
A statistic that indicates how many standard deviations a data point is from the mean of a data set.
Experiential Learning
Acquiring knowledge through hands-on experiences such as fieldwork, case studies, and simulations. This approach allows planners to apply theoretical concepts in real-world contexts, enhancing their research and assessment skills. It fosters critical thinking, problem-solving, and a deeper understanding of complex urban issues, ultimately leading to more effective planning practices
Related: Participant observation, ethnography, sense of place, environmental perception, critical thinking
Oral Histories
Personal stories and firsthand accounts to document the historical and cultural elements of the community. Captures diverse perspectives and memories, enriching the understanding of community development and change.
Related: Storytelling
Research Methods
Encompass various techniques for gathering, analyzing, and interpreting data related to urban environments. Includes qualitative, quantitative (experimental), and mixed-method approaches to provide comprehensive insights and inform planning, policy, and development decisions.
Related: Experimental, quasi-experimental, non-experimental, mixed-methods, case studies, pilot studies, comparative analysis
Precedents and Examples
Examine previous projects, case studies, and models that serve as references for current planning activities to provide valuable insights, lessons learned, and practical approaches to inform and guide new planning projects.
Best Practices
Methods and techniques that have been widely accepted as superior alternatives because they produce optimal or better results. Often derived from systematic analysis and experience, serving as guidelines for effective planning and implementation.
Analysis and Reporting
Systematically examining data and information to draw conclusions and make recommendations. Includes collecting, processing, and presenting data in a format that supports decision-making and policy development.
Related: Data collection, questionnaires, interviews, observational studies, sample population, trend analysis, needs assessment, public opinion, survey methods, data gathering, cohort survival projection, holding or carrying capacity, location quotient, migration, natural increase, population estimates, population forecasts, population projections, population pyramid, trend analysis, linear regression analysis, shift-share analysis, step down estimation methods
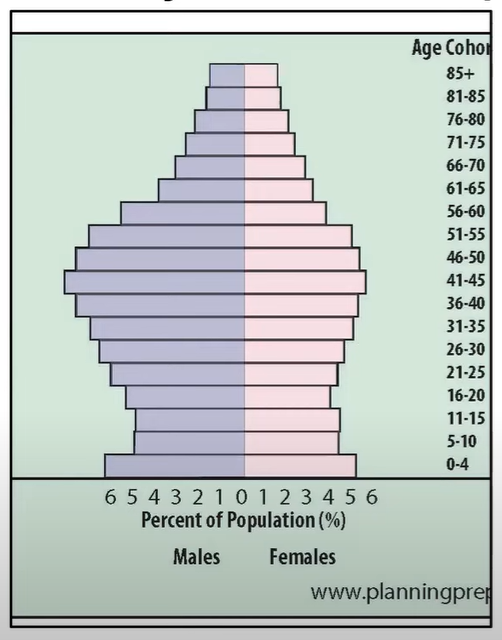
Population Pyramid
A graphical representation that shows the distribution of various age groups in a population, typically displayed as two back-to-back histograms, one for males and one for females.
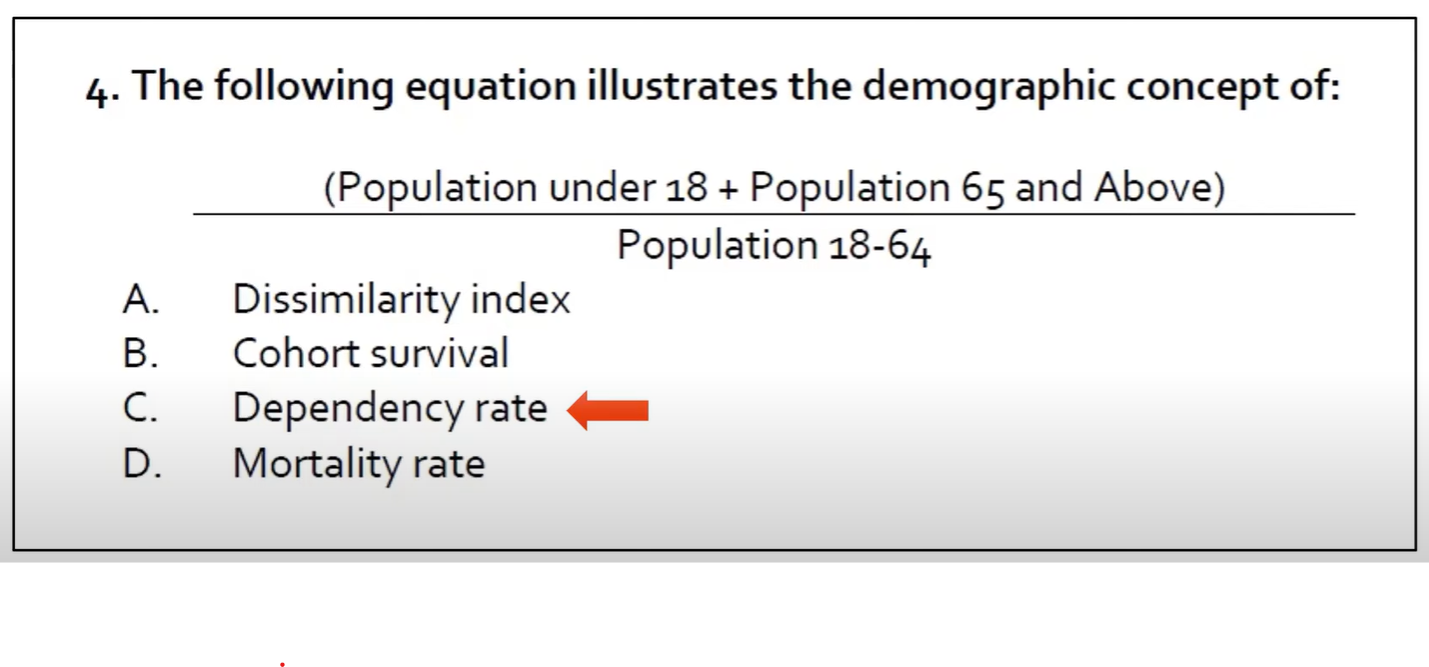
Dependency Rate
Ratio of population under 18 and above 65 to population ages 18-65.
(Minors and Seniors to Working-age population)
Surveying
Collecting data and information from a sample of the population to understand trends, needs, and preferences. This can include methods such as questionnaires, interviews, and observational studies. Relevance and interpretation of surveyed information is dependent on the sampling method and procedures.
Related: Field research
Sources of Data
Origins of data necessary for analysis and decision-making. Includes census records, governmental reports, surveys, academic studies, spatial data, community feedback, etc.
Metadata
Data that provides information about other data. Used for facilitating organization, discovery of data, and understanding datasets. Includes details such as data source, date, creator, purpose, format, and spatial characteristics.
Recognizing Implicit Bias
Unconscious Bias (Implicit Bias) - Social stereotypes about certain groups of people that individuals form outside their own conscious awareness.
Everyone holds unconscious beliefs about various social and identity groups, and the biases stem from a tendency to organize social worlds through categorization.
“A strong feeling in favor of or against one group of people, or one side in an argument, often not based on fair judgement” (Oxford)
Related: Equity, fairness, accuracy