stats - exam 3
1/140
There's no tags or description
Looks like no tags are added yet.
Name | Mastery | Learn | Test | Matching | Spaced |
|---|
No study sessions yet.
141 Terms
repeated measures design
evaluates the mean difference between two measurements taken from a single sample
repeated measures qualities
each participant completes both the congruent and incongruent condition
no control group
two scores per individual
different scores are used to determine the effects of the conditions
in a repeated measures experiment, each participant completes _____
the congruent and incongruent condition
in a repeated measures experiment, the control group is _____
non-existent
repeated measures alternate terms
within-subject, related samples, or dependent samples designs
in repeated measures, a hypothesis is tested about the _____ between two measurements using a single sample
population mean difference
in repeated measures, a hypothesis is tested about the population mean difference between _____
two measurements in a single sample
in repeated measures, a _____ must be computed
difference score for each individual
equation for difference score for each individual
D = X2 - X1
X1
the subject’s score at the first measurement
X2
the subject’s score at the second measurement
repeated measures requires _____ subjects than an independent measures design
less
in repeated measures, individual differences in performance from one participant to another are _____
eliminated
repeated measures designs reduces the _____ (2)
variance between subjects + estimated standard error
since repeated measures reduces the variance between subjects and estimated standard error, _____ is ultimately increased
power
repeated measuresis well suited for examining _____
changes that occur over time
disadvantages of using repeated measures
testing effects, floor / ceiling effects
testing effect
exposure to the first condition may influence scores in the second condition
floor effect
when an individual’s score is at a minimum in the first score, meaning they can only improve in the second
ceiling effect
when an individual’s score is at a maximum in the first score, meaning they can only worsen in the second condition
repeated measures hypothesis testing step 1
state the hypothesis and select the a level
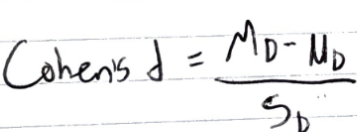
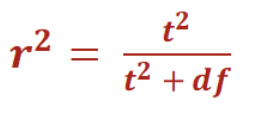
to measure effect size in repeated measures, _____ can be used
cohen’s d + r²
in repeated measures, the _____ of difference scores is used to test hypotheses about the _____ of different scores
sample + population
null hypothesis in repeated measures (two tailed)
there is no consistent or systematic difference between the two conditions
in a repeated measures null that is non-directional / two tailed,
some participants may show a positive or negative difference
but on average, _____
alt hypothesis in repmes (two tailed)
there is a systematic difference between conditions that produces a non-zero mean difference

the alternative hypothesis is that the _____ represents a true population mean difference
sample mean difference
the alternative hypothesis is that the sample mean difference represents a _____
true population mean difference
the alternative hypothesis is that the _____ represents a _____
sample mean difference + true population mean difference
in repmes, all calculations are done with the sample of difference scores
obtained difference / estimated standard error of
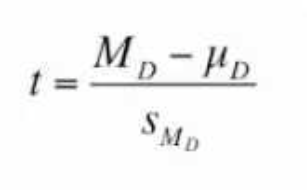
in repmes, all calculations are done with the sample of difference scores
theoretical numerator of repmes
md-ud
hypothesized population difference
mu_d

since the repmes null is that μ=0, the numerator would be equivalent to _____
MD
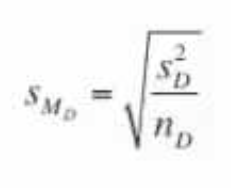
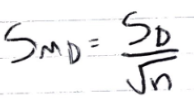
the estimated standard error for the M_D
SMD
repmes is used when _____ (3)
μ and σ are unknown + μ cannot be estimated + one sample is being examined
in repmes, the sample of difference scores is used to _____
test hypotheses about the population of difference scores
repeated measures designs _____ power
increases
repeated measures designs increase power, which _____ the standard error
decreases
MD equation
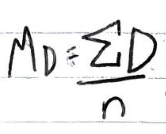
SMD equation
SMD
cohen’s d
r² equation
r2
repeated measures - hypothesis testing - step 2
locate the critical region
degrees of freedom for the repeated measures t-test
n-1
repeated measures - hypothesis testing - step 3
compute the test statistic
calculations go in order of _____ (4)
MD → SD → SMD → t
repeated measures t-test looks at the _____.
mean difference between two measurements
repeated measures - hypothesis testing - step 4
make a decision after comparing t-value to critical value
SPSS output: M
mean
SPSS output: N
sample size
SPSS output: s
standard deviation
SPSS outputs for upper table
M (mean), N (sample size), s (standard deviation)
SPSS output (lower table)
mean = MD
SD = std. deviation
SMD = std error mean
t stat = t
df = df
p value = sig 2 tailed
ANOVA
analysis of variance
ANOVA is a hypothesis testing procedure used to evaluate _____
mean differences between 2 or more populations
the purpose of ANOVA is similar to _____
t-tests and they would yield the same results.
ANOVA can examine ______
more than 2 groups simultaneously
ANOVA helps prevent _____ when comparing two or more population means
type I error
ANOVA automatically adjusts for the _____
effect that testing multiple hypothesis has on type I errors
in ANOVA, the IV that splits participants into groups is called a _____
factor
in ANOVA, the individual conditions or values that make up a factor are called _____
levels
the # of levels are indicated by the symbol __
k
ANOVA can be used with multiple factors at the same time
different groups of people that can be put into , control, one treatent type, another treatment type > these three are different groups that are grouped into one treatment types meaning it is one level
the test statistic for ANOVA
F-ratio
F-ratio is a sample’s ____:_____
systematic variance : random variance
in ANOVA, sample variances are equivalent to _____
mean squares
in ANOVA, mean squares are referred to as _____
MS values
MSbetween is displayed at the _____
top of the F-ratio
MSbetween refers to _____
the signal / systemic variability
MSbetween measures _____
the size of the difference between each level’s sample mean
MSwithin is displayed at _____
the bottom of the F-ratio
MSwithin refers to _____
the noise / random variability
MSwithin measures _____
the magnitude of differences expected without any effects of the IV
MSwithin measures the variability that exists _____
inside each of the treatment levels
the F-ratio has the same basic structure as the _____
the independent measures t-statistic
F-ratio
F = MSbetween / MSwithin
MSbetween
obtained mean differences, including treatment effect
MSwithin
differences expected by change without treatment effects
example: what equations must be used?
suppose a factor has three levels, each with n=25. the level means are M1=1 M2=2 M3=3. the three level means are different / variable. by computing the variance of the means (MSbetween), we can test the size of the difference.
MSbetween=SSbetween / dfbetween
SSbetween= n(SSmeans)
dfbetween= k-1
MSbetween can be caused by two sources:
effects of the IV & chance of sampling error
chance of sampling error in terms of MSbetween
if there is no effect of the IV at all we would still expect some differences in the DV values between levels due to random, unsystematic sampling error
effects of the IV in terms of MSbetween
could cause the mean for one level to be higher or lower than that for another
in an F-ratio, the signal represents the _____
magnitude of the difference between means
in an F-ratio, the noise represents the _____
magnitude of the random differences expected without any of the effects of the IV
MSbetween represents the variability caused _____
by the IV
MSbetween can be understood as the signal because it _____
reflects the systematic differences between group means.
MSwithin represents the variability ______
within groups due to random error or individual differences
MSwithin can be understood as the noise because it _____
reflects the expected variation that would occur by chance, even without an effect from the IV
if the MSwithin is smaller than the MSbetween, the f value will be _____
greater
the greater the f value, the realer the _____
difference
if the f-value is greater, this mean the calculation is _____ due to chance.
not
ANOVA null
all μ’s are equal
ANOVA alt
there is at least one mean difference
all hypotheses in ANOVA are _____
non-directional
F is a ratio of ______
variances
since F is a ratio of variances, we can never have a _____
negative F
variances cannot be _____
negative
all hypothesis in ANOVA are non-directional because variances _____
cannot be negative
in the ANOVA distribution, there is / are _____ tail(s)
one