Smart Factory - Module 3
 Call Kai
 Learn
Learn Practice Test
 Spaced Repetition
 Match
Match Flashcards
 Knowt Play
1/18

There's no tags or description
Looks like no tags are added yet.
Name | Mastery | Learn | Test | Matching | Spaced | Call with Kai | Chat |
|---|
No analytics yet
Send a link to your students to track their progress
19 Terms
What is a simulation environment and give an example
virtual environment created to imitate the operation of a real-world process or system over time to gain knowledge that can be transferred to reality, eg SimUI, this is where we can generate the digital model
motivation for digital twin in production
More frequent transformations of production system needed because demand changes a lot
there are also tech advances to keep up with
also cost pressure to find most efficient way of production
enables detailed analysis
Model vs Simulation vs Digital twiin
model : helps understand, analyse and explain complex systems by simplifying key features
simulation : uses model to replicate system’s behaviour under different conditions
Digital twin: dynamic digital real time replica of physical system (simulation that continuously gets current data
Applications of a simulation
evaluation of cause and effect relationship in a system
plannning and operation of production systems
weaknesses of a simulation
project-based
Simulation and domain knowledge required
usually requires extensive manual data preperation
digital twin consists of
digital master, digital shadow, and intelligent connection btw both
Reasons to create a simulation
system is too complex, expensise or dangerous
system works too fast (e.g electronic cicruit or molecules)
Temporal development/progression too chaotic
System does not yet exist
System not fully understood yet (e.g big bang)
Simulations are reproducible (you can try over and over again easily)
Classification of Simulation models
Time aspect
dynamic
static (time independant)
Coincidence/randomness
deterministic (no random variables, given input always has same output)
Stochatic ( there is some randomness, results vary )
State of space and Change of time
continuous or discrete state
continuous or discrete time
Which type of time modelling is most used
Discrete time simulation
Discrete event simulation
State changes occur at discrete points in time triggerend by specific events
Event List Management: Known upcoming events are ordered chronologically in an event list.
Time Jump: The simulation clock jumps directly forward to the timestamp of the next immediate event.
State Update: The state change associated with that event is executed.
Future Event Generation: The event execution may schedule new future events, which are added back into the chronological list.
Building digital master
Define problem and analyse real system using data and expert knowledge
Make conceptual model with acceptable simplifications
Implement using development environment (computer programming)
Do iterative testing and troubleshooting
Prsentation of simulation results and interpretation
Statistical vs empirical distribution of data
empirical data is the raw, observed information collected from real-world tests or experiences, while statistical data is the mathematical organization and analysis of that raw information
Advantage of statistical over empirical data for simulations
traceability
predictability (thanks to higher generalisation)
expenditure (makes simulations easier to modify)
data quality
system understanding
How is data collected and then used for simulatiosn
Empirical data is typically collected as discrete measured values (bar graph), which is then fitted into continuous probability distributions for simulation modeling.
Distribution types
uniform distribution (all values in interval [a,b] have equal probability)
triangular distribution ( modal value c , minimun a and maximum b)- suited for limited info
normal distribution (mean value μ, standard deviation σ) - symmetry around μ
lognormal distribution (mean value μ, standard deviation σ) - asymmetry
bi-/multimodal distribution (cannot not be described by simple distribution function — difficult to model)
What is seeding
random numbers are often used in simulations, but computers are never truly random
seeding = setting initial value (seed) for random number generator - if same seed is used, same random numbers are generated (ensures that exact simulation can be reproduced)
95% confidence interval
Small interval in distribution that 95% of the time contain the population’s actual parameters (eg mean value) (instead of giving a single point estimate, there is a range of values that the mean has 95% chance of having)
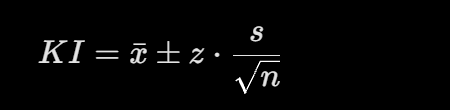
How to calculate confidence interval KI
x̄ (Mean): The average value calculated from your simulation runs.
z (z-value): A critical value based on your chosen confidence level.
s (Standard deviation): The variability/spread of the sample data.
n (Sample size): The number of simulation runs or observations.
confidence level= 95% — z=1.96
confidence level= 99% — z=2.58
must be estiated with random sample, testing whole population is to tedious
Sensitivity analysis
Analyses how variation of different variables affect the key performance indicators (KPI)
Identifies the most important factors to focus optimization efforts on for greatest improvement of efficiency eg