NR 326 Final
1/40
There's no tags or description
Looks like no tags are added yet.
Name | Mastery | Learn | Test | Matching | Spaced | Call with Kai | Chat |
|---|
No analytics yet
Send a link to your students to track their progress
41 Terms
Valuation: Why value the environment?
Valuing the environment translates abstract ecological goods into actionable data. It ensures nature’s worth is directly factored into human progress, primarily through two main frameworks:
Key Decision-Making Frameworks
Cost Benefit Analysis (CBA): By assigning monetary values to ecological outcomes, decision-makers can weight the true societal costs of a project against its financial gains
Natural Resource Damage Assessment (NRDA): It quantifies the financial penalty polluters must pay to restore damaged ecosystems and compensate the public for lost use
Capturing Nonmarket Benefits
Use Values: Benefits gained from direct interaction with nature (e.g., hiking, fishing)
Revealed preference: estimates value by observing actual behaviors, such as travel costs incurred to visit a national park
Stated preference: uses surveys to ask people their willingness to pay to protect a specific ecosystem or their willingness to accept its destruction
Valuation: Market vs non-market goods
Market goods:
Tangible prices exist, driven by market forces and observable transactions
Food, clothing, cars, houses, and electronics
Rely on direct market value, comparing historical sales or replacement costs
Non-market goods:
No explicit price tag; not directly bought or sold
Clean air, public parks, biodiversity, and human health/lifespan
Requires advanced economic techniques to estimate what people are willing to pay (WTP)
How Non-Market Goods are Valued
Revealed Preference Methods
Hedonic pricing: isolates how factors like air quality or proximity to a park affect housing prices
Travel Cost Method: estimated the value of non-market good by calculating how much time and money people spend traveling to visit it
Stated Preference Methods
Contingent Valuation (CVM): involves constructing a hypothetical market in a survey to find out how much a respondent valyes an environmental asset (like protecting an endangered species)
Importance
Understanding both types of values allows governments and organizations to conduct a thorough CBA (Cost Benefit Analysis); without non-market valuation, public policies might only account for profit-generating potential of a project while ignoring the destruction of valuable, unpriced natural resources or public health benefits
Valuation: Total Economic Value (TEV) and all components
Use values: value that people place on the tangible or physical benefits of a good or service
Direct-Use Value: tangible economic benefit derived from the direct, physcial use or consumption of a good or resource
tourism
Indirect-Use Value: ecosystem benefits that are not valued by markets
provided freely by nature; ecosystem service
Nonuse values: values that people obtain without actually using a resource (i.e., psychological benefits)
Option Value: value people place on the maitenance of future options for resource use
Bequest Value: value people place on the knowledge that a resource will be available for future generations
Existence Value: value people place on a resource that they do not intend to ever use
Valuation: Non-Market Valuation Techniques
Stated Preference: surveys that evaluate people’s WIP for a service
Hypothetical scenario evaluates:
WTP: max they would pay
WTA: minimum amount they would accept as compensation
Techniques:
Contingent valuation:
Question people regarding their WTP for a good (choice experiment)
Contingent ranking:
Choices are ranked
Revealed Preference: establishes link between change in ecosystem goods and changes in the observable behavior of people
Travel Cost Method (TCM): money you spend getting to a site; analyzes the use value of natural recreation sites; cost to travel to a park or other recreation site based on their distance; demand curve represents WTP using # of total visits vs travel costs
Total travel cost
# of visits
Hedonic pricing: how much buyers are WTP for improved enviornment quality, ceteris paribus?
Independent variables: location, size, environment, style
Dependant variable: price of house
Cost
Cost of Illness: estimates the economic burden of a sidease by summing direct medical cost and indirect loses; medical, travel, opportunity
Replacement cost: the amount you need to spend to replace a natural resource
Valuation: WTP vs WTA
Willingness To Pay (WTP): the economic value that people obtain from a specific resource is defined as their maximum willingness to pay (WTP) for it
Willingness to Accept (WTA): in situations where a policy would decrease environmental benefits, we can ask how much people would be willing to accept (WTA) in compensation for these changes
Valuation: Contingent Valuation Biases
Strategic bias: tendency for people to state their preferences or values inaccurately to influence policy decisions
Yea-saying: responding yes even though one’s true valuation of the scenario is less, for reasons such as perceiving yes to be a corrected answer
Range bias: responses are influenced by the range of values presented to the respondent
Protest bids: responses based on the respondent’s opposition to the question or the payment vehicle, rather than the underlying valuation of the resource
Nonresponse bias: bias as a result of survey respondents not being representative of survey nonrespondents
NOAA recommendation for CV Studies
In person surveys are preferred because they best maintain a respondent’s concentration and allow for the use of graphics
The WTP question should be phrased Y/N format with a specific price
The respondents should be reminded of their income restraints and that funds used for the scenario under study cannot be used for other purposes
Valuation: Revealed Preferences Method
Revealed Preferences Method: establish a link between changes in ecosystem goods and services and changes in the observable behavior of people
Travel Cost Models (TCMs):
How much visitors spend on getting to the site
Analyze the use value of natural recreation sites:
National parks, beaches, wilderness areas, recreational fishing
Demand curve is used to represent WTP using number of total visits and travel costs
As total cost goes up, number of visits goes down
Hedonic Pricing:
Environmental quality can affect market price of goods
The use of statistical analysis to explain the price of a good or service as a function of several components
E.g. explain the price of home as a function of the number of rooms, the caliber of local schools, and the surrounding air quality
Valuation: Consumer surplus
The difference between willingness to pay and the amount actually paid is referred to as consumer surplus
The demand curve reflects a consumer’s marginal willingness to pay: the maximum amount a consumer will spend for an extra unit of a good
Consumer surplus is measured in dollars. It is the area above the equilibrium price and below the demand curve
Consumer surplus = WTP - Actual price
Externalities: What is an externality
Definition: the uncompensated impact of a person’s actions on the well-being of a bystander
Negative externality = the impact on the bystander is adverse; total cost to society is greater than the private cost paid by the producer
Positive externality = the impact on the bystander is beneficial; total benefit to society is greater than the private benefit gained by the consumer
Externalities: How to distinguish positive and negative externality; List of examples for both
Negative externalities:
Air pollution: a manufacturing plant emits toxic exhaust into the air to produce cheap plastics. Nearby residents suffer from respiratory illnesses and must pay higher medical bills, even though they don’t buy the plastics
Traffic congestion: a person driving to work creates extra traffic, increasing commute times, stress, and vehicle emissions for everyone else on the road
Second-hand smoke: a person smoking a cigarette harms the health of bystanders who breathe in smoke
Positive externalities:
Vaccinations: when an individual gets a flu shot, they protect themselves, but they also reduce the likelihood of spreading the virus to elderly or immunocompromised neighbors (herd immunity)
Public education: a well-educated workforce benefits society by lowering crime tates, increasing civic engagement, and boosting the overall productivity of the economy
Beekeeping and Orchards: a beekeeper raises bees to sell honey. As a side effect, the bees pollinate a narby apple orchard, increasing the neighboring farmer’s fruit yields without having to pay for the pollination
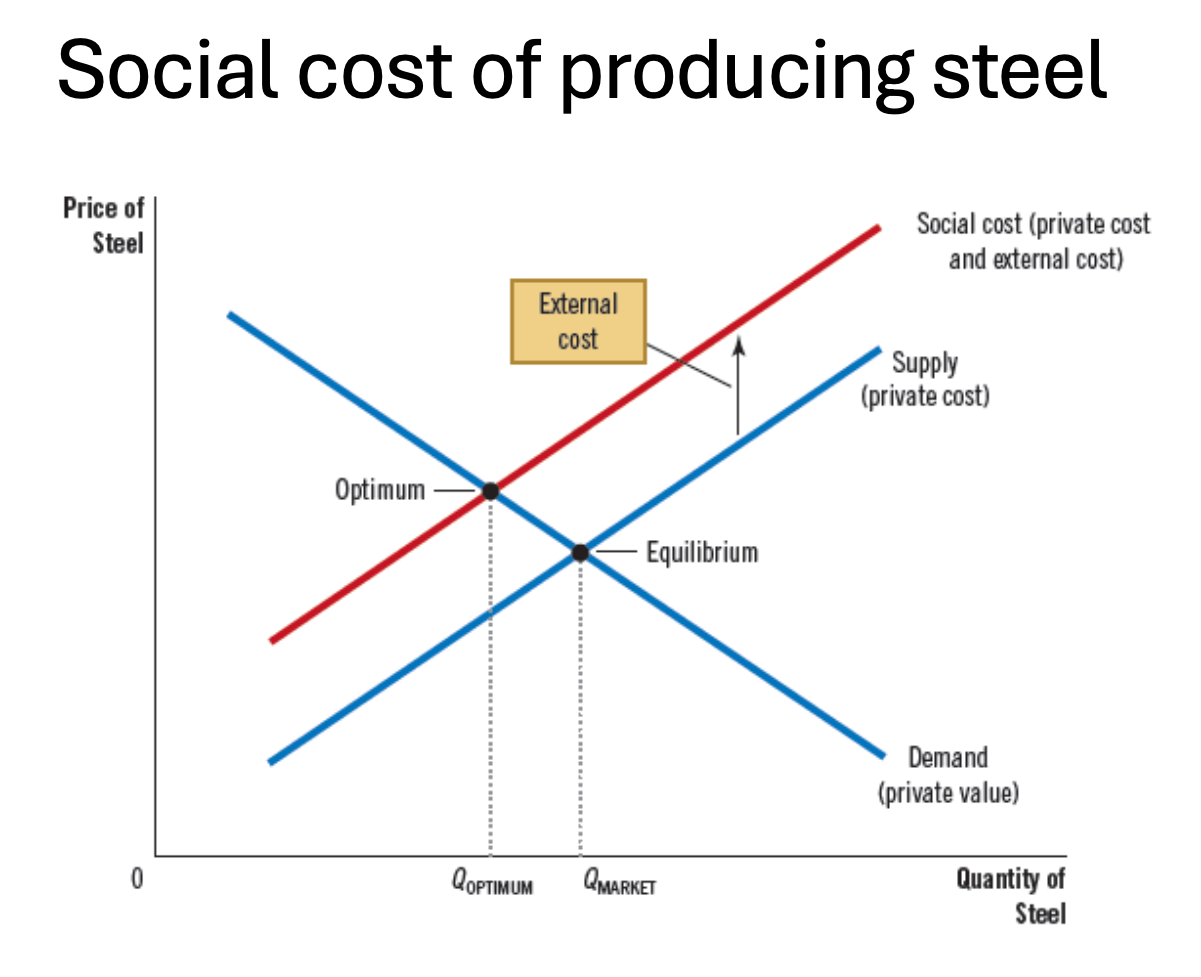
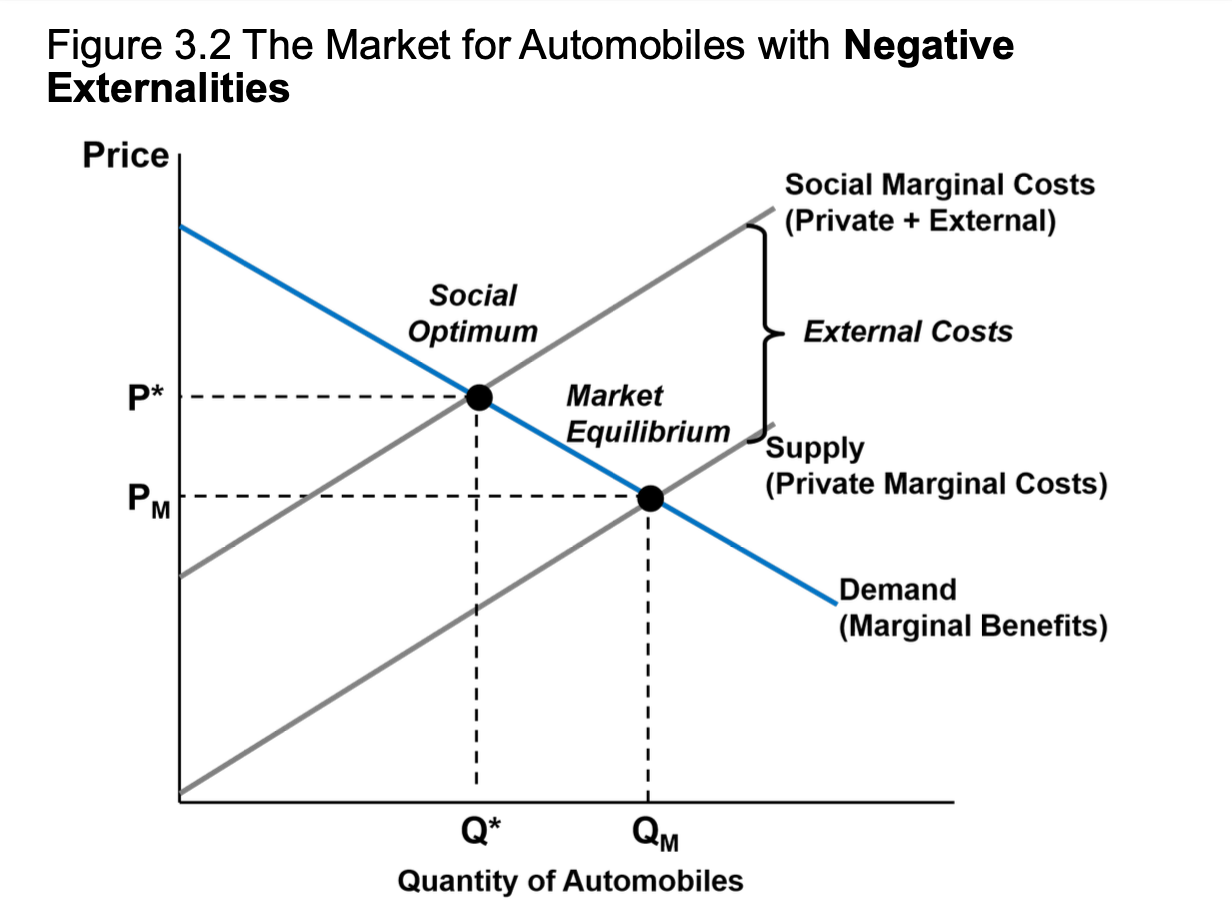
Externalities: Graph social marginal cost curve, identify amount of external cost
How do externalities affect market efficiency?
Because of externality, the cost to society of producing steel exceeds the cost to steel producers
For each unit of steel produced, a certian amount of smoke enters the atmosphere
Social Cost = private costs of the steel producers + costs to bystanders harmed by the emissions
Externalities: What is a Pigovian tax?
Definition: a per-unit tax set equal to the external damage caused by an activity
Pollter pays principle = those responsible for pollution should pay for the associated external costs, such as health costs and damage to wildlife habitats
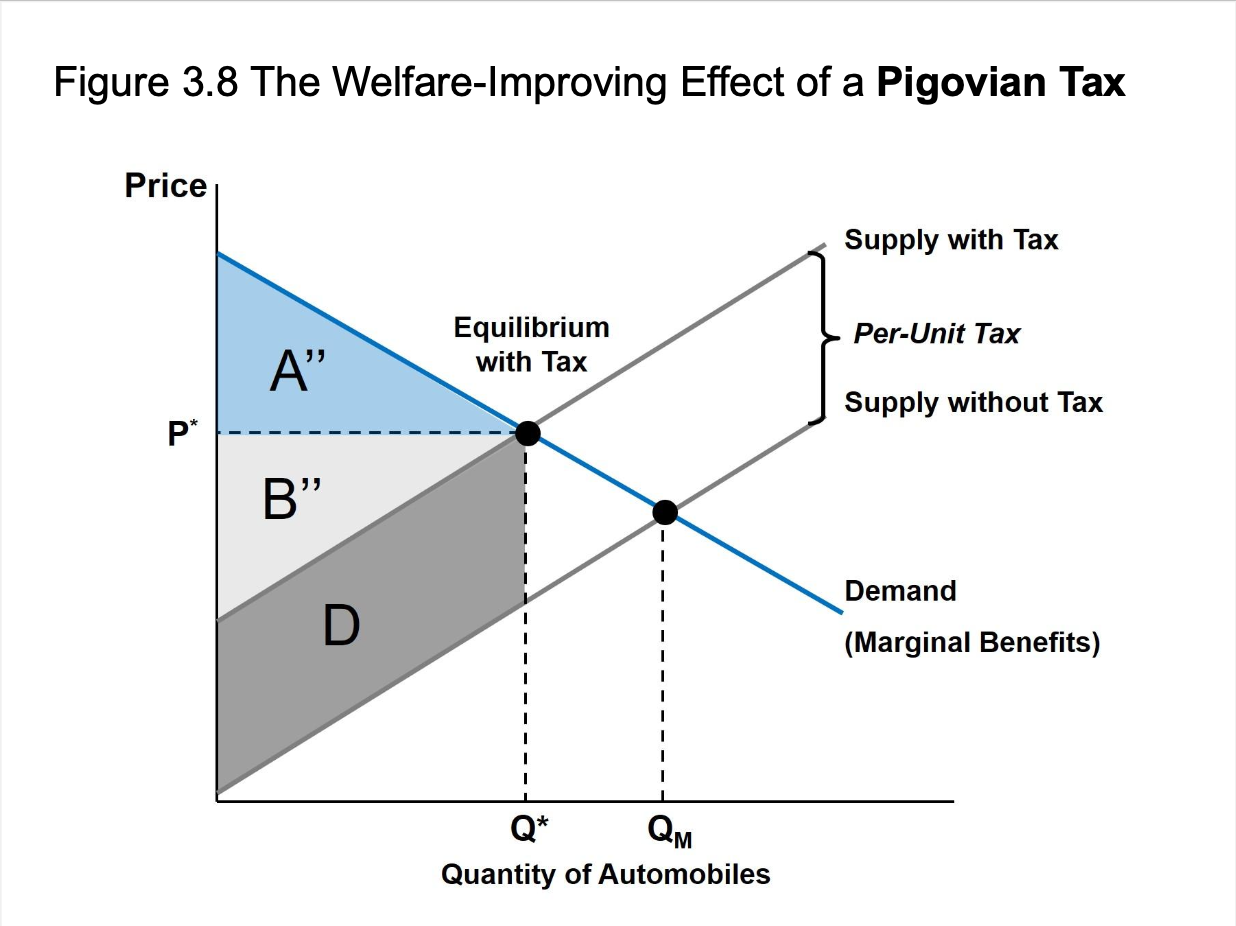
Externalities: How to graph Pigovian tax
Externalities: How to set tax amount for Pigovian tax
To set a Pigouvian tax, the tax amount per unit of a good or activity must equal the Marginal External Cost (MEC) precisely at the socially optimal output level. By doing this, the tax forces producers to internalize the damage caused to society
Tax = Marginal External Cost
Externalities: Should we put a Pigovian tax on everything?
A Pigouvian tax is a powerful took to force markets to pay for the societal or environmental damage they cause (like carbon emissions). However, we shouldn’t apply it to everything. It is only efficient when the harm is measurable, and applying it universally would be a logistical nightmare.
Measurement problem = to work correctly, the tax must equal the exact marginal cost of the damage. For most goods, calculating this exact dollar value is practically impossible
Disproportionate impact = Pigouvian taxes raise the price of goods. If applied to everything, it would disproportionately punish lower-income individuals who spend a larger percentage of their income on consumer goods
Administrative nightmare = tracking and taxing the “social cost” of every transaction would create massive compliance and bureaucracy costs, outweighing the benefits
Externalities: Compare quantity produced before and after Pigovian tax
A Pigouvian tax reduces the quantity produced of a good generating a negative externality. Before the tax, the market produces too much because the consumers and producers ignore the external costs they impose on third parties. After the tax, the production matches the socially optimal quantity.
Before the Pigouvain Tax, the market overproduces the good
After the Pigouvian Tax, producers internalize the cost, leading to higher prices for consumers and a natural decrease in overall production
Externalities: Producer surplus vs consumer surplus
Producer surplus = financial gain seller get by receiving more than the minimum price they are willing to accept
Consumer surplus = financial gain buyers get by paying less than they are willing to pay
Externalities: What’s Coase Theorem? When does this solution work?
If property rights are clearly defined and transaction costs are negligible, involved parties can negotiate private, mutually beneficial solutions to externalities without government intervention, regardless of who initially holds the rights.
The proposition that if:
property rights are well defined
and there are no transaction costs,
an efficient allocation of resources will result even if externalities exist
Externalities: What’s command and control? Give an example.
Definition: an explicit regulation directing which actions are explicitly permitted and which actions are not.
Examples:
Establish a uniform maximum level of pollution at every factory
Requirements to install specific technology to reduce pollution at every factory
Externalities: Cap and trade is used to reduce emissions of air pollution and greenhouse gases, using market forces to encourage companies to invest in cleaner energy and more efficient technologies.
Cap and trade is a market-based environmental policy that sets a firm limit on aggregate emissions while allowing companies to buy and sell pollution allowances
It financially penalizes heavy polluters and rewards organization that innovate, driving the transition to cleaner energy and more efficient technologies
Externalities: How to solve an externalities problem?
Pigouvain Tax or Subsidy
Tax markets with negative externalities = social cost
Subsidize markets with positive externalities subsidy = social benefit
government provides financial assistance to offset the costs of producing or consuming a good; this intervention ensures that the total societal benefits are accounted for, correcting a market failure where the food is typically underproduced and under consumed
Coase Theorem - Property Rights
Private bargaining
Command and control
Cap-and-Trade
Allow trade to allocate resources
Governing the Commons: What is the tragedy of the commons and why does it occur
The failure to preserve natural resources for short-term gain and self-interest.
Individuals act independently and rationally according to each’s self-interest, leads to the depletion of natural resources, even though this will eventually result in welfare loss for every group member
Governing the Commons: Two characters for common pool resources
Common-pool resources: unowned, all who have access to the resource
Nonexcludable: a good that is available to all users
Rival: use by one person diminishes the quantity or quality available to others
Governing the Commons: What is an open-access resource
A type of common-pool resource that offers unrestricted and unregulated access
When a common pool resource is owned by no one
Governing the Commons: Three phases for total product curve in fishery example, when does overfishing take place? Able to identify industry profit-maximizing number of trips and open-access equilibrium; policy interventions that could correct the open-access problem.
3 Phases of Total Product Curve
Constant Returns: Output increases proportionally to the addition of the variable output. Every time you add one more unit of input, the total output increases by the exact same. Marginal product remains constant.
Diminishing Returns: While output is growing, the rate at which is grows begins to slow down. Adding an extra unit of input yields less additional output than the unit before it. This happens because fixed inputs get crowded or shared.
Absolutely Diminishing Returns: Adding more number of trips diminishes the number of total fish caught
When does overfishing take place
Overfishing takes place right after the “Diminishing Returns” and right at the start of “Absolutely Diminishing Returns” because the peak of the curve is where the maximum amount of fish can be sustainably harvested (MSY- Maximum Sustainable Yield), but after this peak, the total catch now decreases as a result of too much effort, and overfishing has begun.
Fishiery Example: # Boat Trips = >110
Profit-maximizing number and Open-access equilibrium
The Profit-Maximizing Number:
Definition: Firms maximize profit by expanding output until the revenue generated rom the last unit produced quals the cost of producing it.
The Rule: Marginal Revenue (MR) = Marginal Cost (MC)
Outcome: At this point, the distance between Total Revenue (TR) and Total Cost (TC) is at its absolute maximum, meaning the firm is generating the highest possible economic profit.
Fishery Example: # of Boat Trips = 70
Open-access Equillibrium:
Definition: In an unregulated, open-access market (like common-pool resources such as fisheries), individuals will freely enter the industry as long as there is money to be made.
The Rule: Total Revenue (TR) = Total Cost (TC)
Outcome: Because anyone can enter, new participants will continue to join until all economic profit is entirely wiped out. At this point, individuals are still covering their operating costs (breaking even), but they are making zero economic profit (no excess profits left on the table).
Fishery Example: # of Boat Trips = 120
Policy interventions that could correct the open-access equilibrium
Taxes on Fishing Effort:
A tax or fee applied to fishing outputs (e.g., fuel) or directly to per unit of fish caught
This internalizes the environmental externality. By artificially increasing the marginal cost of fishing, the tax decreases total effort, allowing the fish population to rebound while government collects the resource rent
License Fees: a license fee acts as a Pigouvian tax designed to exact the economic rent of the fishery
Mechanism: by setting a fee equal to the profit earned on the 70th trip, the government increases the marginal cost of fishing, effectively wiping out the pure economic profit a fisher would gain from making a 71st trip
Behavioral Effect: Fishers evaluate their costs and benefits. Because the 71st trip will now result in an economic loss, fishers will naturally stop at 70 trips.
Outcome: reduces overall effort, generated revenue for management, and allows the fish population to recover to sustainable levels
Catch Quotas (Quantity Controls): a strict limit on output is a classic Quantity Regulation
Mechanisms: the regulator physically caps the aggregate harvest to an amount that corresponds exactly to 70 fishing trips
Behavioral Effect: Fishers can no longer compete in an unregulated “race to fish” as the maximum allowable harvest is legally restricted
Outcomes: this explicityly limits the catch, if the quotas are made tradable, it incentivises the most efficient fishers to buy out the quota from less efficient ones, maximizing economic efficiency in the fleet
Governing the Commons: What did Elinor Ostrom say about managing common property resources?
In Governing the Commons, Elinor Ostrom disproved the “tragedy of the commons” theory, which claimed that common property resources will inevitably be overused and destroyed. She demonstrated that communities can, and routinely do, successfully self-regulate and manage shared resources sustainably through local, bottom-up institutional arrangements.
Design principles
Decision Marking
Rules match local conditions
Rules for managing the resource should be adapted to local conditions
Collective-choice (users help make rules):
Most users of a resource should be involved in devising rules for managing the resource
Monitoring (by users or accountable monitors)
There should be monitors of the resource, accountable to the resource users, who periodically evaluate conditions
Sanctions
There should be graduated sanctions for resource users who violate rules
Conflict resolution (cheap, local)
There should be mechanisms to resolve conflicts that are responsive and low-cost
Governing the Commons: What is a public good, characters
Definition: Products or services that are freely accessible to everyone in society
Nonexcludable: goods that are available to all
Nonrival: whose use by one person does not reduce their availability to others
Characters:
Excludable and Rival = Private goods (jeans, burgers, glasses
Excludable and Nonrival = Club goods (Wifi, digital music, streaming)
Nonexcludable and Rival = Common resources (underground water, fish)
Nonexcludable and Nonrival = Public goods (national defense, national park, highway, radio)
Problem with Public Goods:
NO one has an incentive to pay for something that everyone else can freely enjoy
Governing the Commons: Free rider, collective action problem
Definition: an individual or group that obtains a benefit from a public good without having to pay for it
Collective Action Problem: a scenario in which there is conflict between the individual interest and the group interest, leading to a failure to cooperate even when cooperation would benefit everyone
Governing the Commons: Market Failure
Definition: A market failure occurs when the free-market system fails to allocate resources efficiently, resulting in the overproduction of goods and services. This inefficiency means societal welfare is not maximized, leading to a net loss in economic surplus.
Public Goods: Because no one can be excluded, consumers have no incentive to pay (free-rider problem). Private firms cannot make a profit, leading the free market to under-provide or completely fail to produce the good
Common-Pool Resources: Because the resouce is free to access but finite, individuals act in their own self-interest to extract as much possible before others do. This results in the tragedy of the commons (the physical overuse, degredation, or total collapse of the resource)
Governing the Commons: Renewable Resource Management
Sustainable resource management:
Source function: ability of the environment to make services and raw materials available for human use
Sink function: ability of environment to absorb wastes and pollution
Goal: resource’s quality and availability remain stable over time
Maximum Sustainable Yield (MSY):
Maximum quantity of a natural resource that can be harvested annually without depleting the stock or population of the resource
Time Value of Money: Definition of Cost-benefit analysis (CBA); why it is significant
Cost-Benefit Analysis: seeks to measure all costs and benefits of a proposed project/policy in monetary units
A government/company has many project, and with limited resources, it must choose which ones to take on
In order to choose, they translate all of the costs and benefits into monetary values and weigh them
Significance:
Allows decision-makers to assess trade-offs rationally
Usage: agencies like the EPA legally must do CBAs for big policies
CBA is from the society’s point of view:
Rather than from the perspective of a single profit-making firm
CBA incorporates social valuation of all inputs and outputs related to the project whether or not they are transacted in private markets
Time Value of Money: CBA steps
List all costs and benefits
Measured in monetary units
Not measured in monetary units → non-market valuation
Add up all costs and benefits
Compare total costs and total benefits
Time Value of Money: Net benefit calculation
Net benefit = total benefits - total costs
Compare it with 0
If >0, undertake the project
Time Value of Money: Benefit-cost ratio
Benefit-cost ratio = total benefits/total costs
Compare it with q
If smaller than 1, meaning costs greater than benefit
Time Value of Money: Strength and limitations
Strengths:
Unified, clear, transparent, etc.
Limitations:
Hard to monetize, distributional equity, ethical, etc
Time Value of Money: Discounting; general formula (present value, future value)
Compounding: calculates how today’s money grows over time
FV = PV(1+r)n
n = number of periods
r = interest rate
Discounting: calculates how much future money is worth today
PV = FV/(1+r)n
n = number of periods
r = discount rate
Show example equation ****
Time Value of Money: Why does choosing a discount rate matter?
Choosing a discount rate:
discount rate reflects society’s rate of time preference
low discount rate values future benefits/costs similar to present benefits/costs
high discount rate implies future benefits/costs have little value compared to current benefits/costs
Why does choosing a discount rate matter:
it translates future cash flows into today’s dollars, directly determining an investment’s present value
Selecting the correct rate dictates whether a project is deemed profitable or value-destroying
choice of discount rate can change the sign of net benefits for policies with long-delayed payoffs (public health, climate, safety)
a highly effective, low-cost vaccine might look like it has weak net benefits
Time Value of Money: Expected value formula
E(X) = ∑ [x ⋅P(x)]
E(X) = Expected Value
x = The value of each possible outcome
P(x) = The probability of that outcome occuring
∑ = The sum of all possible outcomes
Example:
You play a carnvial game that costs $5. If you draw an Ace, you receive $20. If you draw any other card, you win nothing.
Outcome 1: x = $20, P(X) = 4/52 ~ 0.0769
Outcome 2: x = -$5, P(X) = 48/52 ~ 0.9231
E(X) = ($20 ⋅ 0.0769) + (-$5 ⋅0.9231)
E(X) = -3.077
Midterm: Total Production and Cost Curves
Midterm: Marginal Cost Curves (MR=MC)
Midterm: Market analysis