Chap 11 intraspecific population regulation
1/35
There's no tags or description
Looks like no tags are added yet.
Name | Mastery | Learn | Test | Matching | Spaced |
|---|
No study sessions yet.
36 Terms
exponential population growth model
TWO WAYS TO WRITE IT
- dN/dt = rN
- (b-d)N= rN
exponential growth model assumes
TWO ASSUMPTIONS
1.) essential resources are unlimited
(space, food etc)
2) environment is constant
(no seasonal or annual variation that might influence the probabilities of birth or death
Why can't environments be constant in real life?
1.) resources are limited
2). environment is not constant
3). as the density of the population increases, the demand for resources increases
per capita birthrate (b) decreases
population size (N) increases
the graph presents an example of a liner function of population size N
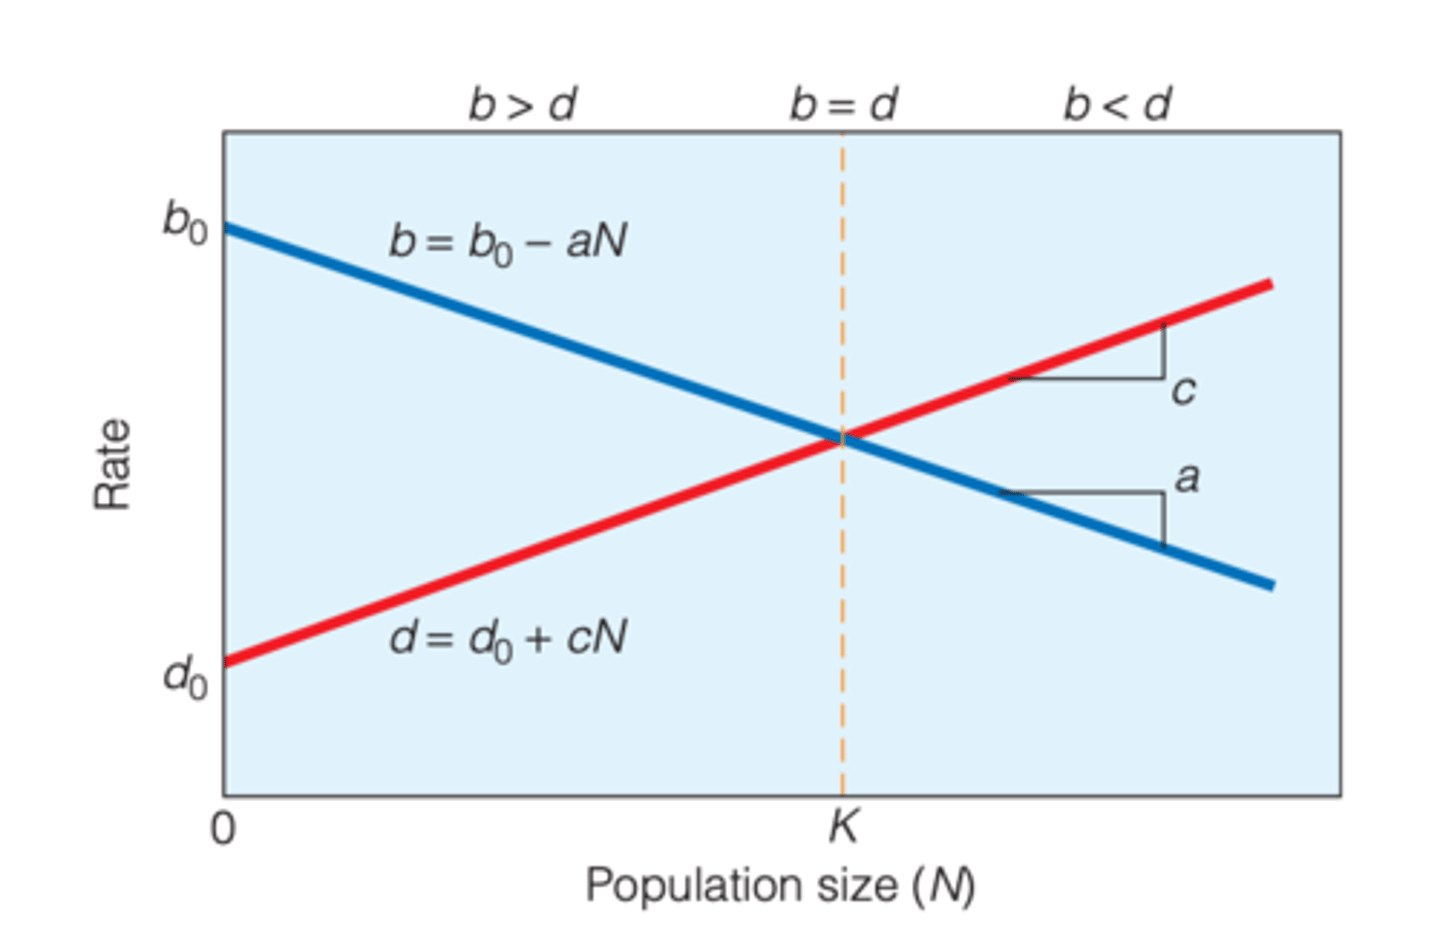
logistic model of population growth
includes both and death rates that very with population size
---------------
HAS TWO COMPONENTS:
- rN
- (1-N/K)
logistic model of population growth (equation)
dN/dt = rN(1 - N/K)
what does rN represent
exponential growth
---------------
r = maximum/intrisic growth rate
---------------
UNITS OF r?
- individuals/individuals*year
(year can also be months days hours as long as its a time interval)
what does (1-N/K) represent
the effect of K on population growth
---------------
RULES:
- when N < K = term is close to 1
- as N approaches K, the term approaches 0 (indication of slowing population growth)
- if N > K = population growth will be negative
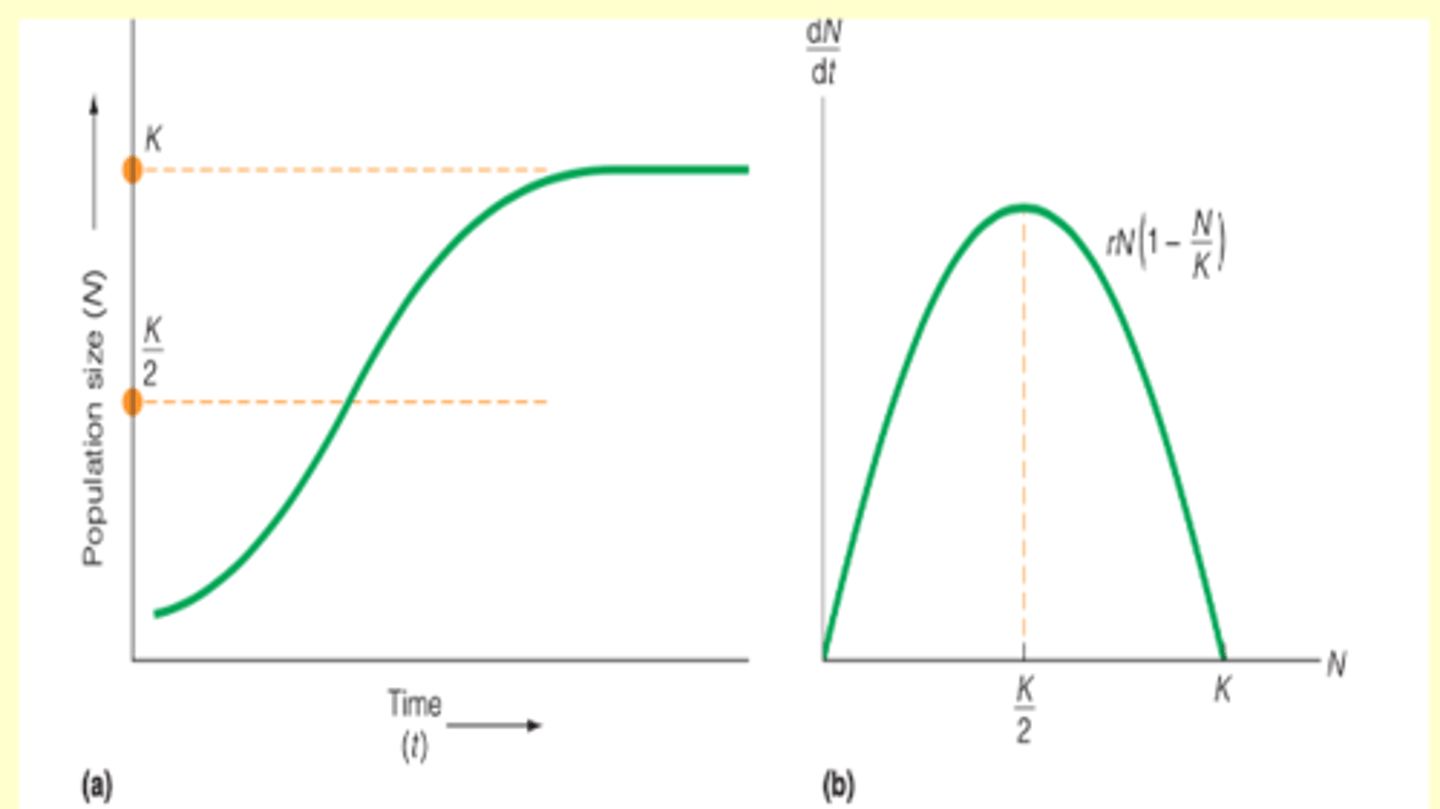
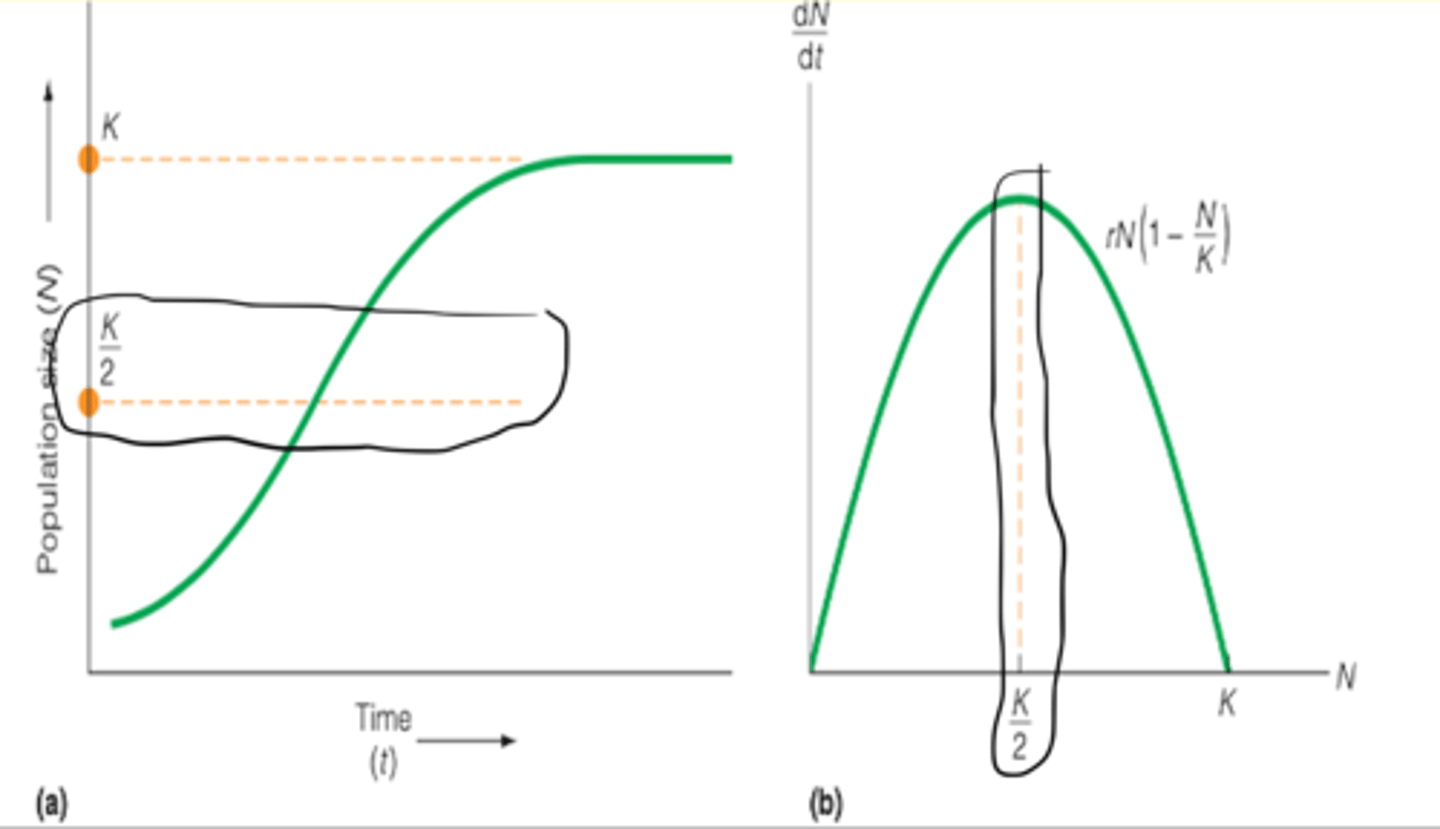
when is the rate of population growth the highest
rate of population growth (dN/dt) is at its highest when:
N = K/2
---------------
inflection point

inflection point
the point on a growth curve at which the population has its highest growth rate
---------------
RULES (BOOK)
- anything past the point will decrease as it approaches the carrying capacity
EXAMPLE of infliction point (gray squirrel population)
K= 200 individuals squirrels
r = 0.18 (pretty healthy)
N= 30 individuals
---------------
Exponential: dN/dt = rN
logistic: rN(1-N/K)
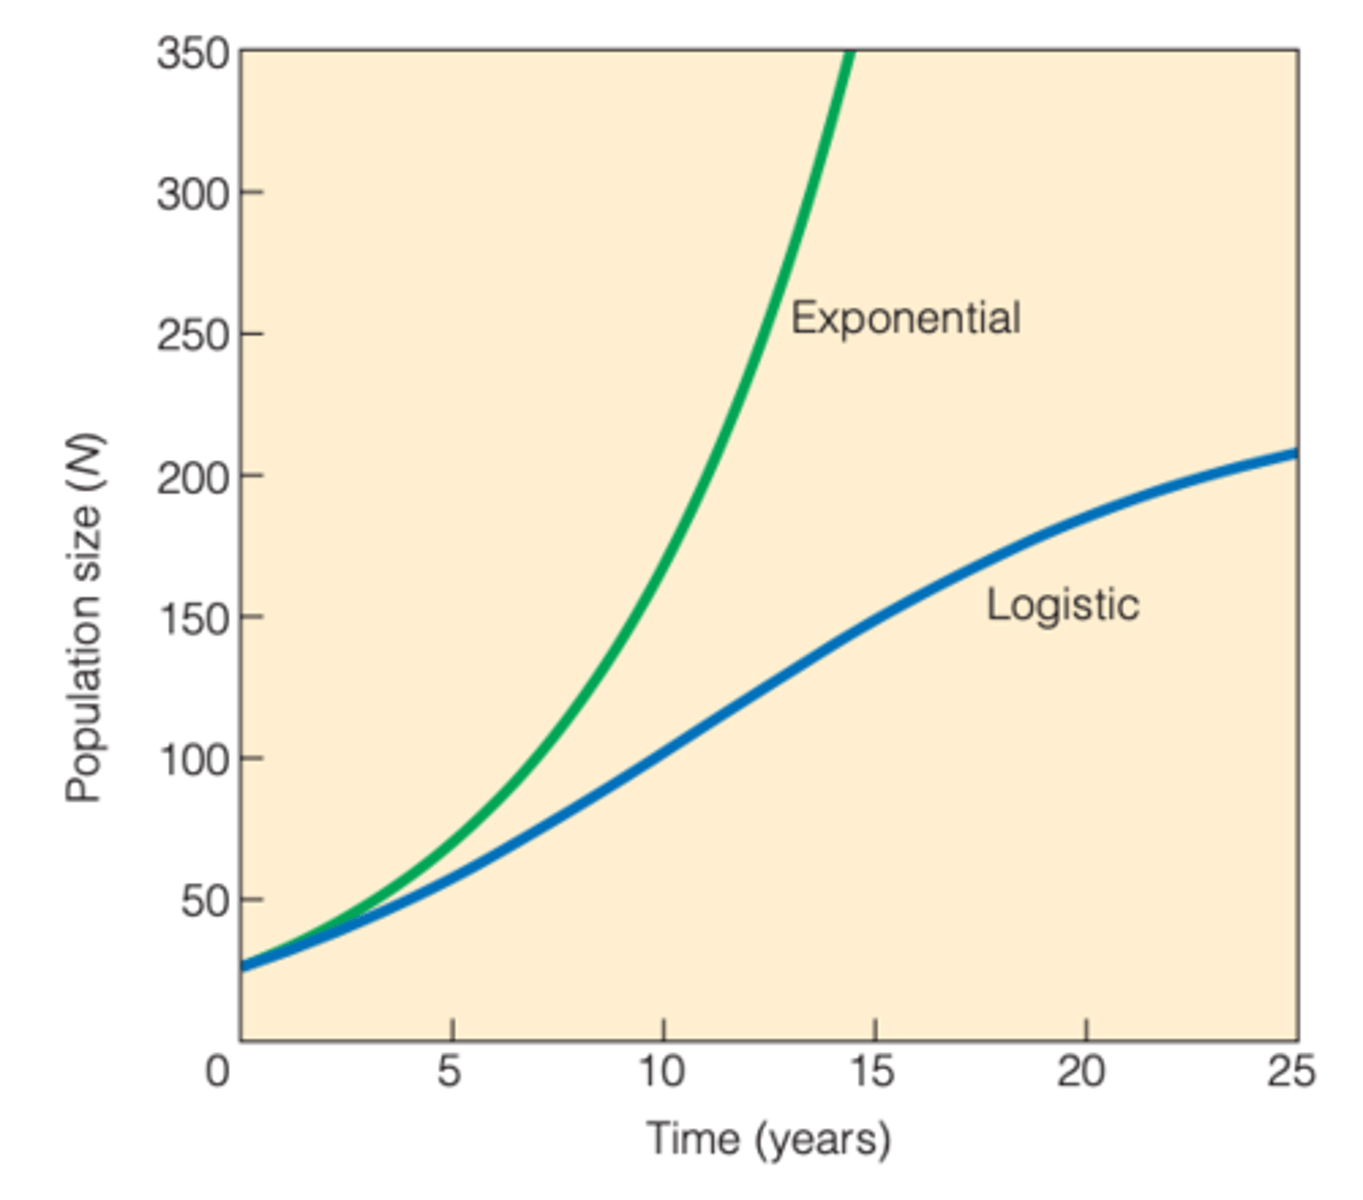
concept of carrying capacity (K) suggest
a negative feedback between population increase and resources available in the environment
---------------
TREND:
- as population density ↑ then the per capita availability of resources ↓
(reduced availability will regulate population growth)
density-dependent effects influence
a population in proportion to its size
---------------
TYPES OF EFFECTS:
- Density-dependent mortality
- density- dependent fecundity
- full density-dependent regulation
density-dependent fecundity
TREND:
- as population density ↑ then fecundity ↓
---------------
BOOK NOTES
- Mortality is independent, but birthrate declines with population size.
- At K, a decreasing birthrate maintains equilibrium.
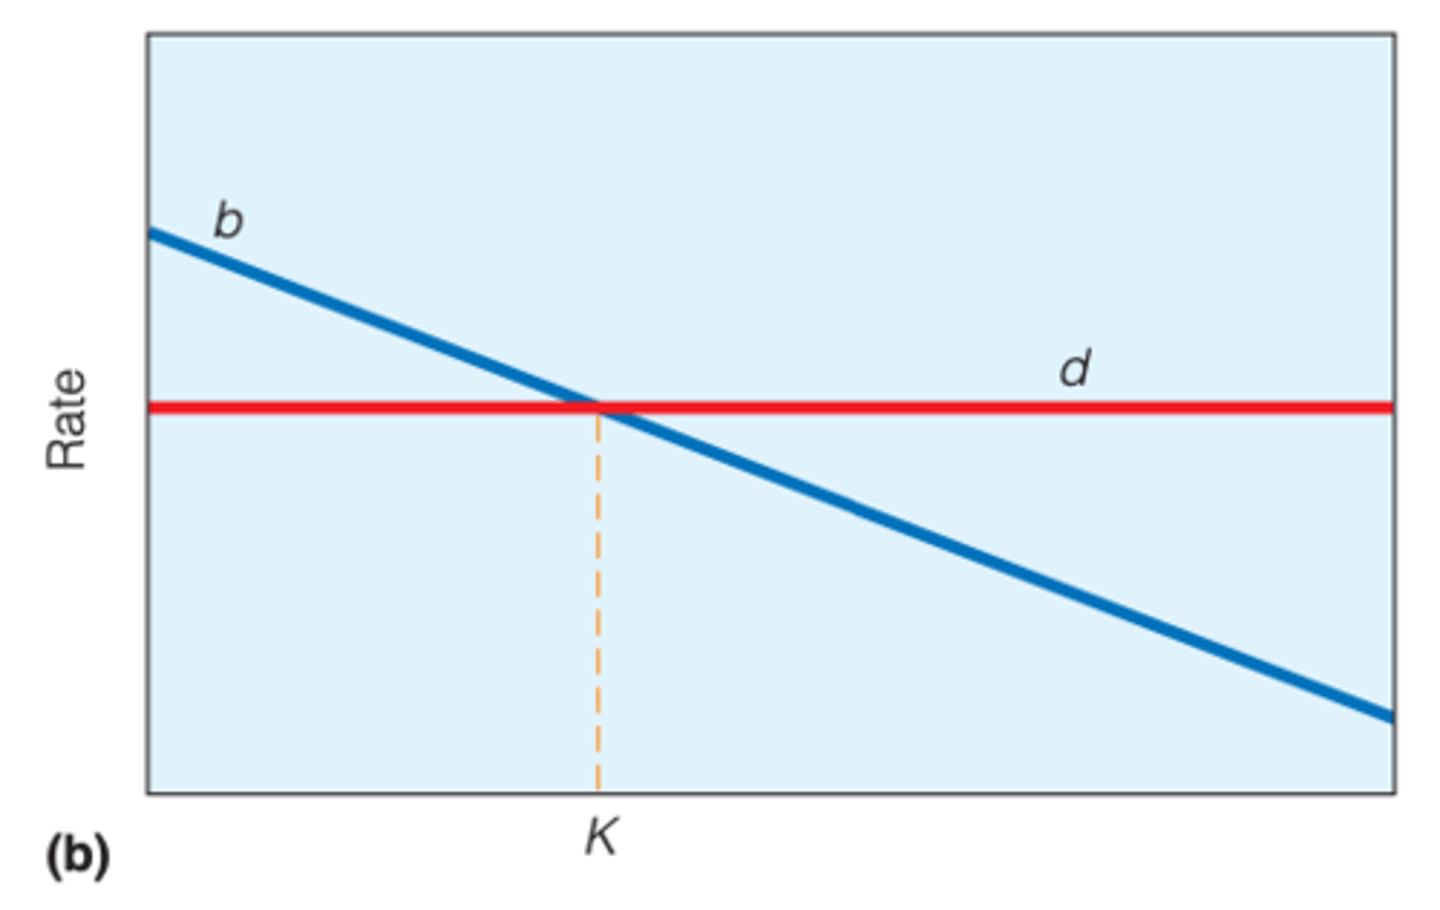
Density-dependent mortality
TREND (LEC)
as population density ↑ then rate of mortality ↑
---------------
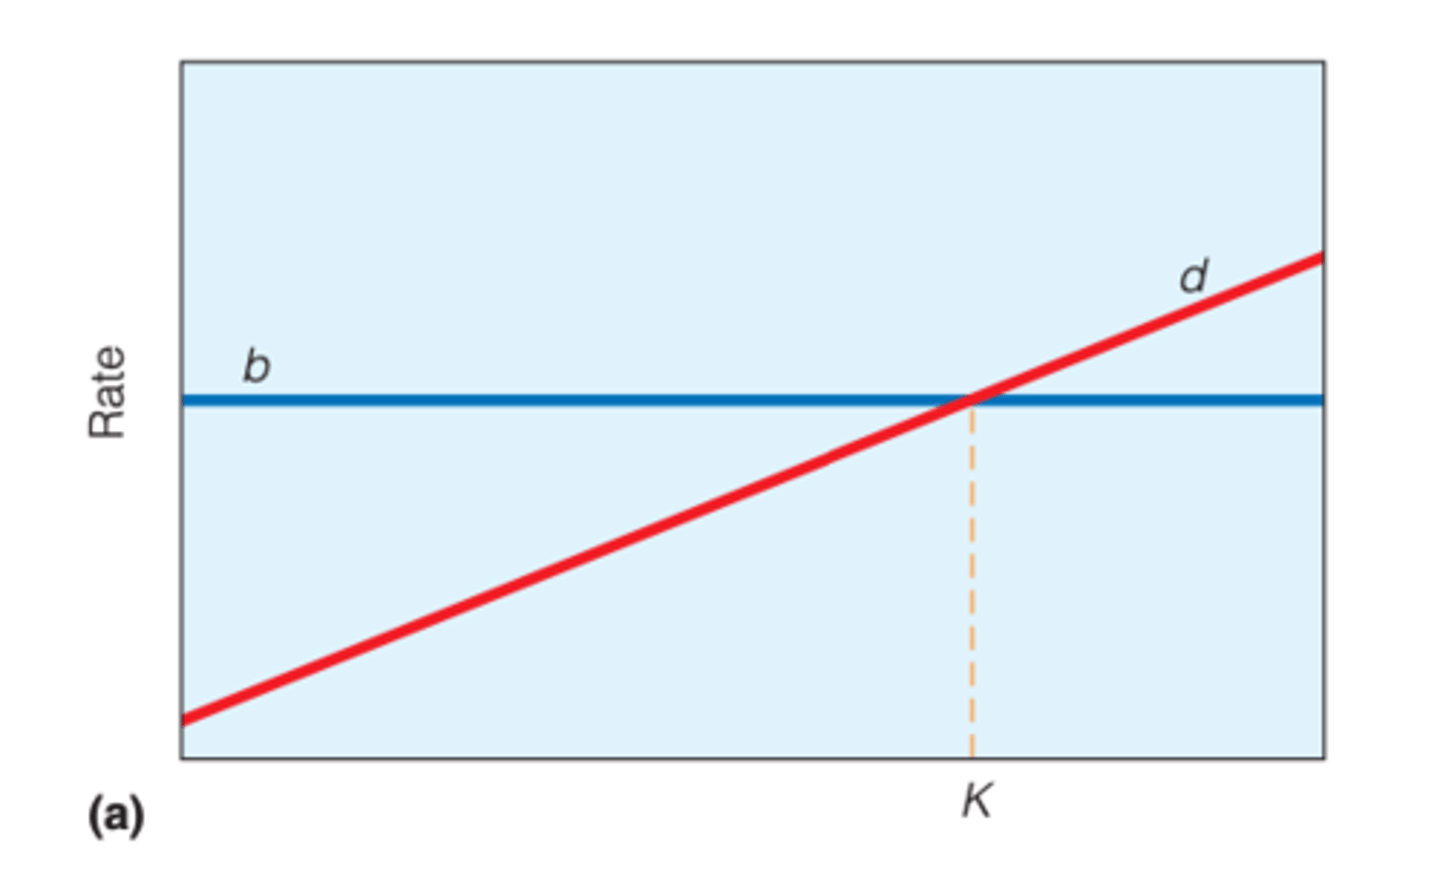
BOOK NOTES
- Birthrate (b) is independent of population density
- Only the death rate (d) increases with population size
- At K, equilibrium is maintained by increasing mortality.
Full-density dependent regulation
(LEC)
both can occur simultaneously in a population
---------------
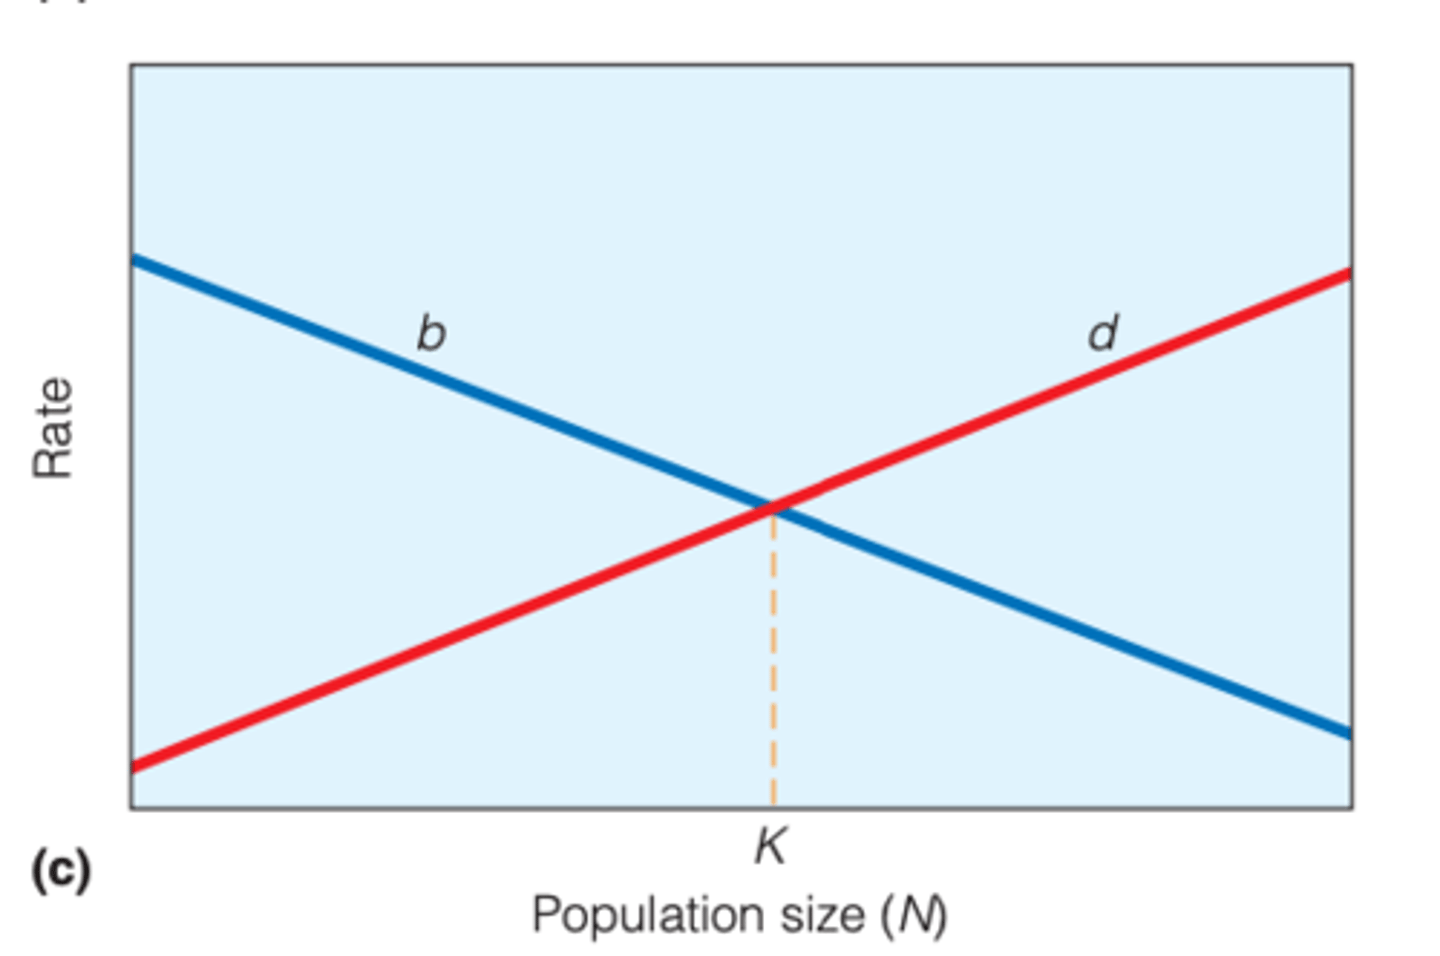
BOOK NOTES
- Both birthrate and mortality are density dependent.
- Fluctuations in either one hold the population at or near K.
more proximate mechanisms include:
- reduced resource avialability
- changes in patterns of predation
- spread of disease and parasites
density-independent factors
environmental events that affect the population
---------------
BOOK NOTES
- can affect the population regardless of # of individuals or if the proportion of individuals affected is the same at any density
examples of density independent factors
natural disasters which include:
- floods
- fires
- storms
competition
(BOOK/LEC)
- when individuals use common resource that is in short supply relative to the # seeking it
---------------
RULES FOR COMPETITION:
- as long as the availability of resources doesn't impede the availability of individuals to survive, grow, and reproduce, no competition exists
intraspecific competition
competition among individuals of the same species
Why is intraspecific competition very common?
(LEC:)
- members of the same species have very simple resource requirements and live in the same habitats as one another
---------------
(BOOK:)
- When resources are insufficient to satisfy all individuals, the means by which they are allocated has a marked influence on the welfare of the population.
as population density ↑
resources become limited
---------------
WHY? (BOOK/LEC)
- either some or all individuals reduce their use of resources
as population density ↑ toward a point at which
resources are insufficient to provide for all individuals in the population
---------------
LEC:
- either some or all individuals reduce their use of resources
- leads to density dependent growth
density-dependent growth
the result of an inverse relationship between population density and individual growth
---------------
- examples of this inverse relationship is observed in a wide variety of plant and animal populations
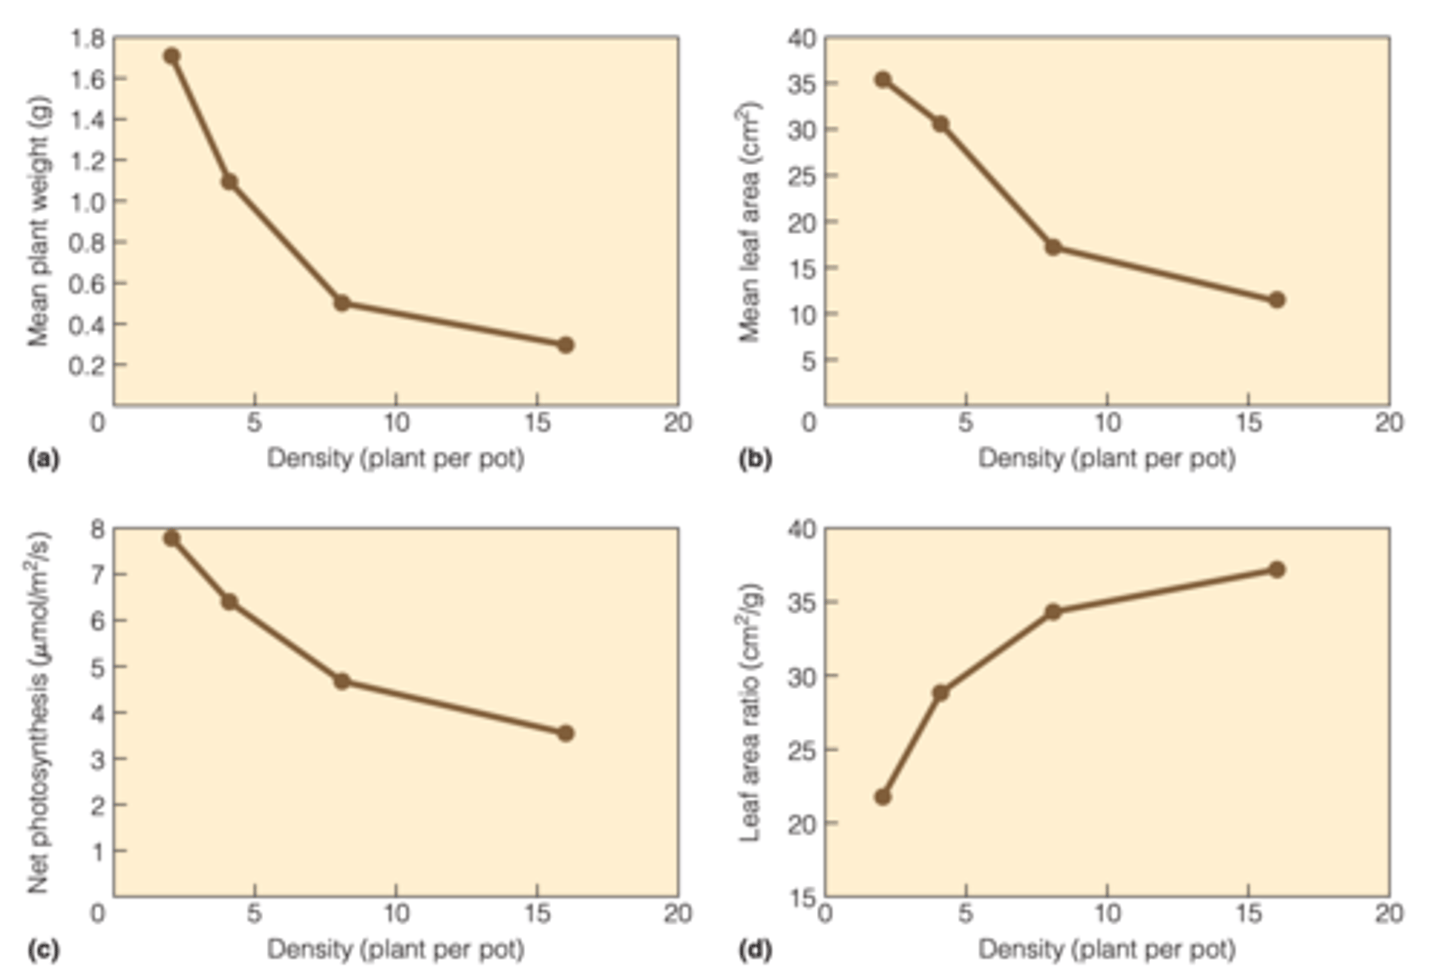
effects of intraspecific competition on growth and photosynthesis of Atriplex prostrata
MEAN VALUES OF (BOOK)
A): plant dry weight (accumulated biomass)
B): leaf area
C): net photosynthetic rate
D): leaf area ratio
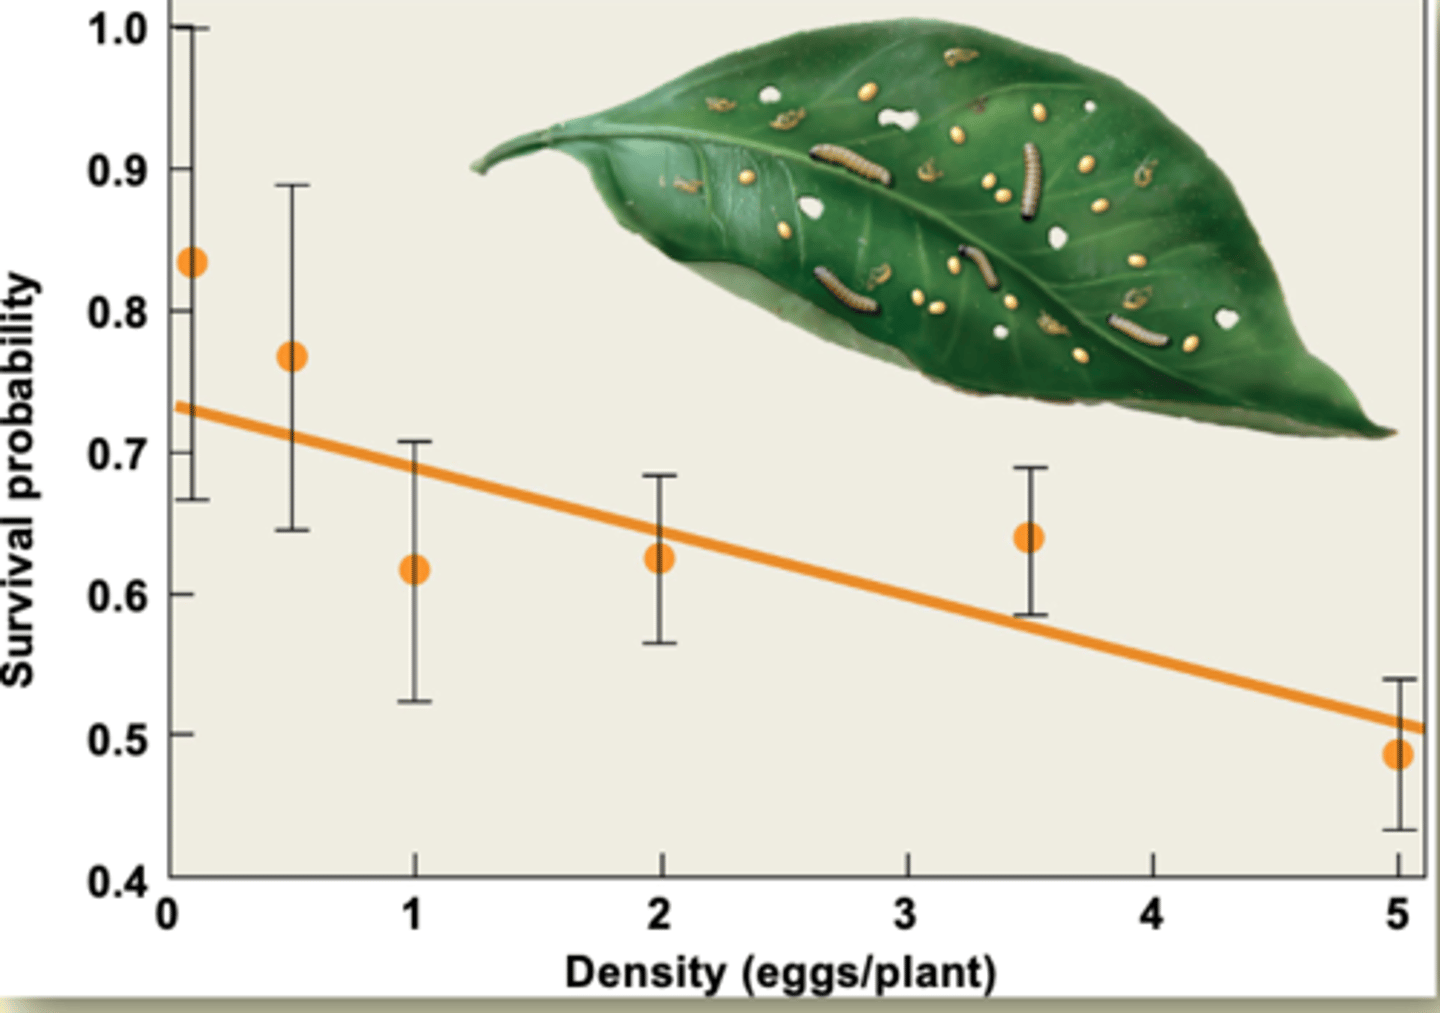
density dependent survival in monarch butterflies
function of intraspecific competition
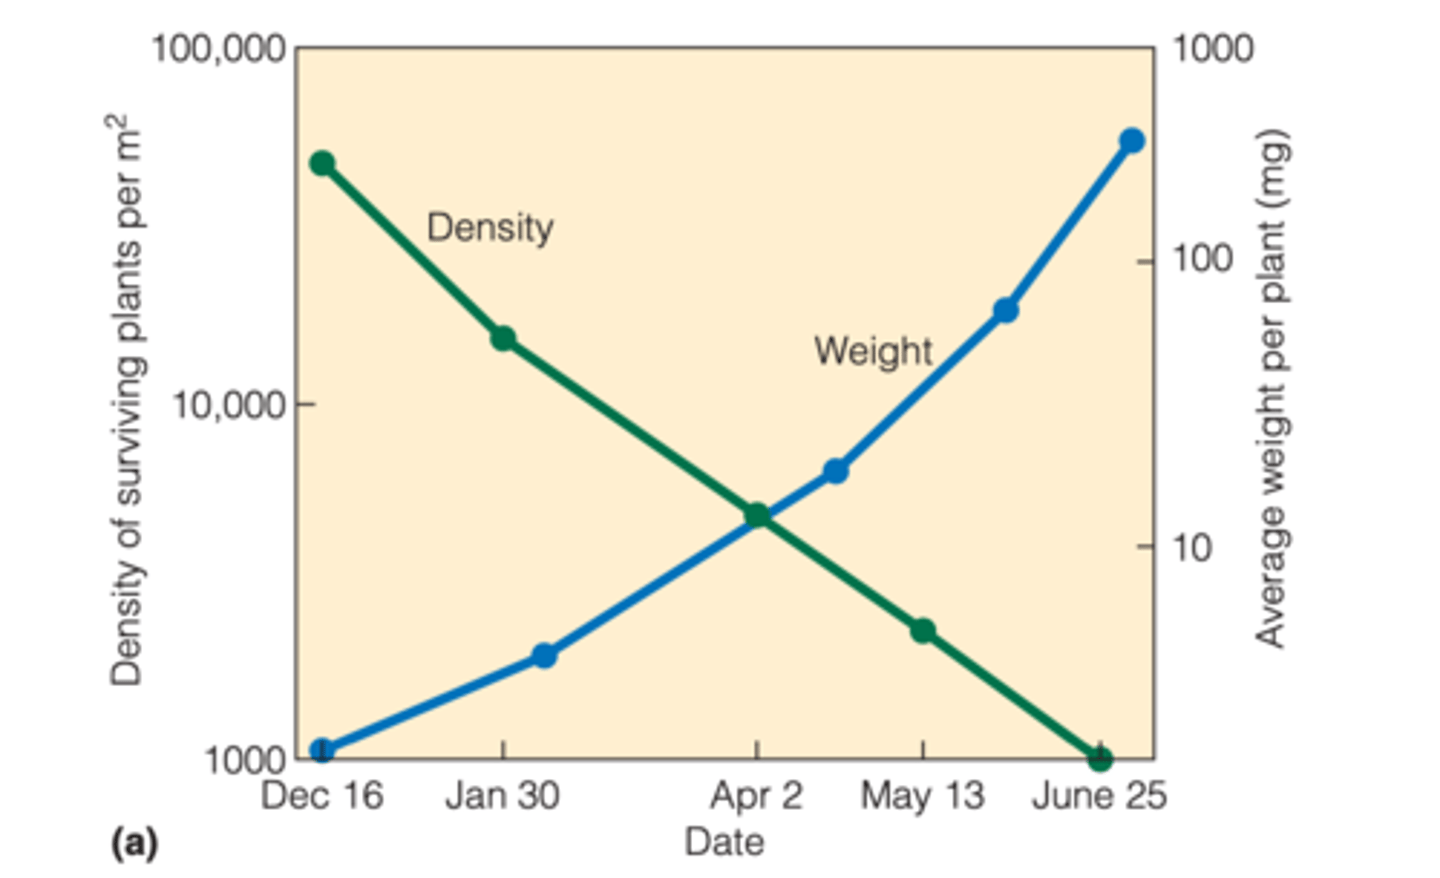
experiments with horseweed
- seeds were planted at a density of 100,000 seeds/m^2
- as the seedlings grew, there was competition among the plants for limited resources
---------------
MAIN TREND (BOOK)
- The death of individuals ↑ the per capita resource availability, and the average size of the surviving individuals ↑ as population density ↓
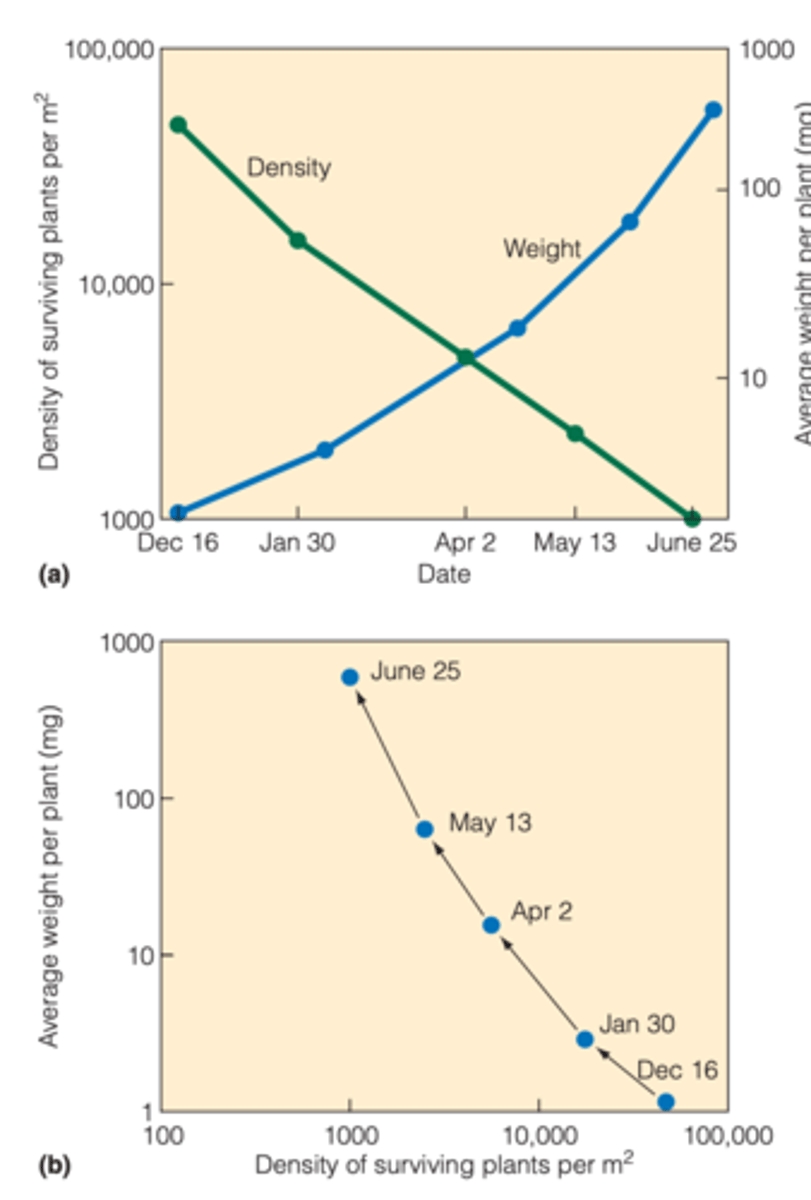
summary of horseweed experiment (LEC)
remaining seedlings i↑ in size because per capita resource availability was ↑ by the death of 99% of the seedlings
---------------
AKA: self thinning
self thinning
caused by the combined effect of density-dependent mortality and growth within a population
---------------
TREND:
- as density ↓, growth of the remaining individuals ↑
where is self thinning usually seen
seen in plant populations and some sessile animals
---------------
EXAMPLE:
- barnacles
- mussels
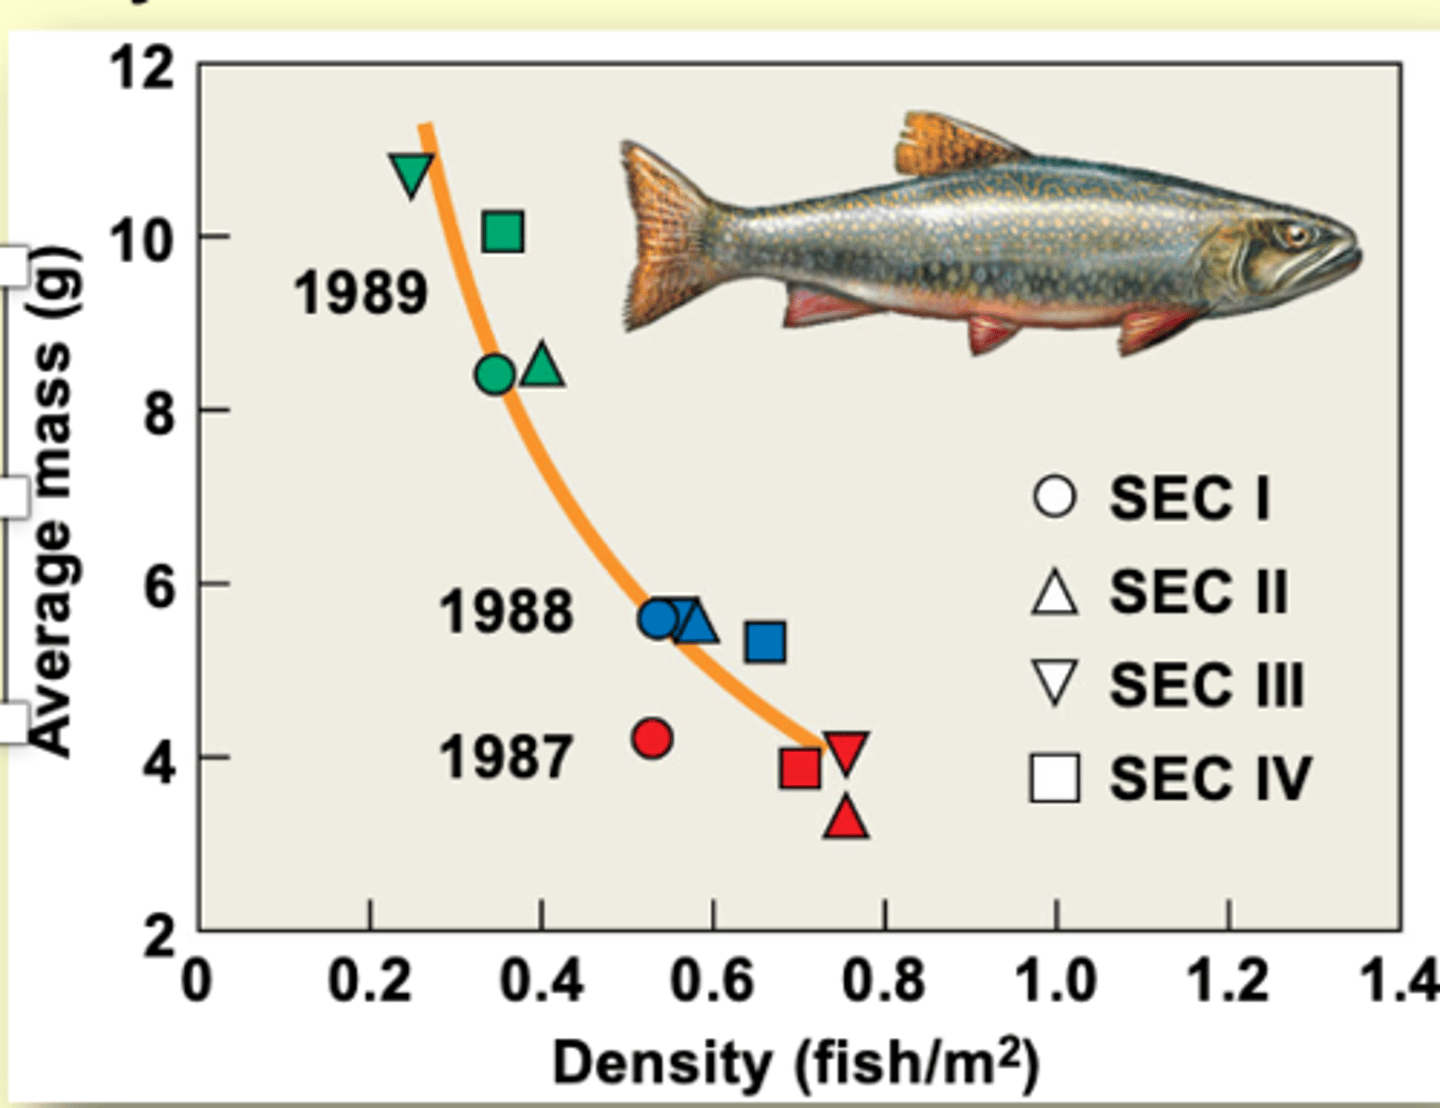
mobile organisms and self-thinning
Most evidence of self-thinning in mobile organisms comes from studies of stream-dwelling fish populations.
brown trout in streams trend
higher the density of fish in stream means smaller fish size
---------------
BOOK
- data reveals an inverse relationship between average mass of individuals and density of surviving brook trout over the study period
competition with a population can reduce
fecundity
---------------
EXAMPLE:
- female harp seals: reach the age of maturity when they reach 87% of their mature body weight
when population density is higher, females show
reduced weight gain
---------------
CAN RESULT IN AN:
- delay the onset of sexual maturity
delay the onset of sexual maturity
fertility (b) in this species is density-dependent
---------------
LEC NOTES:
bird, fish and plant populations can show similar patterns