PSM: Demography
1/17
There's no tags or description
Looks like no tags are added yet.
Name | Mastery | Learn | Test | Matching | Spaced |
|---|
No study sessions yet.
18 Terms
Definition of demography
Scientific study of population focuses its attention on:
Population size,
composition and
distribution of population
5 demographic processes are
Fertility
Mortality
Marriage
Social mobility
Migration
Which are at work within a population that determine the size, composition and distribution.
Demographic cycle of 5 stages, mention and describe in brief
High stationary
High birth rate and death rate
India till 1920
Early expanding
Birth rate is unchanged but death rate starts to decline
South Asia, South Africa
Late expanding
Birth rate declining but death rate declines further
India now
Low stationary
Most industrialised country
Uk, Denmark, Sweden
Declining
Birth rate lower than death rate
Germany, Hungary
Demographic indicators are divided into:
Population statistics include indicators that measure the
A. population size,
B. sex ratio,
C. density ratio and
D. dependency ratio
Vital statistics include indicators such as
A.birth rate,
B. death rate,
C. natural growth rate,
D. life expectancy at birth,
E. mortality and
F. fertility rates
Family size vs complete family size
Family size- total number of children borne by a woman at a point of time
Complete family size- total no of children borne by woman during her reproductive age given by total fertility rate
Urbanisation- what is urban area (4 points)
Town,
Population >5000,
Density of not less than 1000 per square mile or 390 per square km,
At least 3/4th of male population employed in pursuits other than agriculture
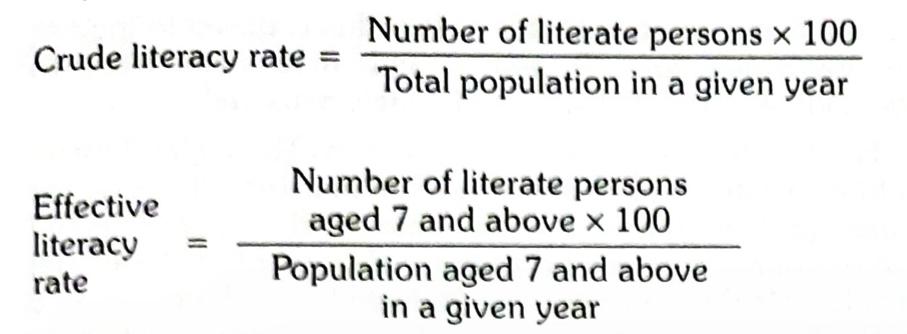
Literacy rate- effective literacy rate and crude literacy rate formula
Indian government schemes for literacy
Sarva Shiksha abhiyan(2001)- all children of age group 6-14 must attend school and complete 8 years of education
National literacy mission
District primary education programme
Literacy rate of India
74.04%
Highest- Kerala- 93.9%
Lowest- Bihar
Male>female but the gap is decreasing
Life expectancy of India
67.5 years
Population pyramid-
Population pyramid is also known as
what is it
Types
what is the use
Age and sex pyramid
It is a dual histogram that shows distribution ages across population divided down in the centre between male and female with youngest at the bottom
Stationary, expansive, constrictive
Use- distribution age and sex in a population,
difference between male and female population,
See the number of dependent and
general structure of population at a given time
Population pyramid of developing country
Broad base and narrow/tapering top- expansive pyramid
Utility of pyramid
Shape
Upright triangle- expansive type (developing)
Spindle shape- broad belly (high proportion of adult pop) and constrictive type
Height
Tall- high life expectancy (in developed country)
Short- low (in developing country)
Symmetry
Symmetric- ideal sex ratio (developed country)
Asymmetric- unfavorable sex ratio <1000 females for 1000 male population (in developing country)
Total dependency ratio in India
53 (100 working age persons support 153 people including themselves
Demographic time and demographic dividend
Period of time in which proportion of working group persons are prominent
And rise in economic growth due to rise in working age people in population
Sex ratio- definition and factors affecting it
Number of females for every 100 males
Factors- sex selective migration, sex discrimination, sex ratio at birth, mortality rate of male and female