Stats: Overview of Inferential Stats
1/37
There's no tags or description
Looks like no tags are added yet.
Name | Mastery | Learn | Test | Matching | Spaced | Call with Kai |
|---|
No study sessions yet.
38 Terms
hypothetico-deductive method
positivist research design based on the development and systematic testing of hypotheses
grounded theory
an inductive method of generating theory from already collected data by creating categories in which to place data and then looking for relationships among categories
population mean
μ
sample mean
x̅ or M
population standard deviation
σ
sample standard deviation
SD
population variance
σ²
sample variance
s²
sampling distribution
a distribution of statistics obtained by selecting all the possible samples of a specific size from a population
Central Limit Theorem
The theory that, as sample size increases, the distribution of sample means approaches a normal distribution.
standard error of the mean
the standard deviation of a sampling distribution. the error in samples' means compared to population mean
population standard deviation (σ)/ square root of sample size (n)
what is the formula to calculate standard error of the mean?
pooled error
type of standard error (of mean) used when there is homogeneity of variance (variance is equal)
null hypothesis
the hypothesis that there is no significant difference between specified populations, any observed difference being due to sampling or experimental error
alternative hypothesis
The hypothesis that states there is a difference between two or more sets of data
reject, retain
if your data shows differences you __ the null and __ the alternative hypothesis
one-tailed alternative hypothesis
a type of alternative hypothesis in which only one direction of an effect or relationship is predicted
two-tailed alternative hypothesis
a type of alternative hypothesis in which it is predicted that the two groups being compared will differ, but does not predict the direction of that difference
rejection region
area of a sampling distribution that corresponds to test statistic values that lead to rejection of the null hypothesis. determined by the alpha
retention region
area of the sampling distribution that lies in central portion and consists of the values that are likely to occur as a consequence of sampling error only
rejection region, retention region
if the alpha is 0.05 then 5% of the sampling distribution represents the... and 95% of the sampling distribution represents the...
alpha
level of significance
statistically significant
if the sample value lies in the rejection region, the results are said to be...
signifiance
shows if an effect exists
split in half
when a two-tailed test is used, the percent of the sampling distribution in the rejection region (determined by alpha) is ___
p value
The probability level which forms basis for deciding if results are statistically significant (not due to chance). if this value ≤ α: The result is statistically significant, and the null hypothesis is rejected.
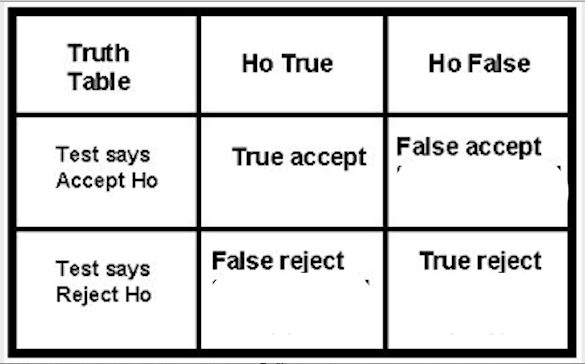
type I error
Rejecting null hypothesis when it is true (false positive)
type II error
failing to reject a false null hypothesis (false negative)
alpha
the probability of type I error is...
beta
the probability of type II error is...
power
likelihood of detecting the effect (most directly associated with the chance of finding significance)
inverse (as probability of one increases, the other decreases)
there is a ___ relationship between type I and type II errors
statistical power
when a statistical test enables you to reject a false null hypothesis, the test has ___.
1 - beta
Power =
increase alpha, increase sample size, use one-tailed test, use a parametric test, minimize random error
how do you increase power?
increase __ and __
use a ___ and a ____
minimize ___
1-alpha
type II error, beta
type I error, alpha
power, 1-beta
true accept:
false accept:
false reject:
true reject:
sample size
using a small ___ makes it easy to find significant differences (that aren't there)
statistical nonsignificance, low power
it is least informative to have ___ significance under ___ power