Unit 4: The Macroeconomy
1/48
There's no tags or description
Looks like no tags are added yet.
Name | Mastery | Learn | Test | Matching | Spaced | Call with Kai |
|---|
No analytics yet
Send a link to your students to track their progress
49 Terms
national income statistics
- total value of a country's final output of goods/services in a year, including net property income from abroad and depreciation
- used to compare countries' economic performance and to give a perspective to key economic indicators.
net property income from abroad
- inflow of interests
- the income that the country's residents earn on their physical assets (such as factories and leisure parks) owned abroad and foreign financial assets (such as shares and bank loans) minus the returns on assets held in the country but owned by foreigners.
- (profits + dividends from abroad) - outflow of money
GDP (gross domestic product)
- monetary measure of the market value of all the final goods and services produced in a specific time period by a country.
GDP at market price = GDP at factor cost + indirect taxes - subsidies
GDP at factor cost = GDP at market price - indirect taxes + subsidies
measuring GDP
expenditure method = C + I + G + (X - M)
income method = total national income + sales taxes + depreciation + net foreign factor income
output method = gross value of output - value of intermediate consumption
GNI (gross national income)
- gives the measure of the income of the country's residents
- GDP + national income earned from abroad
NNI (net national income)
- GNI taking into account the depreciation of fixed capital assets due to wear and tear
- GNI - depreciation
factor price vs market price
market price: value in terms of actual market prices in which goods are sold in 1 year (includes taxes, excludes subsidies)
factor price: amount producer receives from consumer per unit of goods purchased (includes subsidies, excludes taxes) also might exclude transport costs if they are invoiced seperately
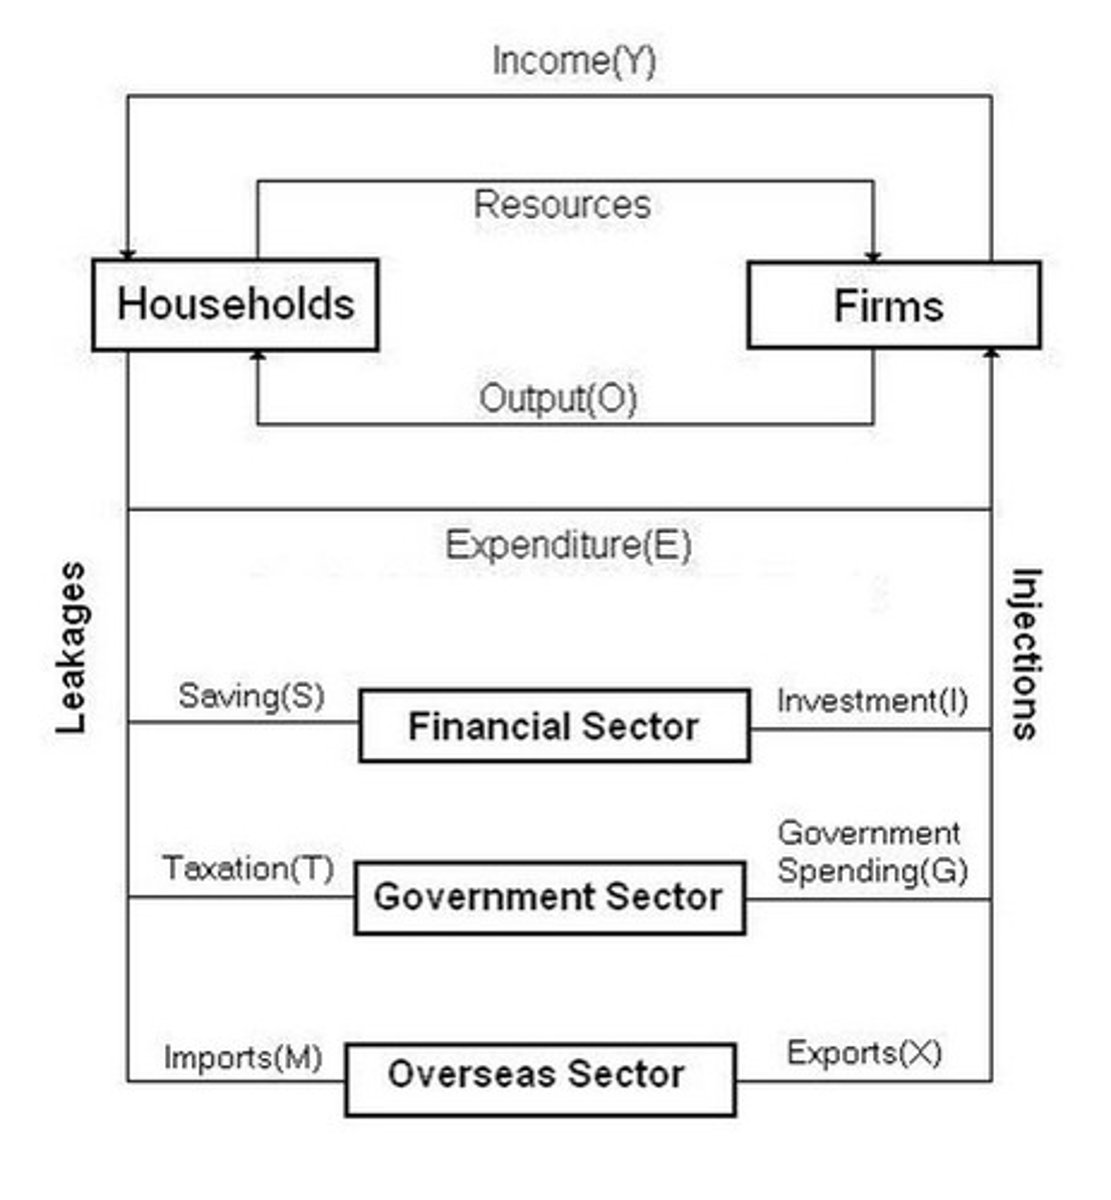
circular flow of income
shows how money circulates in an economy between households, firms and the government
in a closed economy: no foreign involvement, leakages & injections exclude imports and exports. (just C, I, G)
in an open economy: has foreign involvement, leakages & injections include imports and exports. (C, I, G, X & M)
*equilibrium is achieved when leakages = injections
aggregate demand (definition & components)
definition: the amount of goods and services that consumers, businesses, government and foreign buyers are willing and able to buy at various price levels
components: [AD = C + I + G + (X - M)]
- C: consumption (households & consumers)
- I: investment (firms & companies)
- G: govt. expenditure (consumption by govt.)
- (X - M): net exports where x = exports & m = imports
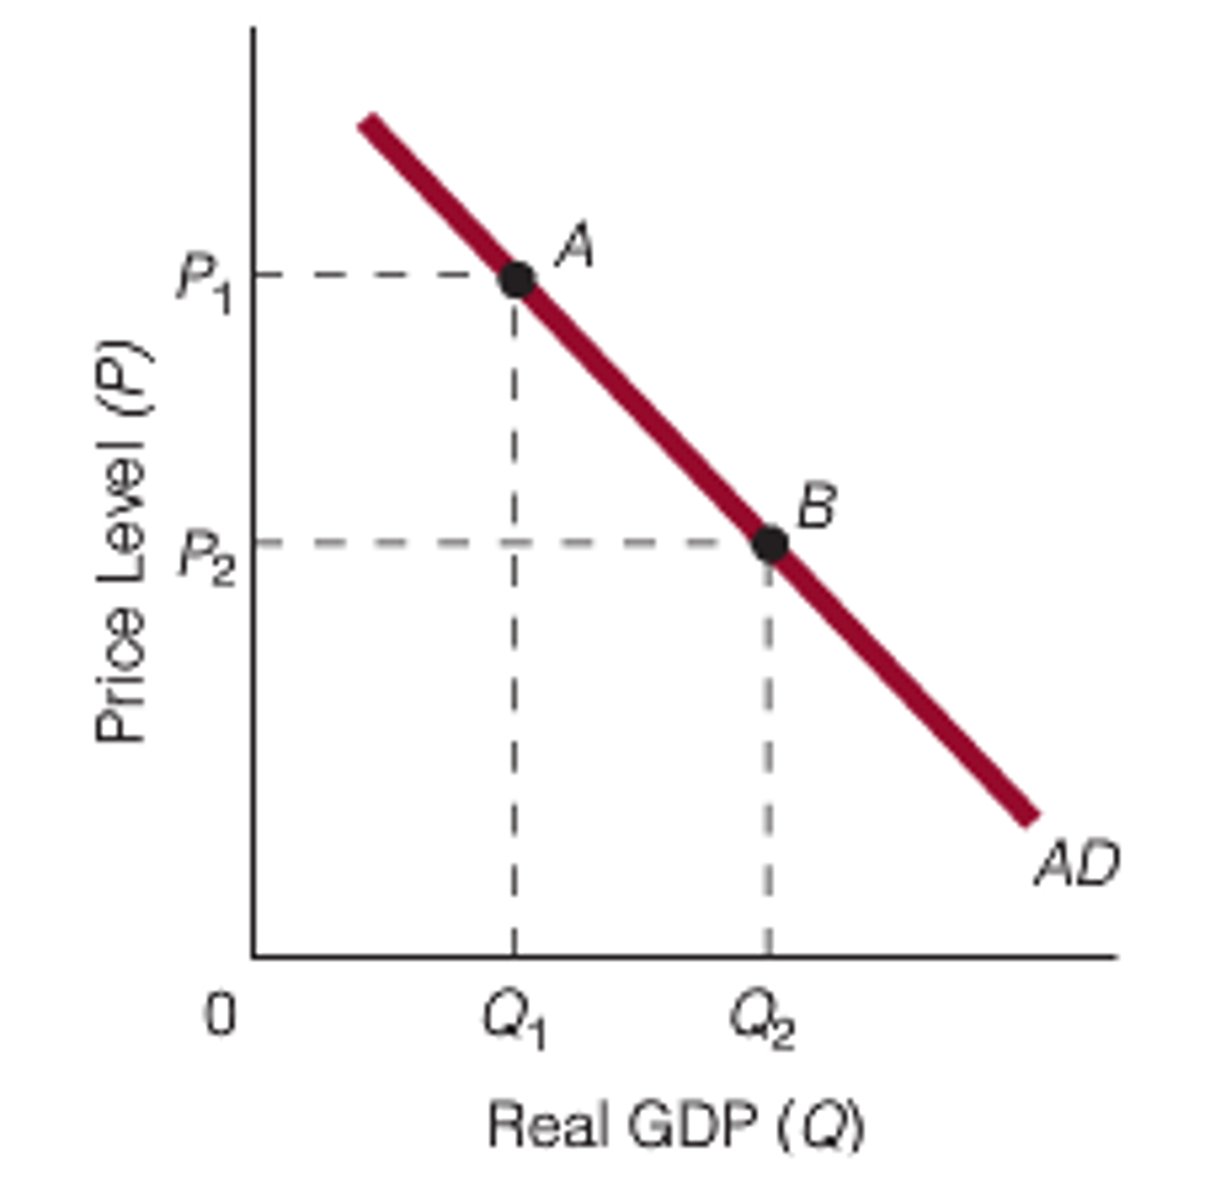
AD curve (and its effects)
- shows the quantity of all g & s demanded in the economy at any given price level
- price & output are indirectly proportional
1. foreign trade effect: p falls, x rises, c rises (or vice versa)
2. wealth effect: p rises, c falls (or vice versa)
3. interest rate effect: p rises, i falls (or vice versa)
determinants of AD (why the curve might shift)
changes in C
- stock market boom/crash
- preferences → consumption/saving tradeoffs
- tax hikes/cuts
changes in I
- firms buy new computers, equipment, factories
- change in interest rates, monetary policy
- investment tax credit or other tax incentives
changes in G
- federal spending, ex. defense
- state & local spending, ex. roads, schools
changes in NX
- booms/recessions in countries that buy our exports
- appreciation/depreciation resulting from international speculation in foreign exchange market
consequences of rise in price level
- nominal interest rates rise
- purchasing power is reduced
- domestic goods become more expensive
*price changes cause movement along the curve
aggregate supply
level of real GDP that will be produced at each possible price level
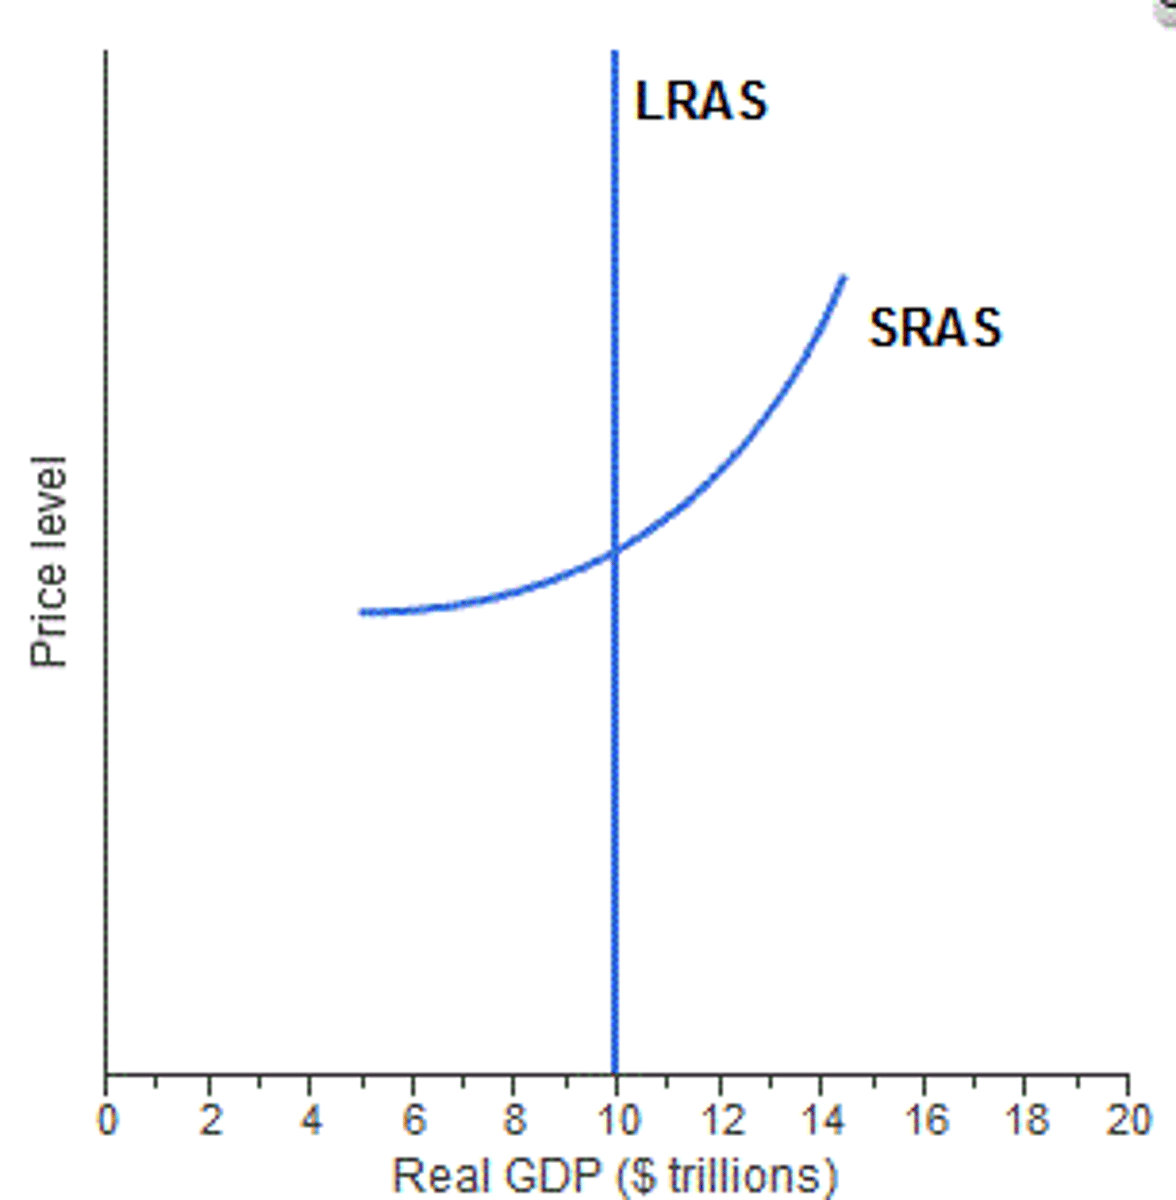
short run As curve (SRAS)
the output that will be supplied in a period of time when the prices of factors of production (inputs, resources) have not had time to adjust to changes in aggregate demand and the price level
rise and fall of SRAS (causes)
rise in SRAS
- decrease in production costs
- cut in indirect taxes
- increase in subsidies
- +ve supply shocks (ex. new raw materials, tech advancements etc)
- improvements in productivity
fall in SRAS
- increase in production costs
- increase in indirect taxes
- decrease in subsidies
- -ve supply shocks (ex. wars, explosions, natural disasters, etc)
- fall in productivity
long run AS curve (LRAS)
- when AS reaches full capacity → all resources are fully employed
- no ability to increase output
- if LRAS shifts to the right → PPC grows outwards
keynesian LRAS
the shape of the Keynesian LRAS is determined by the level of spare capacity in the economy.
- when the economy has a large spare capacity the LRAS is perfectly price-elastic (i.e. represented by a horizontal line).
- when the economy has a no spare capacity the LRAS is perfectly price-inelastic (i.e. represented by a vertical line).
rise and fall of LRAS (causes)
rise in LRAS
- increase in workforce (immigration, lower labour minimum age)
- increase in capital stock
- higher quality education
- increase in productivity
fall in LRAS
- decrease in workforce (brain drain, emigration, higher labour minimum age)
- destruction of capital assets
- negative supply shocks
- decrease in productivity
economic growth
- increase in GDP every financial year (per head per capita)
- short run → increase in country's output (movement within PPC or along the curve)
- long run → increase in country's productivity (shift of PPC curve)
economic growth rate: annual % change in output
economic development
- process of improving people's economic well-being & quality of life
- broader view of economic growth
nominal vs real GDP
nominal GDP
- prices operating in the year in which output is produced
- GDP at current prices, does not count inflation
real GDP
- constant prices → prices operating in a selected year
*nGDP > rGDP = deflation
*nGDP < rGDP = inflation
calculating real GDP
nominal GDP x (price index in base year/price index in current year)
causes of economic growth
short run (AD curve shifts to the right)
- if there is spare capacity, output can be increased as a result of rise in AD due to rise in G and C
long run (LRAS shifts to the right)
- for sustained rise in economic growth → rise in quantity & quality of resources
consequences of economic growth
- more resources for education, fewer resources for healthcare
- more production of capital goods, fewer consumer goods, lower living standards
- research & development that leads to advances in tech also use resources that have alternate uses
cost benefit analysis of economic growth
- current consumption of goods and services will be reduced, so more capital goods can be produced
- increased stress & anxiety
- benefit → more goods & services, material living standards also rise
- increased working hours
- easier to help the poor
definition of unemployment
people of working age who are without work, available for work, and actively seeking employment
unemployment rate
the percentage of the labor force that is unemployed (no. of unemployed/labour force x 100)
ways to measure unemployment
claimant count - no. of people who self register as unemployed
labour force survey - survey done of each household where they self classify as being unemployed or economically active
issues with these measures of unemployment
- excludes the economically inactive
- people could be lying abt being unemployed for the benefits
- doesn't count the underemployed people - people working part time or lower than their full capacity and are searching for better jobs
- 'disguised' or 'hidden' unemployment with many people working to earn cash in informal labour markets
- sample errors (people counted twice, or missed people etc)
causes of unemployment
- decline of manufacturing
- occupational immobility
- geographical immobility
- improvement in technology
- foreign competition - rising imports
types of unemplyment
demand side
- cyclical unemployment: happens due to decrease in AD, which reduces demand for goods and services, reducing a need for a lot of workers (business cycle)
supply side
- structural unemployment: occurs due to changing structure of economy (tech innovations etc that puts people out of jobs)
- frictional unemployment: short term unemployment, has no -ve effect on the economy (like when people leave a job to find a new one, people js graduated n are looking for jobs etc)
- seasonal unemployment: unemployment on a seasonal basis (ex. tourism, agriculture, construction, etc)
ways to cure cyclical unemployment
govt can introduce expansionary fiscal or monetary policy measures to increase aggregate demand like:
- a cut in corporate taxes to stimulate investment
- an increase in government spending
- a reduction in indirect or direct taxation to increase consumer expenditure
ways to cure structural unemployment
- education needs to be more occupationally flexible
- adult retraining programs
govt. can
- encourage companies to organise training programs
- encourage people to move to other areas & regions w better jobs opportunities
ways to cure frictional unemployment
- reduce unemployment benefits to encourage people to look for a job
- improved channels of communication for existing job opportunities
ways to cure seasonal unemployment
- provide jobs in off season
- diversify the economy
- train them to do other skills
- provide info about jobs
consequences of unemployment (social costs)
- poverty
- high rates of crime
- vandalism
- increased gang activities
consequences of unemployment (economic costs)
- loss of output
- low income & low tax-base
- huge pressure on the economy
- more expenditure in terms of transfer payments
- opportunity cost: as same money could have been spent on infrastructure
- government may have to borrow to fund its deficit and later impose other taxes in order to cover up the gap
definition of inflation
sustained rise in the general price level in an economy
definition of deflation
a sustained fall in the price level in an economy (negative rate of inflation)
definition of disinflation
a fall in the rate of inflation (when the rate at which prices are rising reduces, still a positive rate of inflation)
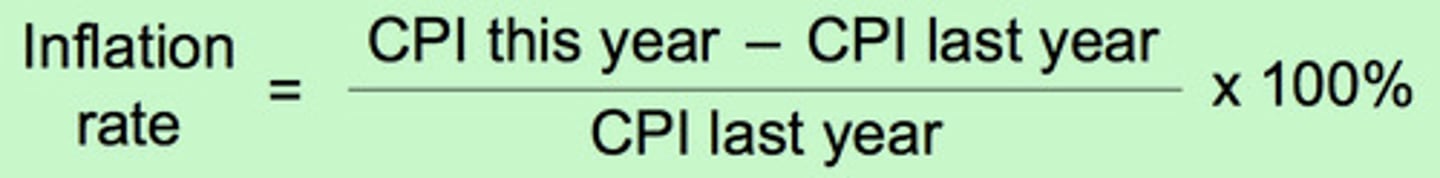
formula of inflation rate
where CPI = consumer price index which is a "market basket" of goods for a typical urban middle-class household.
calculating CPI
i) select a base year
ii) carry out a survey to find people's spending patterns
iii) attach weights to different categories (proportional to the income of the household)
iv) find out price changes
v) multiply weights by price changes
difficulties in measuring price level
- selecting base year: samples selected to determine the spending pattern may not be representative of whole population
- basket of goods and services: CPI does not reflect substitution between different types of products due to price change
- quality bias: people prefer to buy goods and services with higher price as it could be of better quality
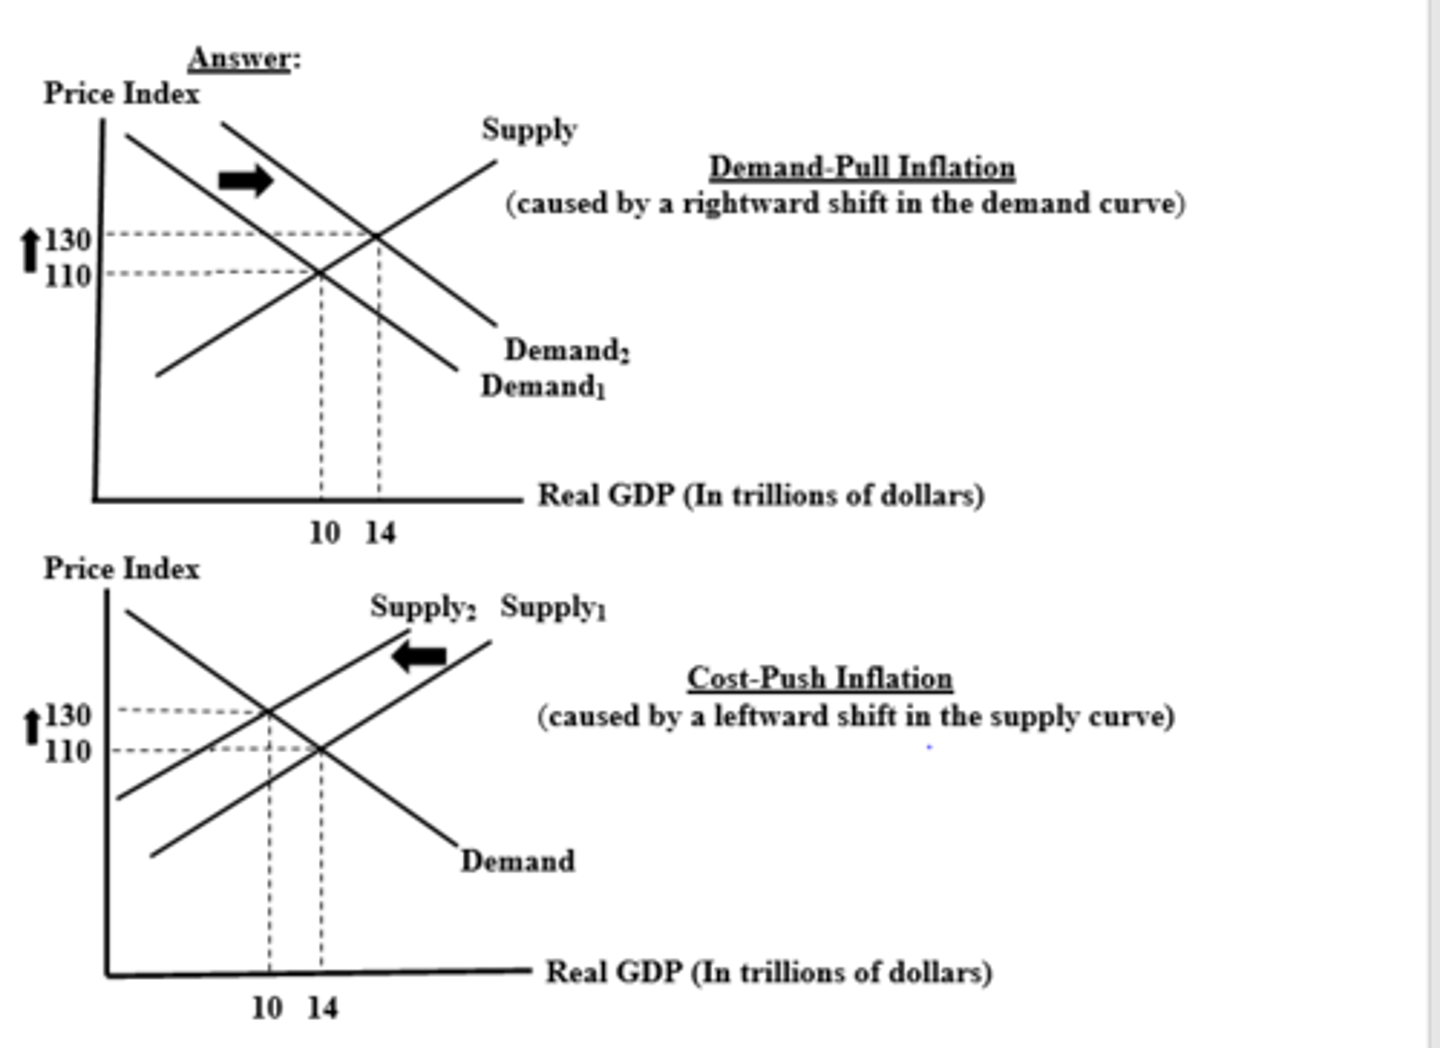
main causes of inflation
1. demand pull inflation
- occurs when an increase in AD pulls up the price level
- graphically: AD shifts rightward along a stable AS curve
- short-run: increased prices and real output
2. cost-push inflation
- occurs when an increase in the cost of production at each price level results in increased prices
- AS shifts leftward along a stable AD curve
- short run: increased prices and decreased real output (and more unemployment)
cost of inflation
- international competitiveness: exports decrease and imports increase, so net exports fall, deficit increases
- unplanned distribution of income: when the rate of interest is lower than that of the rate of inflation, borrowers gain, lenders lose
- unemployment: stagflation- due to fall in sales more works become unemployed
- menu cost: cost of changing display price of goods when price increases
- shoe leather cost: moving in and out money in search of higher rate of interest
- fiscal drag: when people or firms are pulled in to higher tax brackets due to higher income, but since inflation is also rising, they have less disposable income
consequences of inflation on consumers
- higher prices but same income
- real income falls, lower purchasing power and standard of living
- when inflation rate > rate of interest, savers are worse off
consequences of inflation on the government
consumer & investor confidence
- uncertainty in economy
- investors confidence falls
- lower long run growth potential (LRAS shifts to left, PPC shifts to left)
balance of payments - no bop, high deficit, low growth rate
- exports (falls): ped > 1, price rises, demand for foreigners falls, total revenue falls
- imports (rises): domestic goods' prices rise, consumers try to substitute them with cheaper foreign goods
consequences of inflation on producers
- cost of production rises so profit, investments and expected return falls due to uncertainty
- lower output, unemployment rises
causes of deflation
1. falling demand (AD shifts to the left)
- global recession (AD falls)
- fiscal austerity: when govt takes precautionary measures to
prevent inflation (govt expenditure falls, tax rises)
- low investors confidence, low investment (investment falls)
- fall in money supply (price falls)
2. lower costs of production (AS shifts to the right)
- lower oil prices: most common reason for cost push inflation
- improvement in technology
- import falls, export rises- increase in net exports