Data analysis
 Call Kai
 Learn
Learn Practice Test
 Spaced Repetition
 Match
Match Flashcards
 Knowt Play
1/19

There's no tags or description
Looks like no tags are added yet.
Name | Mastery | Learn | Test | Matching | Spaced | Call with Kai | Chat |
|---|
No analytics yet
Send a link to your students to track their progress
20 Terms
What is the definition of qualitative & quantitative data?
Qualitative data: data that is expressed in words & is non-numerical
Quantitative data: data that is expressed numerically, usually given as numbers
What are the strengths & limitations of qualitative data?
Strengths:
Offers much more richness of detail & provides researcher with a more meaningful insight into the participant’s worldview
Broader in scope & gives the participants more opportunity to develop their thoughts, feelings & opinions on a given subject → high external validity
Limitations:
Often difficult to analyse & patterns/comparisons within & between data may be hard to identify
Conclusions rely on subjective interpretations of the researcher & these may be subject to bias
What are the strengths & limitations of quantitative data?
Strengths:
Relatively simple to analyse & comparisons between groups can be easily drawn
Numerical data is more objective & less open to bias
Limitation:
Much narrower in scope & meaning (lacks depth & richness of detail) → may fail to represent ‘real-life’
What is the definition of primary & secondary data?
Primary data: information that has been obtained first-hand by the researcher for the purposes of a research project
Secondary data: information that has already been collected by someone else & so pre-dates the current research project
What is a strength & limitation of primary data?
Strength:
Data fits the job → authentic data obtained from the participants themselves for the purpose of a particular investigation
Limitation:
Requires time & effort on the part of the researcher
What are the strengths & limitations of secondary data?
Strength:
May be inexpensive & easily accessed, requiring minimal effort
Limitations:
May be substantial variation in the quality & accuracy of secondary data → information may first appear to be valuable & promising, but may be out-dated or incomplete
Content of the data may not quite match the researcher’s needs or objectives
What is the definition of central tendency?
The general term for any measure of the average value in a set of data (i.e. mean, median & mode)
What is the definition of mean, median & mode?
Mean: the arithmetic average calculated by adding up all the values in a set of data & dividing by the number of values there are
Median: the central value in a set of data when values are arranged from lowest to highest
Mode: the most frequently occurring value in a set of data
What is are the strengths & limitations of the mean?
Strengths:
It is the most accurate measure of central tendency as it uses the interval level measurement where the units of measurement are of equal size (e.g. seconds in time)
Takes into account all scores in the data set
Limitations:
Sensitive to extreme scores (anomalies) → so can only be used when scores are reasonably close
Mean score may not be represented in the data set itself
What are the strengths & limitations of the median?
Strengths:
It is not affected by extreme scores & is usually easier to calculate than the mean
It can be used with ordinal data (data that is in ranks) unlike the mean
Limitations:
Arranging data in ascending order may be time-consuming → problematic when dealing with large data sets
It is not as sensitive as the mean as not all of the scores are used in the calculation
It can be unrepresentative in a small set of data
What are the strengths & limitations of the mode?
Strengths:
Not affected by extreme values (anomalies)
Relatively simple to calculate
Limitations:
A data set may include two or more modes → blurs the meaning of the data, making it difficult for the researcher to form conclusions
Least reliable measure of central tendency, as it does not use all of the scores
Likely to be of little use on small data sets → may provide an unrepresentative central measure
What is the definition of measures of dispersion?
Based on the spread of scores, providing an indication of how far scores vary & differ from one another (i.e. range & standard deviation)
What is the definition of the range & standard deviation?
Range: the difference between a data set’s highest & lowest values
Standard deviation: indicate how far scores deviate from the mean (bigger SD = bigger spread of scores around mean)
What are the strengths & limitations of the range?
Strengths:
Relatively simple & easy to calculate
It takes full account of extreme scores (i.e. high & low scores)
Limitations:
It can be distorted by extreme values (anomalies)
It does not show whether the data are clustered or spread evenly around the mean
What are the strengths & limitations of standard deviation?
Strengths:
Provides information as to how the scores are distributed across a data set → indicates to what extent the data set is reliable & consistent
More sensitive than the range, as it uses all the scores in the data set → more valid representation
It allows for the interpretation of individual scores by comparing with the normal distribution curve
Limitations:
Can be skewed by extreme values (anomalies) & is less meaningful if the data are not normally distributed
It is time-consuming & harder to calculate, so could produce errors if not completed carefully
What is the definition of a scattergram & bar chart?
Scattergram: a type of graph that represents the strength & direction of an association between co-variables in a correlational analysis
Bar chart: a type of graph in which the frequency of each variable is represented by the height of the bars
What is the definition of a histogram & line graph?
Histogram: displays the frequency of continuous numerical data
Line graph: represents continuous data & uses points connected by lines to show how something changes in value (e.g. over time)
What is the definition of a normal & skewed distribution?
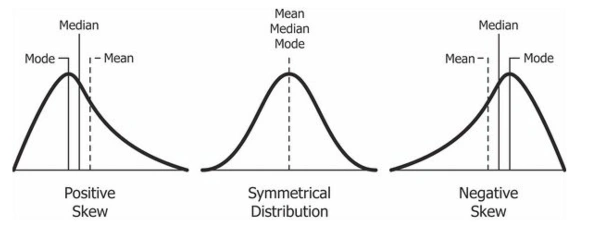
Normal distribution: a bell shaped curve that has symmetry about the centre with 50% of values less than the mean & 50% greater than the mean → the mean, median & mode will all equal the same value
Skewed distribution: a spread of frequency data that is not asymmetrical & the data clusters to one end
(think: median is always in the middle, mode is most common, so peak of curve & remaining one is mean)
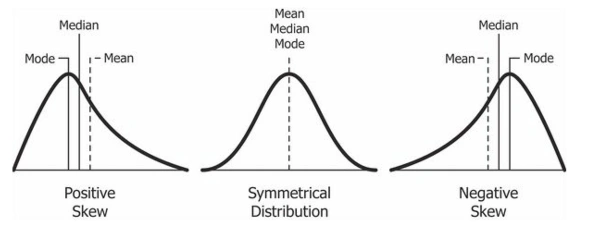
What is the definition of a positive skew?
A type of distribution in which the long tail is on the right side of the peak & most of the distribution is concentrated on the left:
skewed to the right
occurs when there is a high extreme score (or group of scores)
this causes the mean to be the highest measure of central tendency (the data has been skewed towards the top end)
the median is also higher than the mode
(think right for positive)
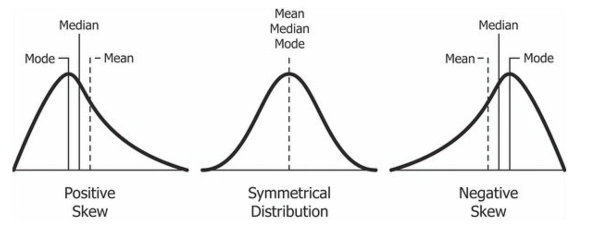
What is the definition of a negative skew?
A type of distribution in which the long tail is on the left side of the peak & most of the distribution is concentrated on the right:
skewed to the left
occurs when there is a low extreme score (or group of scores)
this causes the mean to be the lowest measure of central tendency (the data has been skewed towards the bottom end)
the median is also lower than the mode