PRAC EXAM BIO ST STITHIANS GR11/12
 Call Kai
 Learn
Learn Practice Test
 Spaced Repetition
 Match
Match Flashcards
 Knowt Play
1/41

Earn XP
Description and Tags
Name | Mastery | Learn | Test | Matching | Spaced | Call with Kai | Chat |
|---|
No analytics yet
Send a link to your students to track their progress
42 Terms
10-Minute Reading Time ~ What to do (in order)
Order of steps
Check the apparatus list against the tray of apparatus and reagents
Read the information sheet
Read the method — always before starting
Part A vs Part B
Part A — you physically conduct the prac (90 min). Tick off each method step as you complete it. Check the front cover for which skills are being assessed and call the invigilator to assess you.
Part B — EXPERIMENTAL DESIGN. You never actually do this experiment — it is entirely theoretical/written.
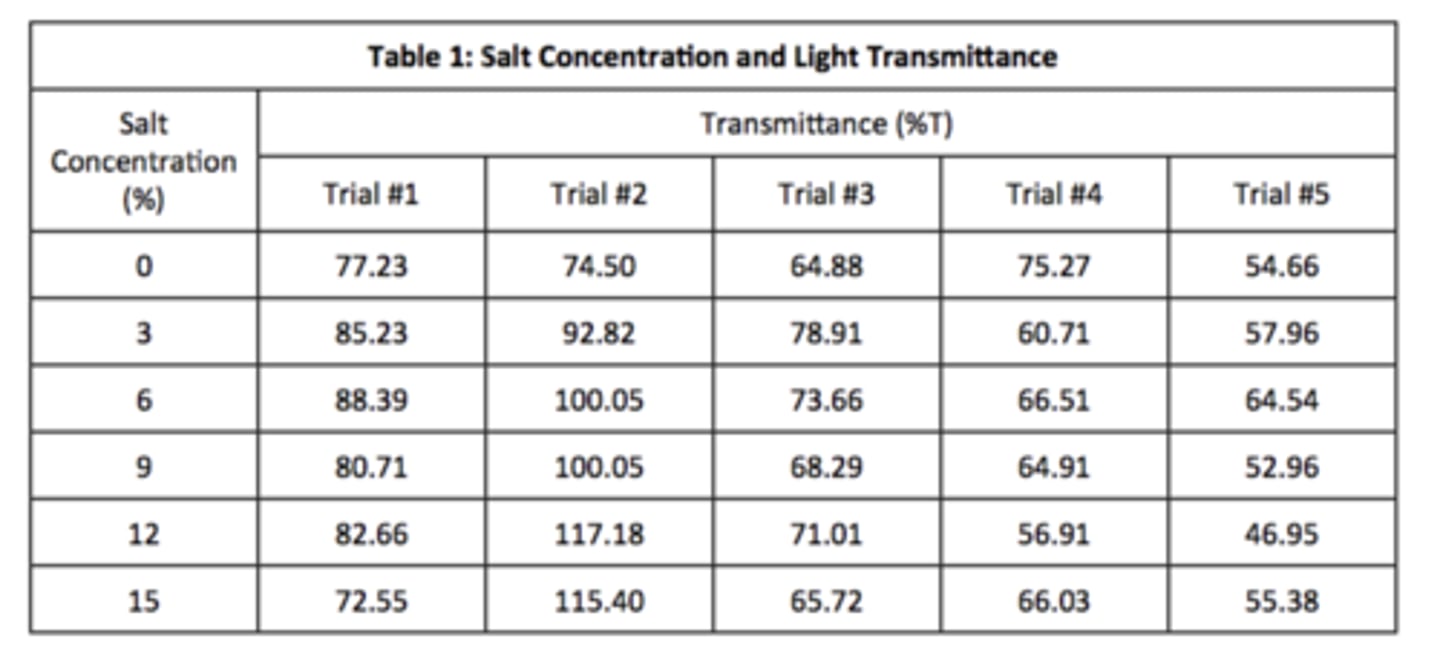
Table Heading Formula
Table showing [dependent variable] for/on [independent variable]
The heading must reflect the effect the independent variable has on the dependent variable.
Only "for" or "on" may be used to show the relationship.
Never use: "versus", "VS", "relationship" or "and".
Table Rules ~ variables & test tubes
Never refer to "test tube A/B/C/D" in a heading. You must name what is inside each tube instead
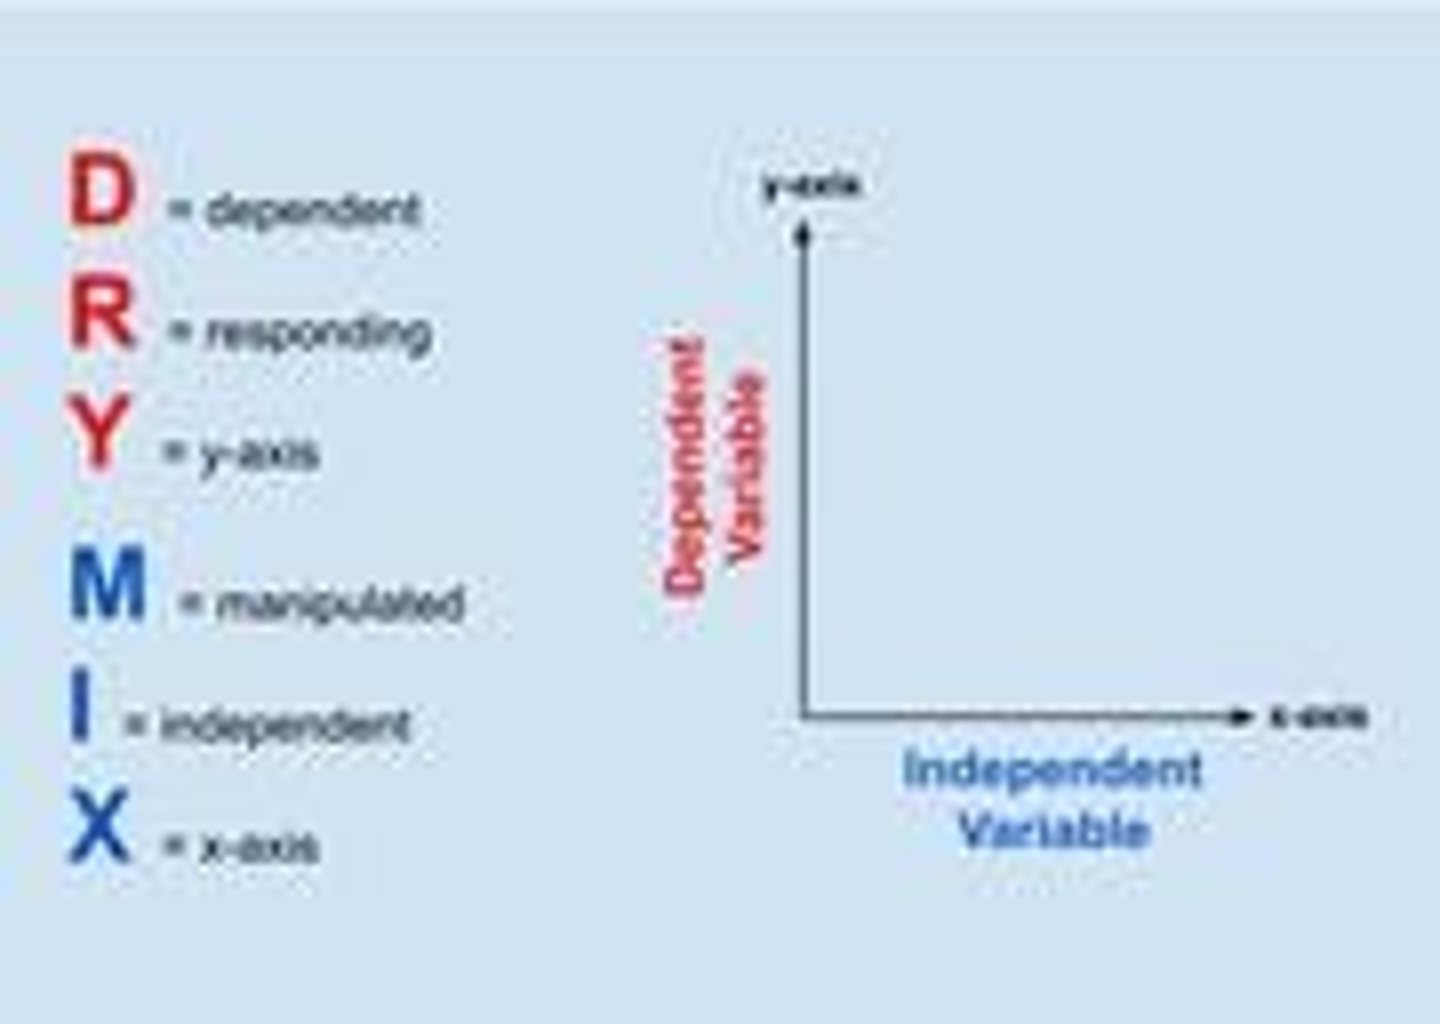
Independent variable (units) goes in column 1 = X axis
dependent variable (units) in column 2 = Y axis
Missing a complete table (all sides & internals) = −1 mark
No units in the table = −1 mark
Units in table cells = -1 mark
Recording Observations
Observations must be descriptive
Asked for final colour → state it directly, e.g. Blue or purple
Asked for colour change → give initial → final, e.g. "Clear to blue"
"Transparent" or "see-through" is NOT a colour. You MUST use the word clear
Graph Heading Formula
Dependent variable + independent variable + units.
Missing this = −1 mark.
Graph Axes
X-axis = independent variable + units (never test tube A/B/C/D — must be the actual contents)
Y-axis = dependent variable + units
Graph Drawing Rules
-Scale = bar-lines up the y-axis that count up equally
-Plot accurately, with a ruler — never freehand
-No highlighters, no colour, no shading (−1 mark)
-Bar graphs: bars equal size, gaps equal size (e.g. bars 1cm, gaps 2cm)
-Line graphs: join dots with a ruler; don't force the line to start at zero unless zero was an actual given value
When can a line graph be used?
When there is a trend in the data
When can a bar graph be used?
When there is discontinuous data
Aim
Formula = To determine [effect of IV + units] on [DV + units]
Must start with "To determine..." — no other opening words allowed
Mention both variables + units = 2 marks
3rd mark: phrase it as a statement starting with "To determine..."
The aim is usually just given in the prac TIP = read for it, don't invent one
Hypothesis
An educated prediction. It is allowed to be wrong
Asked before results → you guess
Asked after results → must be accurate
Must be written as a statement
NB! Never write "I hypothesis" or "I think"
Trick: say silently "I hypothesise that..." — whatever follows is your hypothesis
Conclusion Formula
1. A specific value of the independent variable
2. A specific result for the dependent variable
3. Link back to the aim of the experiment
A description of the relationship between variables is NOT a conclusion — no marks.
Worked example: "A concentration of 0.5% stain still changed the genetically modified cells to blue, indicating the presence of the specific gene."
VAQ Formula
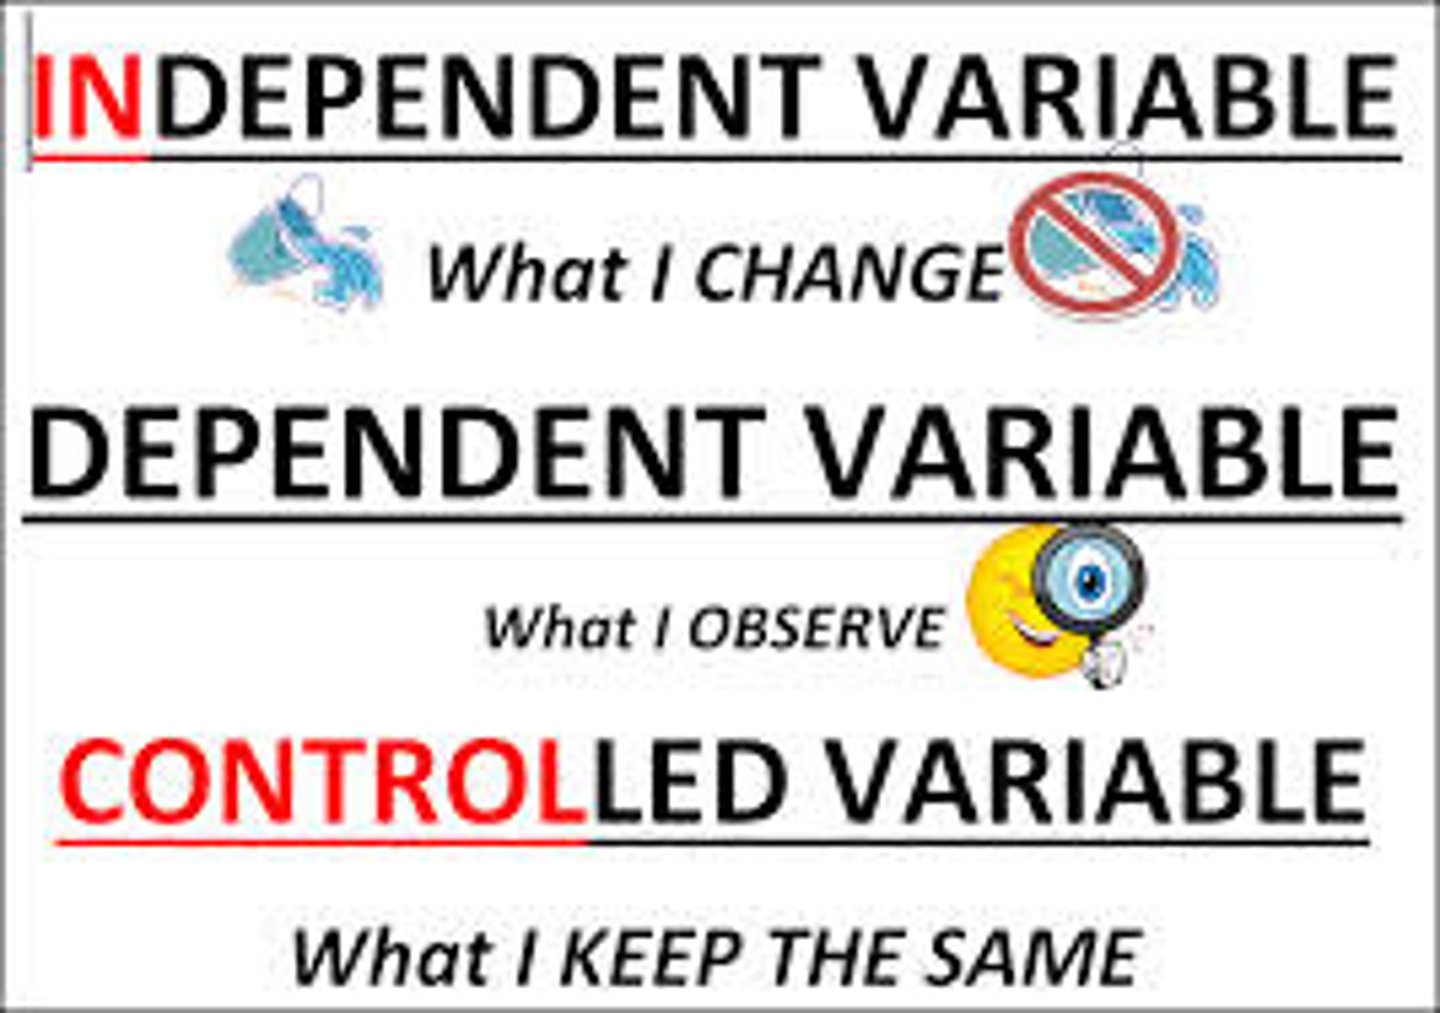
V - Variable (dependant/independant/fixed)
A - Apparatus used to manipulate the variable
Q - Quantity (units)
e.g. 10 ml (Q) of Iodine solution(V) is measured with a 20ml Syringe(A)
Controlled / Fixed Variables
TIP: Can you say "the same..."? If yes, it's a controlled variable.
You must also state how it was controlled — always give what you used and how much.
e.g. "Using a syringe, 10ml was measured for each test tube."
Control Experiment
The control is the opposite of what is being tested.
Purpose/Formula: for COMPARISON to the experiment WITHOUT THE EFFECT OF THE INDEPENDENT VARIABLE.
Capital words are compulsory for the 2 marks.
Improving an Experiment
Repeat the experiment 3 times to calculate an average.
Improve the apparatus, e.g. weigh sugar on a scale instead of an eye-level teaspoon measurement.
Safety Equipment
State the specific equipment AND why it is used.
e.g. "Gloves to prevent contact with corrosive acid."
Working Carefully (Accuracy) - 2 marks
State the apparatus + the correct action taken with it for accuracy.
e.g. "Syringe — tapped/flicked to remove excess air bubbles."
Quantitative vs Qualitative
Quantitative = actual measured readings/measurements
Qualitative = subjective observations, e.g. colour change
Ensuring Accuracy of the Prac
How you measured substances
How you conducted the prac carefully
Reliability
Refers to repeating the experiment; the more times repeated with similar results, the more reliable.
Repeating + averaging does NOT by itself equal reliability - the results must actually be similar.
Validity
Refers to fixed variables and control
- Did the investigation actually test the aim? Was it a fair test?
A fair test = only the independent variable changes; everything else (fixed variables) stays the same.
Accuracy (as an RVA term)
Refers to apparatus - how carefully you worked to get precise results.
Depends on the precision/suitability of the apparatus, e.g. using a scale instead of a measuring spoon, or a syringe instead of a dropper.
Calculations
Units at every step of the working, and the units must appear with the final answer too.
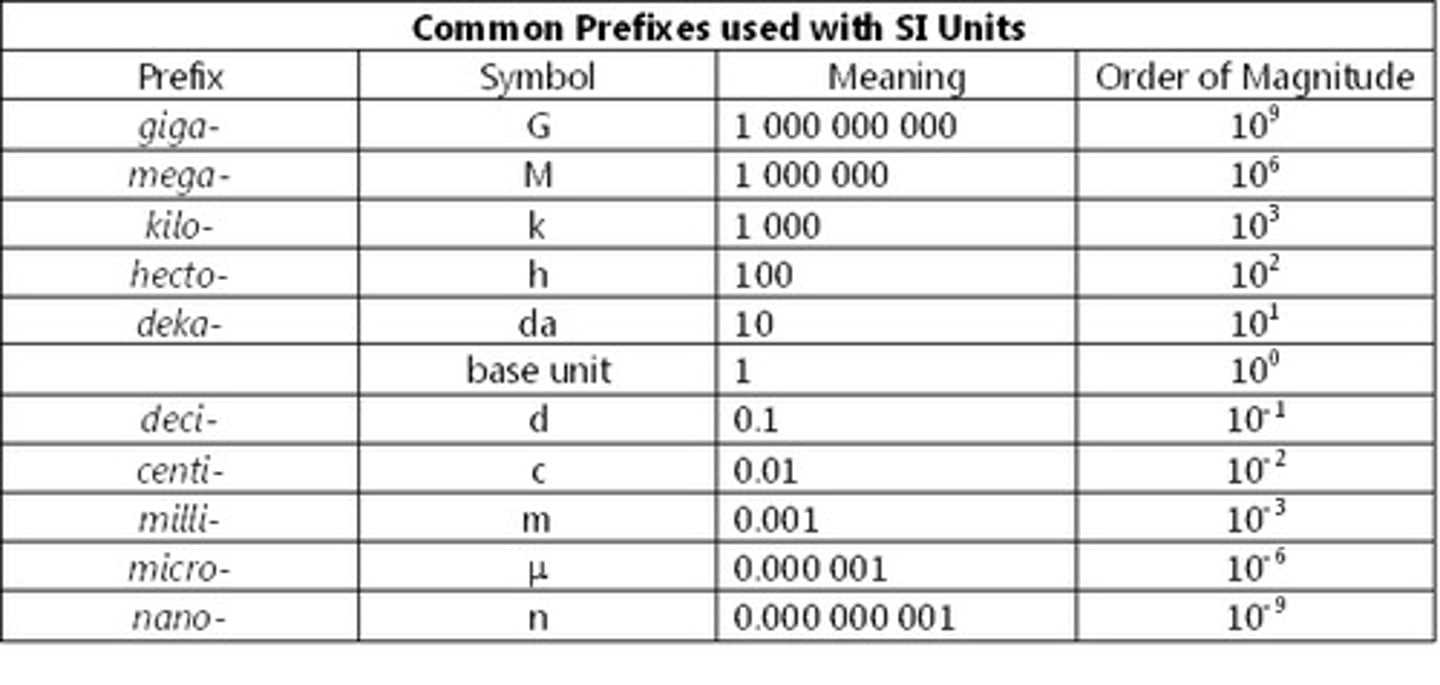
mm to um - mm x 1000
mm to nanometers(nm) - mm x 1000 x 1000/ um x1000
Total Magnification Formula
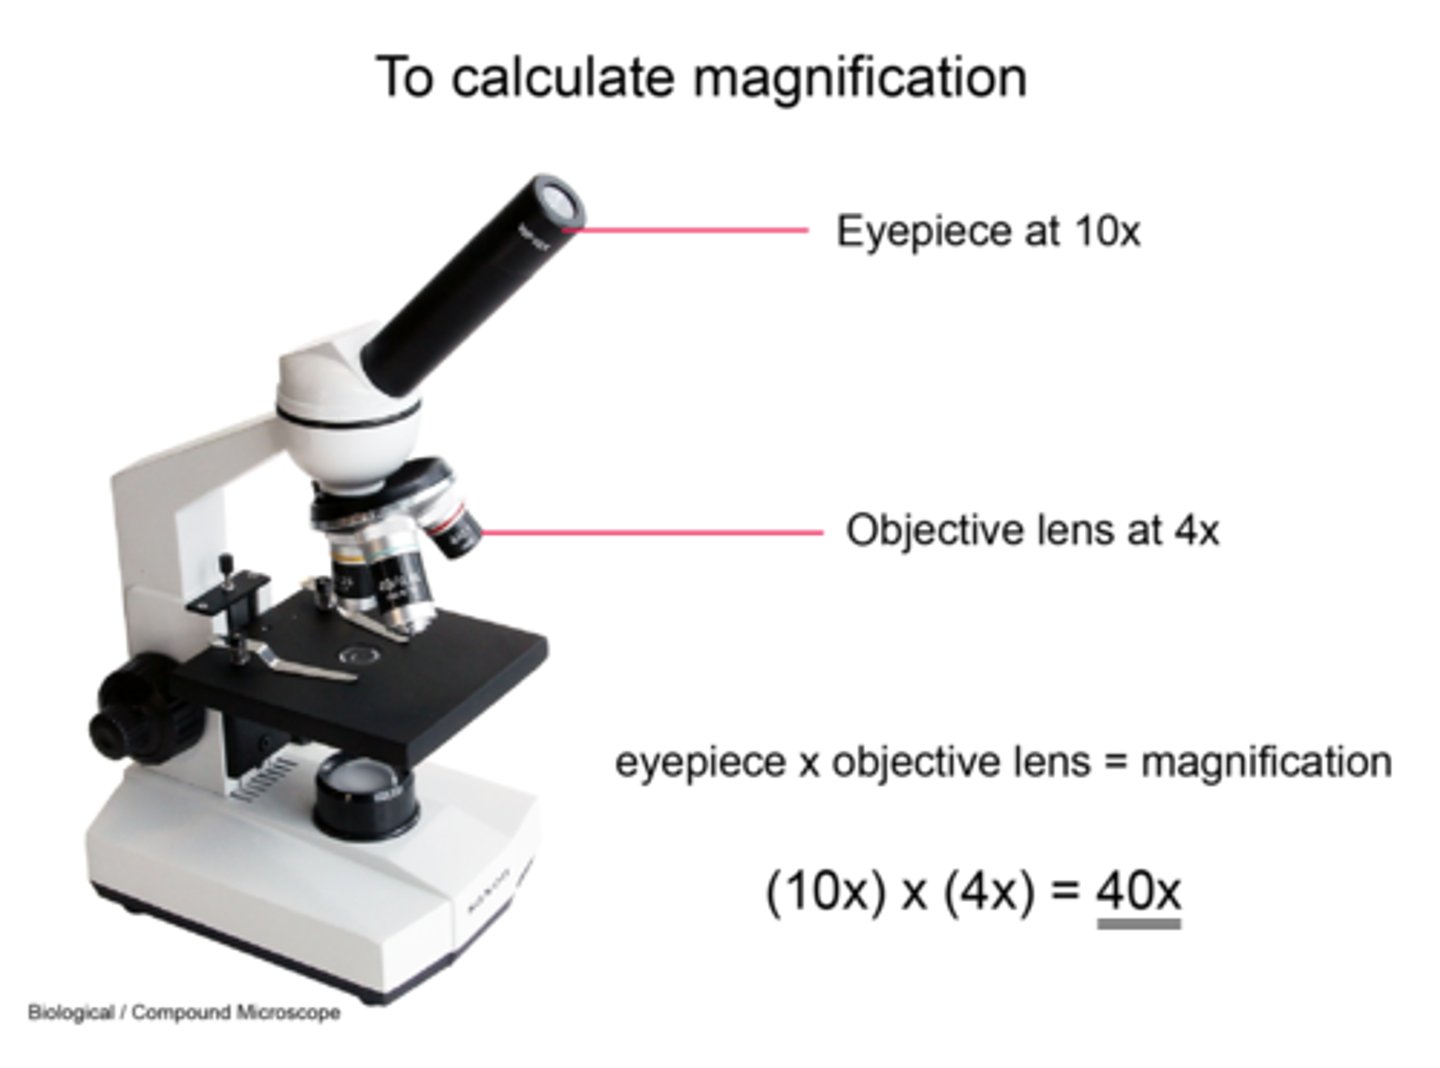
Total magnification = Eyepiece magnification × Objective lens magnification
e.g. 10x eyepiece × 40x objective = 400x total magnification.
Magnification of an Image Formula
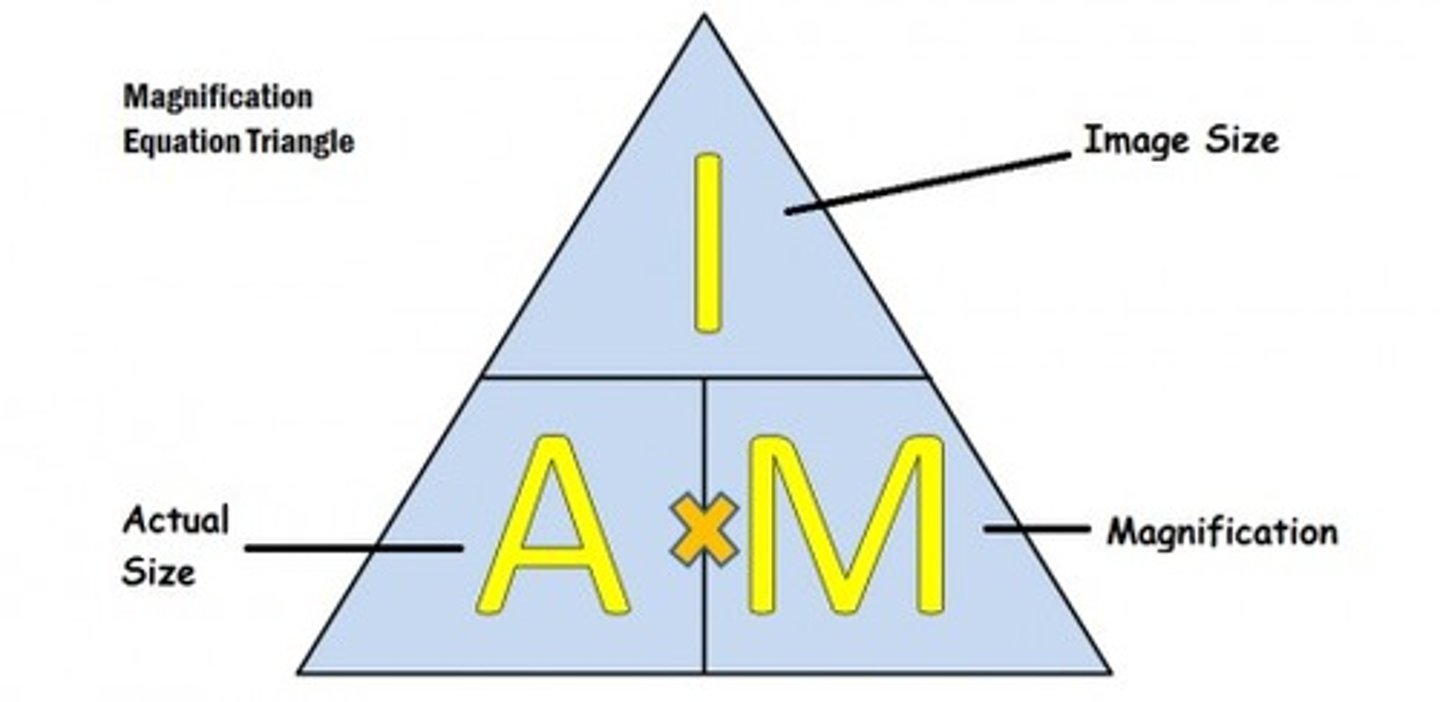
Magnification = Size of image (scale bar, mm → convert to µm) ÷ Value of the scale (µm)

Actual Size of the Object Formula
Actual size = Size of image (measured in cell, mm → convert to µm) ÷ Magnification
4 Steps to Calculate Scale of a Micrograph
1. Measure the length of AB from each dot in mm
2. Measure the length of the scale bar in mm
3. Note the value of the scale (e.g., 1 µm)
4. Substitute into: Length of AB ÷ Length of scale bar × value of scale bar = actual size
Biological Drawing Rules
-Simple, single lines only
-Descriptive heading (see section-type card)
-No shading or colouring in
-Labels in pen, one underneath the other, to the right of the drawing
-The diagram itself is drawn in sharp pencil
-Accuracy and proportion matter
-Must be bigger than 10 cm
-No 3D diagrams
Section / View Headings
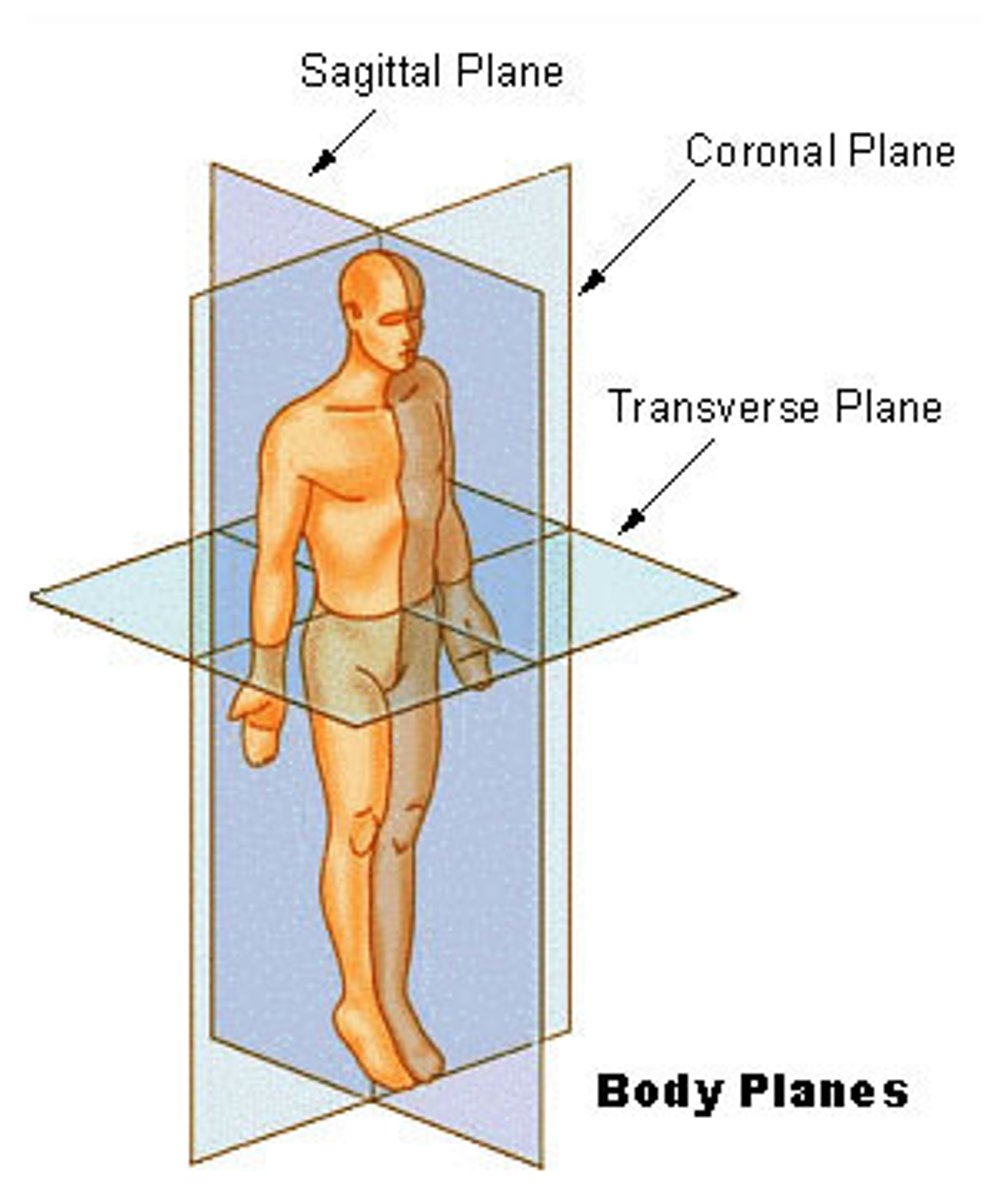
- Longitudinal (section taken top to bottom)
- Transverse/Cross section (section taken left to right)
- Frontal/Ventral view (front-facing view)
- Back/Dorsal view (rear-facing view)
- Whole specimen (used when no section is made)
Part B Overview
Experimental design (you never actually carry out this experiment; it's entirely theoretical/written.)
Aim: LOOK FOR IT - it's given, same rules as Part A.
Hypothesis: same rules as before.
Writing a Method
What you used → how much → where you put it
e.g. "Measure 10ml(Q) of water(A) using a measuring cylinder(A) into beaker A."
Plan the whole method before writing a word, like a recipe.
Method Format Rules
- Bullet points by default - avoid numbering steps
- Unless the question specifically asks for numbering, then bullets lose the mark
Markers check for:
Correct use of equipment (scale, syringe, correct volumes)
Correct measurement/marking of reagents + explanation of the control
Instructions valid & scientifically ordered
Results are measurable - state what you'll record, and repeat 3 times (RELIABILITY AND ACCURACY)
Comparing Surface Area
How to phrase a surface-area comparison in a method
e.g. a crushed tablet vs a whole tablet, or finely chopped vs chunky pieces.
Making a Specific Concentration
The concentration must be made as part of the method, not just stated
e.g. 5% vinegar = 5ml vinegar made up to 100ml with water
e.g. 1% glucose (for Benedict's test) = weigh 1g glucose into 100ml water
Always note the units of the concentration given
Testing for Concentration/Temperature Specificity
Use one value lower and one value higher than the value given.
e.g. given 100mg/L → test 50, 100 and 150mg/L.
NB! The same rule applies to temperature questions.
e.g. given 100`C → test 50, 100 and 150`C.
NB! The same rule applies to pH questions.
e.g. given pH 7 → test an acid(pH 1-6) and test a base(pH 7- 14)
Serial Dilutions
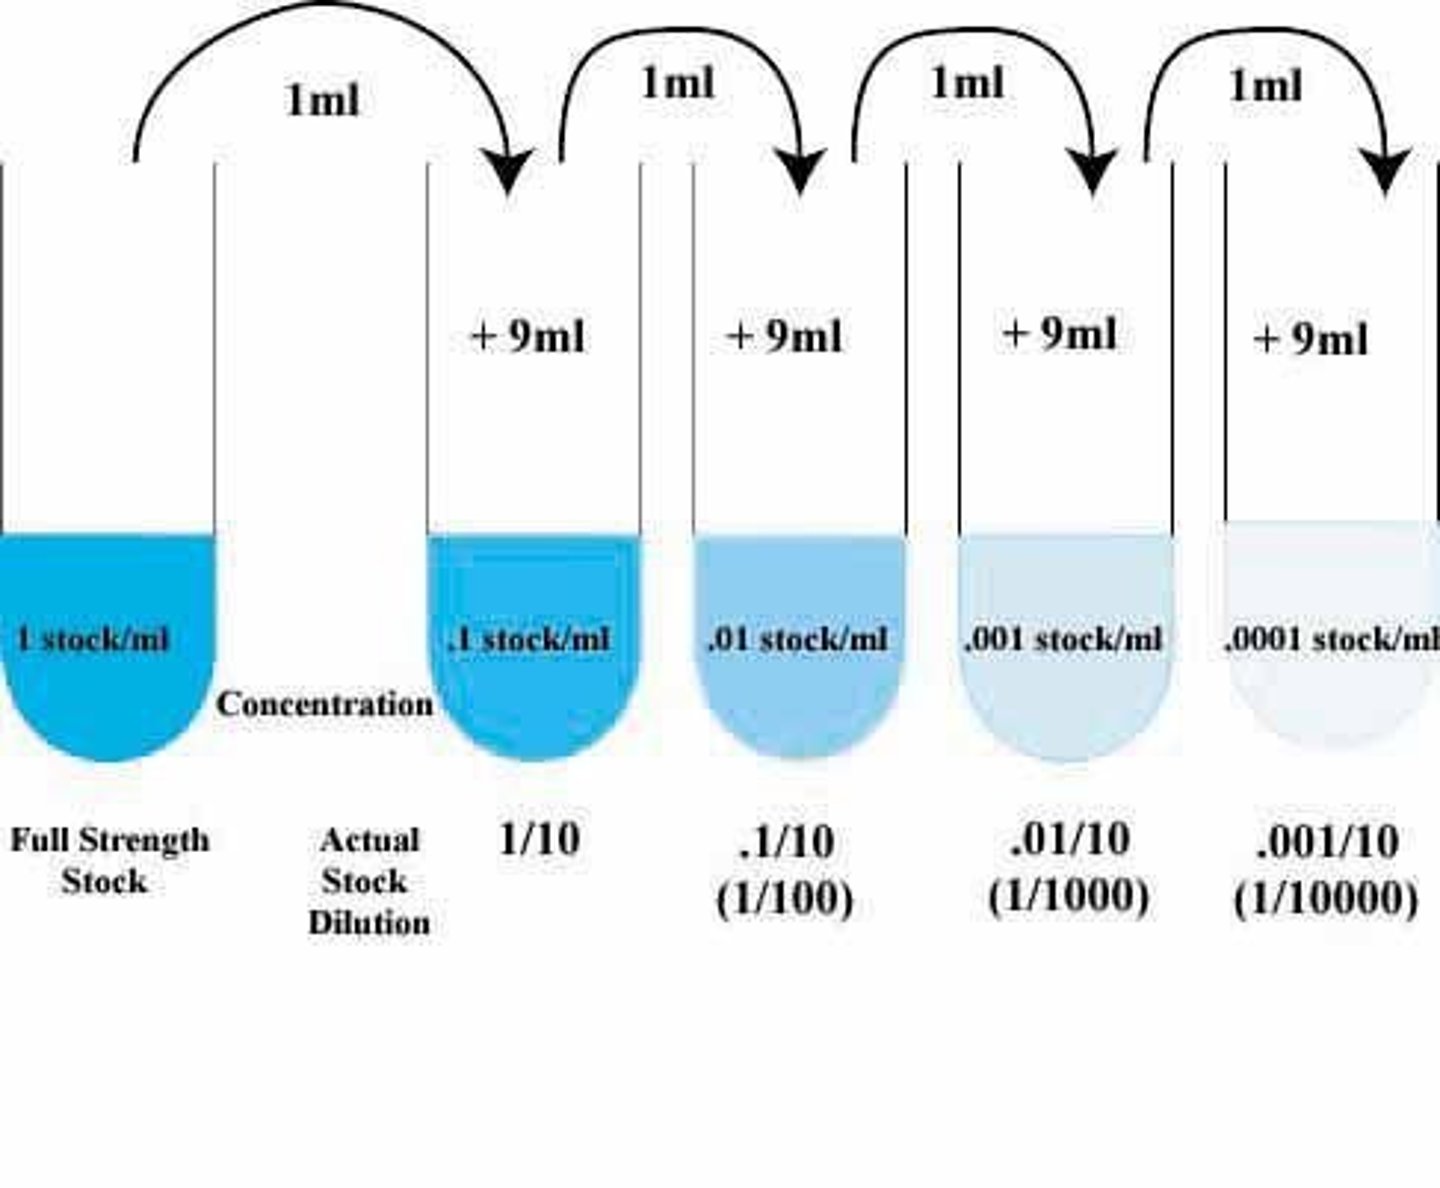
A series of solutions, each diluted from the previous one (not from the original each time).
e.g. 1ml of solution added to 100ml water → dilution of 1:100, carried forward each step
Realistic Apparatus Volumes
Think about real capacities: a test tube holds ~40ml - Don't add 200ml to one
NB! A heaped teaspoon is not an acceptable way to measure powder - use a scale
Checking Specific Conditions
- Read the information sheet carefully first
- Does it need a specific temperature or pH?
- Does it need an activation ingredient added?
- If testing a specific range, base it on concentration/temperature/pH — e.g. testing 5% vinegar → use 10%, 5% and 2.5%
What You Need to Bring
- Ruler
- Calculator
- Your own permanent marker
- Pencil + sharpener
- 2/3 pens — the same and that all work
General Knowledge Needed
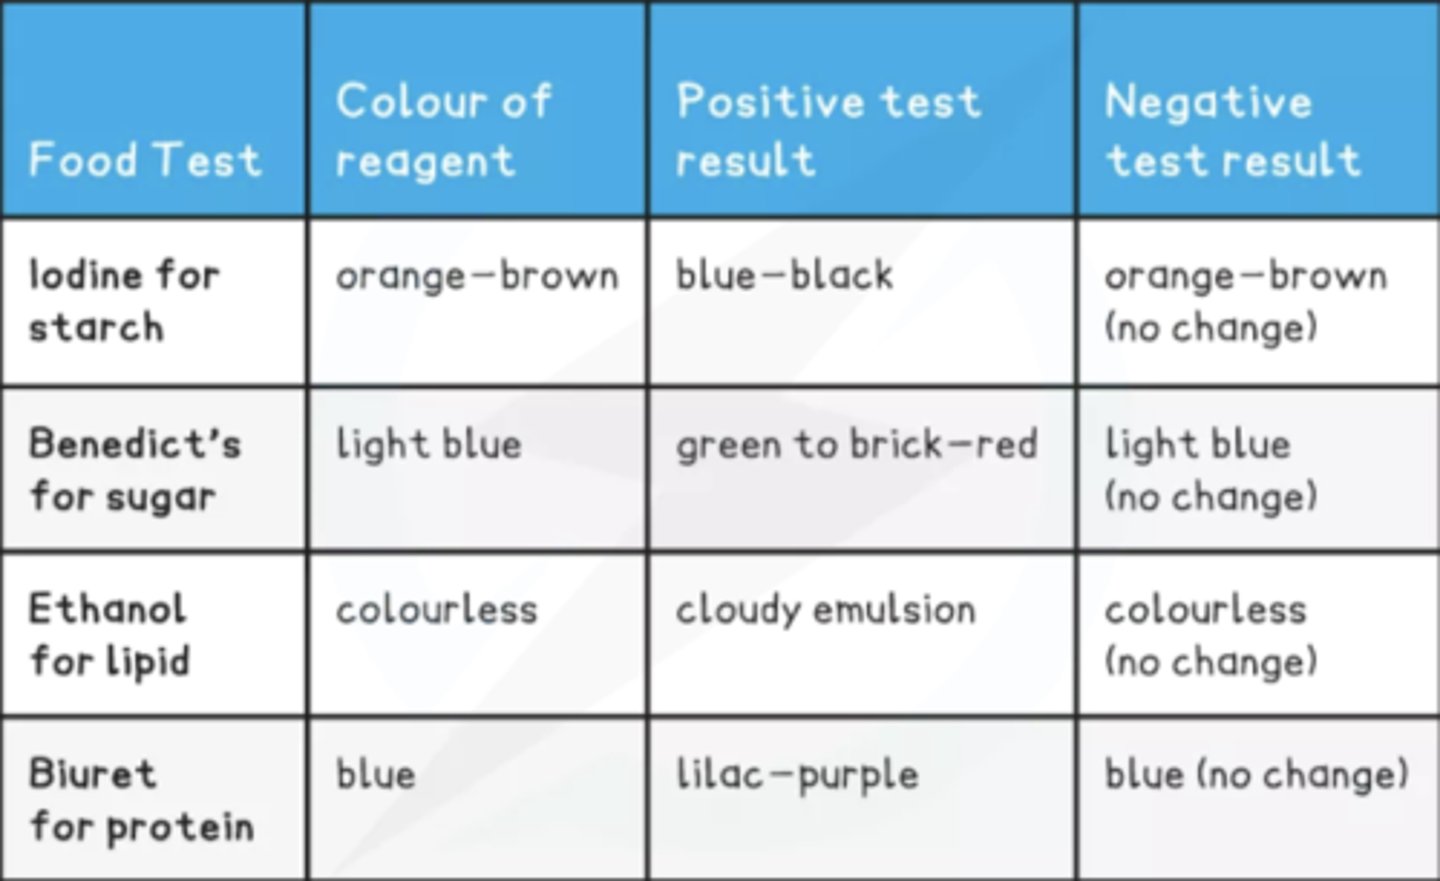
- Food tests
- Scale, magnification & micrographs
- Biological drawings
- Tables
- Graphs
- Enzymes (temperature, pH)