AP Biology - Unit 0 Statistics
1/20
Earn XP
Name | Mastery | Learn | Test | Matching | Spaced |
|---|
No study sessions yet.
21 Terms
Descriptive Statistics
Methods used to summarize observations in data or variability.
Inferential Statistics
Using observations to make estimates or pedications by generalizing a sample to a population.
Sample
A small and random group selected from a population as a representative.
Population
All members of the group being studied.
Histogram
A visualization of the distribution of quantitative data: the x-axis is the data while the y-axis is the frequency.
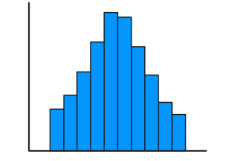
Normal Distribution
Symmetric and Unimodal (often “approximately normal” distribution)
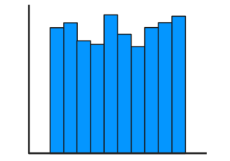
Uniform Distribution
Symmetric or Asymmetric, all outcomes are equally likely
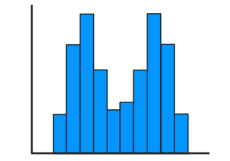
Bimodal Distribution
Symmetric or Asymmetric, Two Modes, Possibly Skewed
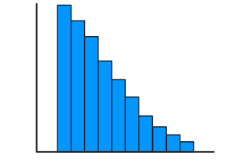
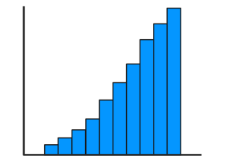
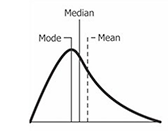
Positive Skewed
Right Skewed, Unimodal
Negative Skewed
Left Skewed, Unimodal
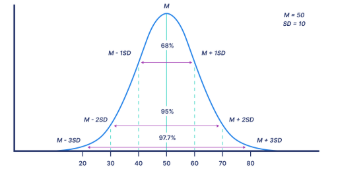
Standard Deviations
Used to describe a normal dirstirbution in combination with the mean, with the data being spread out at (± # SD) (avg. amount the data deviates from the mean)
Standard Deviation Percentages
68% percent, 95% percent, and 99.7% percent
Approximately Normal Distributions
Meam = Median = Mode
Interquartile Range (IQR)
Used to describe non-normal distributions and measures the spread of the middle 50% of data.
Central Tendancy of Skewed Distributions
The median is the least distorted by skewed data.
To solve for the IQR:
Q3 - Q1 = IQR
IQR is represented by the…
Box and Whisker Plot
The percentages for each quartile in the IQR are:
25% (Q1), 50% (Q2), 75% (Q3) and 100% (Q4)
The Q2 is equal to the data's…
Median
The Standard Error of the Mean (SEM)
Used to assess how accurately the sample estimates the actual population mean. (Mean ± 2 SEM)
The 95% CI (Confidence Intervals)
The upper and lower error bars around a the data's mean in a graph to show if results indicate a significant statistical difference.