Year 10 Geography
1/82
There's no tags or description
Looks like no tags are added yet.
Name | Mastery | Learn | Test | Matching | Spaced | Call with Kai |
|---|
No analytics yet
Send a link to your students to track their progress
83 Terms
Natural features
The physical features of the Earth, such as rivers or oceans
Cultural features
The human built features of the earth
Legend
A list or box that identifies patterns, symbols, or colours and what they represent in a map
Eastings
Vertical lines that increase in value as you move east on a map
Northings
Horizontal lines that increase in value as you move north
Area references
4-digit coordinates given to direct to a particular grid square
Corner of a square represented by an area reference
Bottom left
Area reference use case
To provide the location of a general area
Area reference prefix
AR
Grid references
6-digit coordinates given to direct to a particular grid square and a particular location inside of it
Order of digits in grid references
Eastings, easting mini-grid, northings, northing mini-grid
Grid refernce prefix
GR
Cardinal points
North, East, South and West
Inter-cardinal points
Points on the compass that lie between the main four cardinal points
East in bearings
90 degrees
Closely spaced contour lines
Land has a steep gradient
Distantly spaced contour lines
Land has a shallow gradient
Contour lines
A line on a map joining points of equal height above or below sea level.
1:100 000
1 centimetre on the map is equal to 100 000 on the ground
100 000 centimetres in kilometres
1km
Secondary inter-cardinal points
North-north-east, east-north-east, etc.
Spot height
Shows the actual height of a particular spot on a map
Types of scale
Written, line, ratio
Line scale
A straight-line ruler is provided that shows you the relationship between centimetres and another unit of measurement.
Written scale
A scale written in words such as 'one centimetre on the map represents one kilometre on the ground'.
Ratio scale
A ratio with one centimetre on the left and the corresponding real-life distance provided on the right.
BOLTSS
Essential features of a map
B
Border
O
Orientation
L
Legend
T
Title
S
Scale
S (second)
Source
Geography
The study of relationships between humans and the environment
Physical geography
The study of physical features of the earth's surface, how it was formed and continues to change
Human (cultural) geography
The study of people and how they interact with the environment
Two basic types of map
Maps that summarise the landscape and maps that describe or comment on the landscape (thematic maps)
Physical maps
Shows physical landscape features
Political maps
Government boundaries of countries, nations
Social maps
Social aspects of the human population
Synoptic maps
Used to display weather conditions
Climate maps
Show climate data
Chloropleth maps
Use shadings or colour to show the average density or concentration of a particular feature in an area
Example of a chloropleth map
Colour shadings to indicate the voter turnout in different states
Three types of environmental change
Changes to land, changes to atmosphere and changes to water
Examples of changes to land
Deforestation, soil erosion, and urbanisation
Examples of changes to air
Climate change, air pollution, and ozone layer depletion
Examples of changes to water
Ocean acidification, water pollution, and overfishing
Ocean acidification
The increasing acidity, measure in "ph" of water in the ocean as a result of increasing carbon dioxide levels in the atmosphere.
Water pollution
The contamination of streams, rivers, lakes, oceans, or groundwater with substances produced through human activities
Overfishing
Removing more fish from the oceans or water bodies than can be naturally produced
Coral bleaching
Occurs when a coral becomes stressed and expels most of its colourful algae, leaving an underlying ghostly white skeleton of calcium carbonate
Climate change
Long-term shifts in temperature and weather patterns, typically as a result of human activities
Air pollution
The contamination of the atmosphere by the introduction of pollutants from human and natural sources
Ozone layer depletion
The thinning of the ozone layer present in the upper atmosphere
Deforestation
The loss of trees through human means
Soil erosion
Wearing away of surface soil by water and wind
Urbanisation
The process of making an area urban
Loss of biodiversity
The declining number and variety of the species in an area
Land pollution
The contamination of land by both solid or liquid waste
Land degradation
The negative trend in land condition as a result of human or non-human means.
Causes of urbanisation
Natural increase, rural-urban migration, location, economic development.
World views
The different ways people view the environment, humans, and the relationship between the two.
Human centred world views
Egocentric and anthropocentric
Earth-centred world views
Ecocentric and biocentric
Egocentric world view
I am the most important creature on Earth. Everything and everyone else is important to the extent that they support me and my lifestyle.
Anthropocentric world view
Humans are the most important species. We are in
charge of the Earth and the natural world. We can use nature to support us and our lifestyle.
Ecocentric world view
We should do whatever we can to minimise our impact and preserve the Earth's biodiversity. We are no more important than any other organism.
Biocentric world view
We have a responsibility to use the Earth's resources in a sustainable way. Other species may be useful to us but they also have as much right to exist as we do.
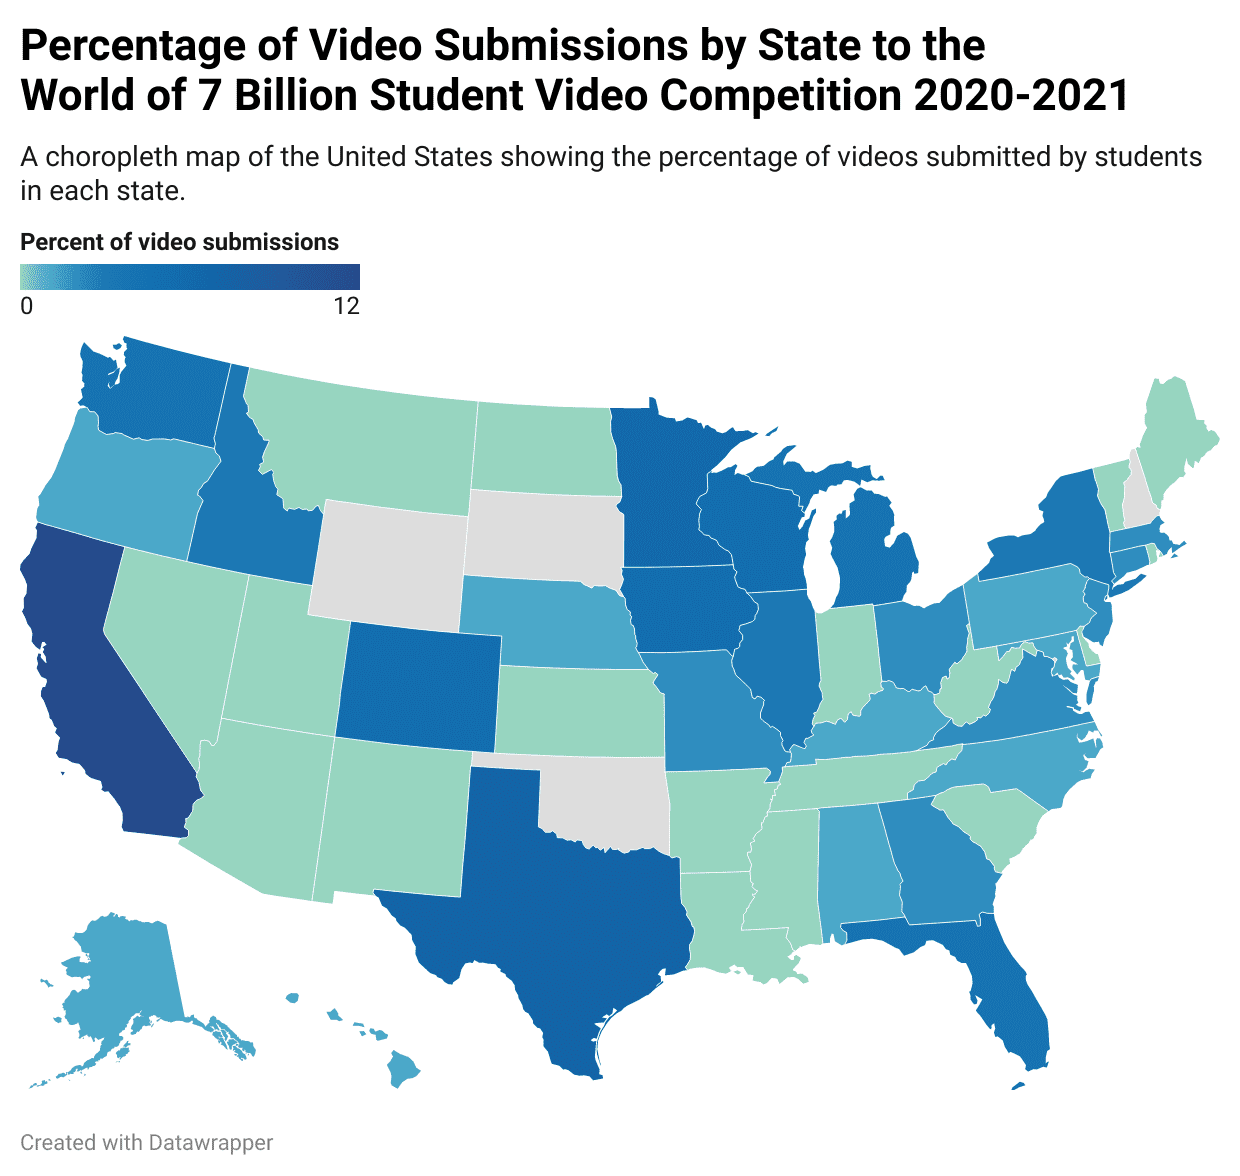
What type of map is this
Chloropleth
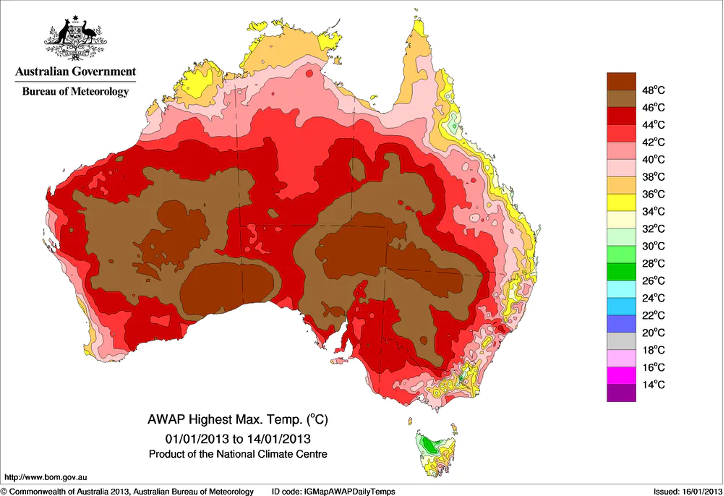
What type of map is this?
Climate map (or maybe synoptic I don’t know good luck)
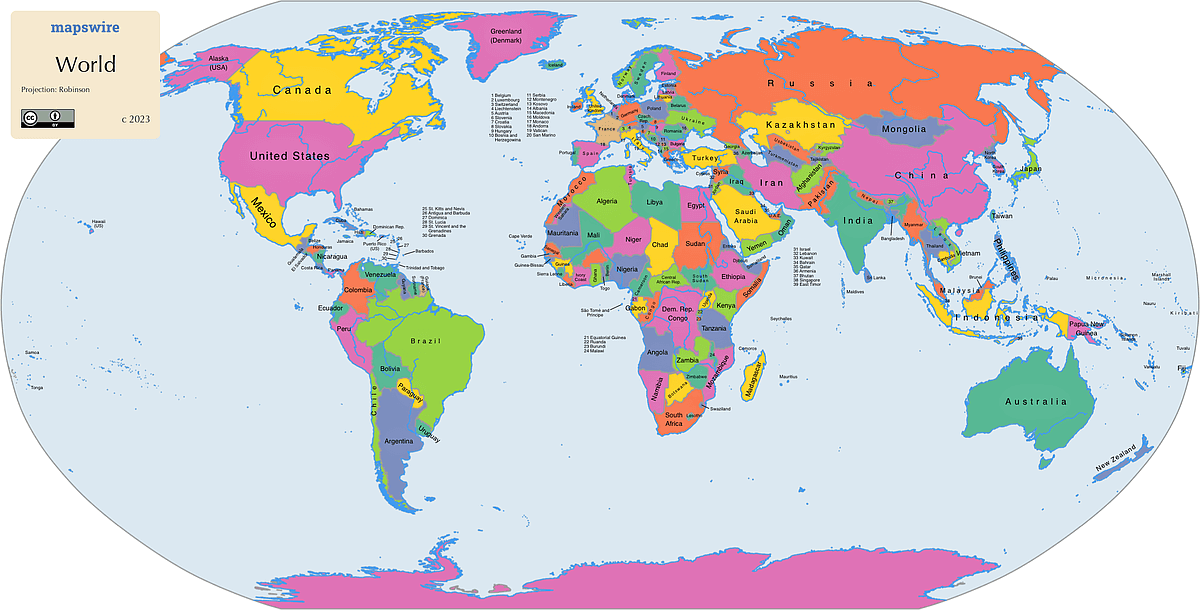
What type of map is this?
Political
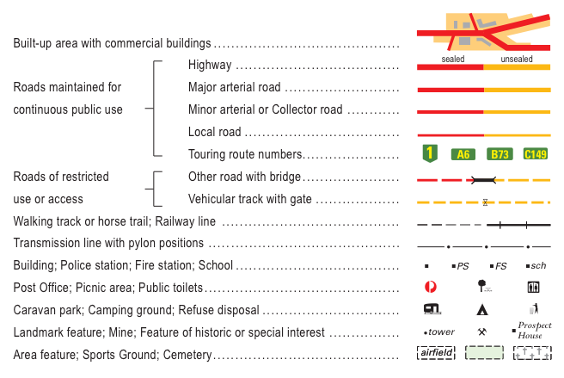
What is the symbol for a walking track
_ _ _
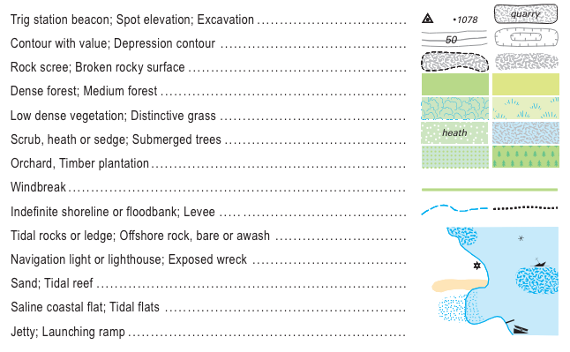
What is the symbol for a windbreak
A green line
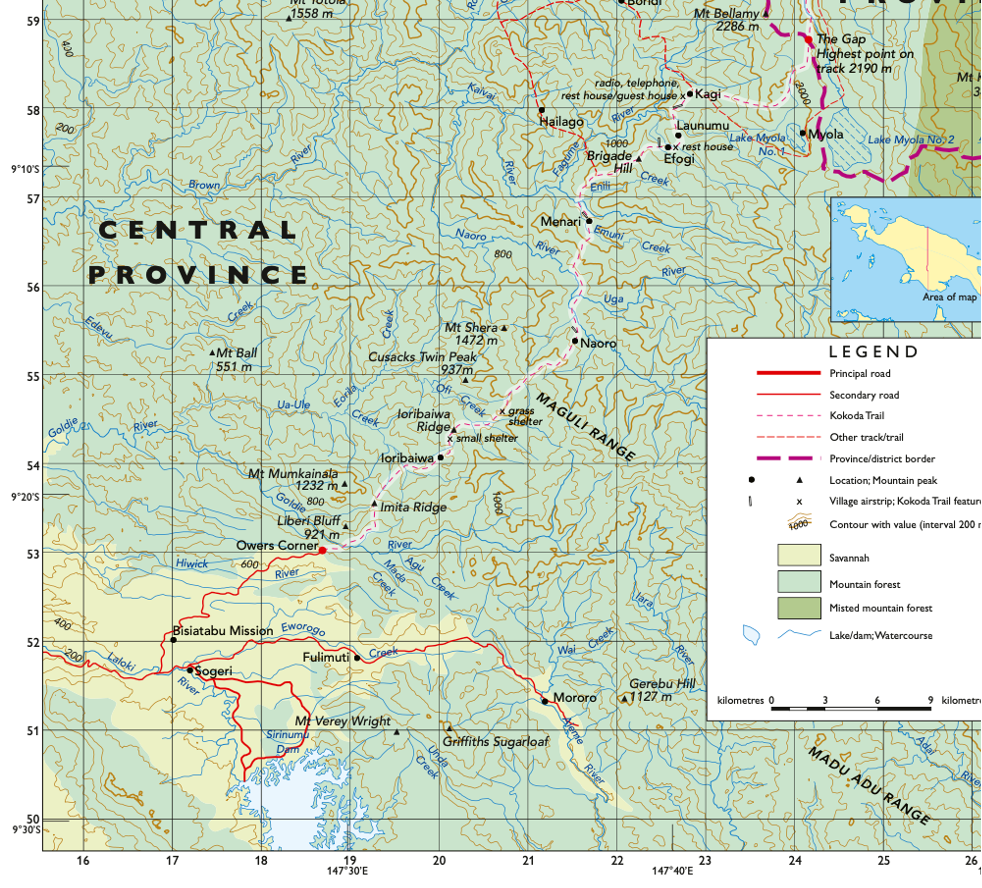
Provide an area reference for Naoro
AR2155

Provide an area reference for Maola
AR2457

Provide a grid reference for Mt Shera
GR208556

Provide a grid reference for Mororo
GR212514
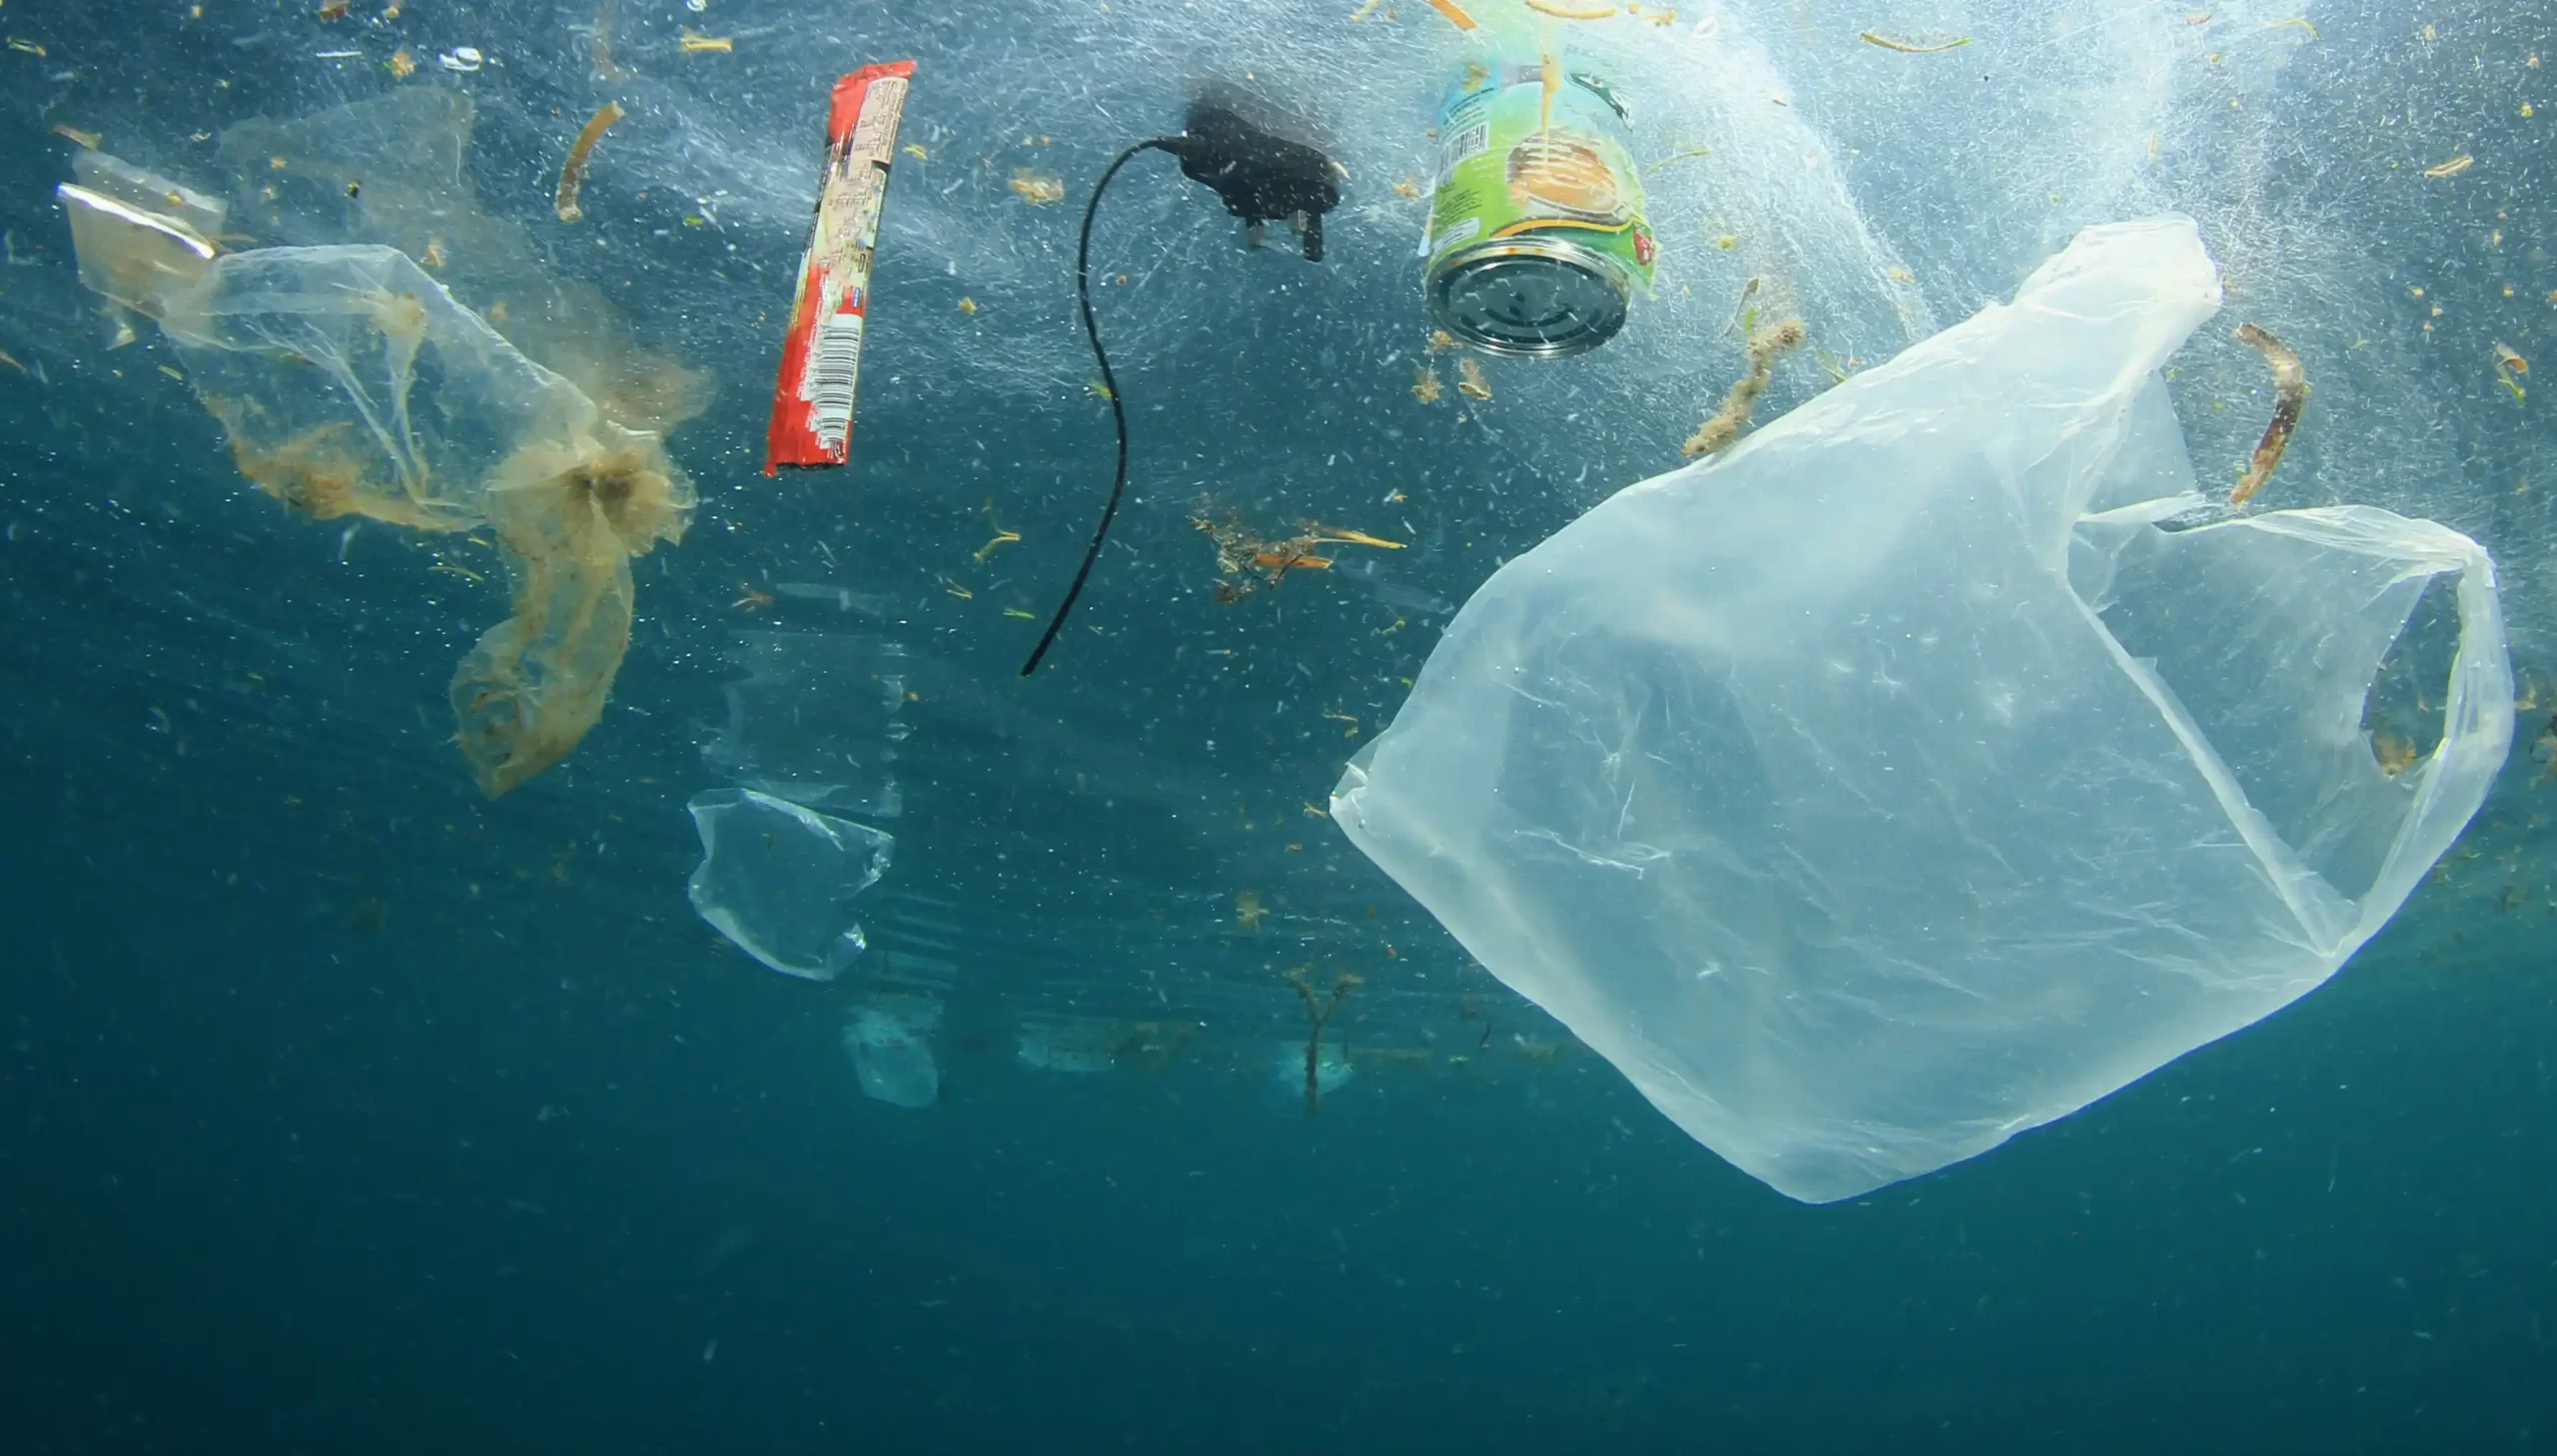
What is this?
Water pollution
Urban developer world view
Human-centric
Oil and gas executive world view
Human-centric
Environmental activist world view
Earth-centric